3195
IDEAL-IQ MR Imaging at 3 T for the Quantification of Fat: A Phantom Study1Diagnostic and Interventional Radiology, Osaka University Graduate School of Medicine, Suita, Japan, 2University of Groningen, Groningen, Netherlands, 3Radiology, Osaka University Hospital, Suita, Japan
Synopsis
The purpose of this study was to evaluate the accuracy of fat quantification and the effects of iron on the measurement in IDEAL-IQ MR imaging at 3 Tesla by comparing the results of MRS using a fat-water-iron phantom. A gel phantom comprised of twenty-eight vials containing various proportions of fat and iron was constructed. Fat fraction and R2* value were measured by IDEAL-IQ and MRS on a 3-T scanner. This study showed that IDEAL-IQ yielded an accurate quantification of fat content with a smaller degree of error due to susceptibility effects of iron compared to MRS at 3 Tesla.
INTRODUCTION
Quantifying fat in the liver is crucial for assessing fatty liver disease or selecting donors for living donor liver transplantation. Although biopsy has been the reference standard for liver fat quantification, researchers have tried to assess fat in the liver with non-invasive imaging techniques such as ultrasonography, computed tomography, or magnetic resonance (MR) imaging. Among them, MR imaging has a potential to quantify fat with a high degree of accuracy.1 Recently, a 6-point Dixon MR technique (iterative decomposition of water and fat with echo asymmetry and least-squares estimation, IDEAL-IQ, GE Healthcare) has been clinically available as a tool to quantify fat content as well as to evaluate R2* relaxation in the entire liver. However, the accuracy of the technique has not been well investigated. The purpose of this study was to evaluate the accuracy of fat quantification and also the effect of iron on the measurement in IDEAL-IQ MR imaging at 3 Tesla by comparing the results of MR spectroscopy (MRS) using a fat-water-iron phantom.METHODS
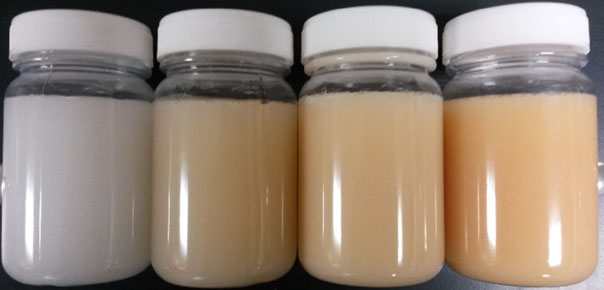
A gel phantom comprised of twenty-eight vials containing various proportions of fat (volume percentages: 0, 1, 3, 5, 10, 20, and 40%; peanut oil) and iron (iron concentrations: 0, 10, 20, 40 µg/mL; super-paramagnetic iron oxide; Resovist) was constructed as described in the literature (Fig. 1).2 MR imaging was performed on a 3-T scanner (Discovery MR750 3.0T, GE) using IDEAL-IQ (TR / TE, 6.7 / 3.0 ms; FA, 3°; matrix, 128 x 128; FOV, 34 cm; thickness, 8 mm; slice, 24; imaging time, 23 s). MRS was performed using single voxel STEAM (Voxel size, 2.5 x 2.5 x 2.5 cm; TR / TE, 3000 / 14 ms; NEX, 4; acquisition time, 84 s) on the same scanner. Region of interest measurements were taken on IDEAL-IQ images by one observer. MRS data was analyzed using a software (LCModel, L.A.Systems Inc.). The relationships between known fat fraction versus MR-measured fat fraction and between IDEAL-IQ-measured R2* value versus MRS-measured R2* value were assessed using linear regression analysis. Multiple linear regression analysis was also performed using a model in which the dependent variables were fat fraction and R2* values measured by IDEAL-IQ and MRS and the independent variables of known fat fraction and known iron concentration.RESULTS
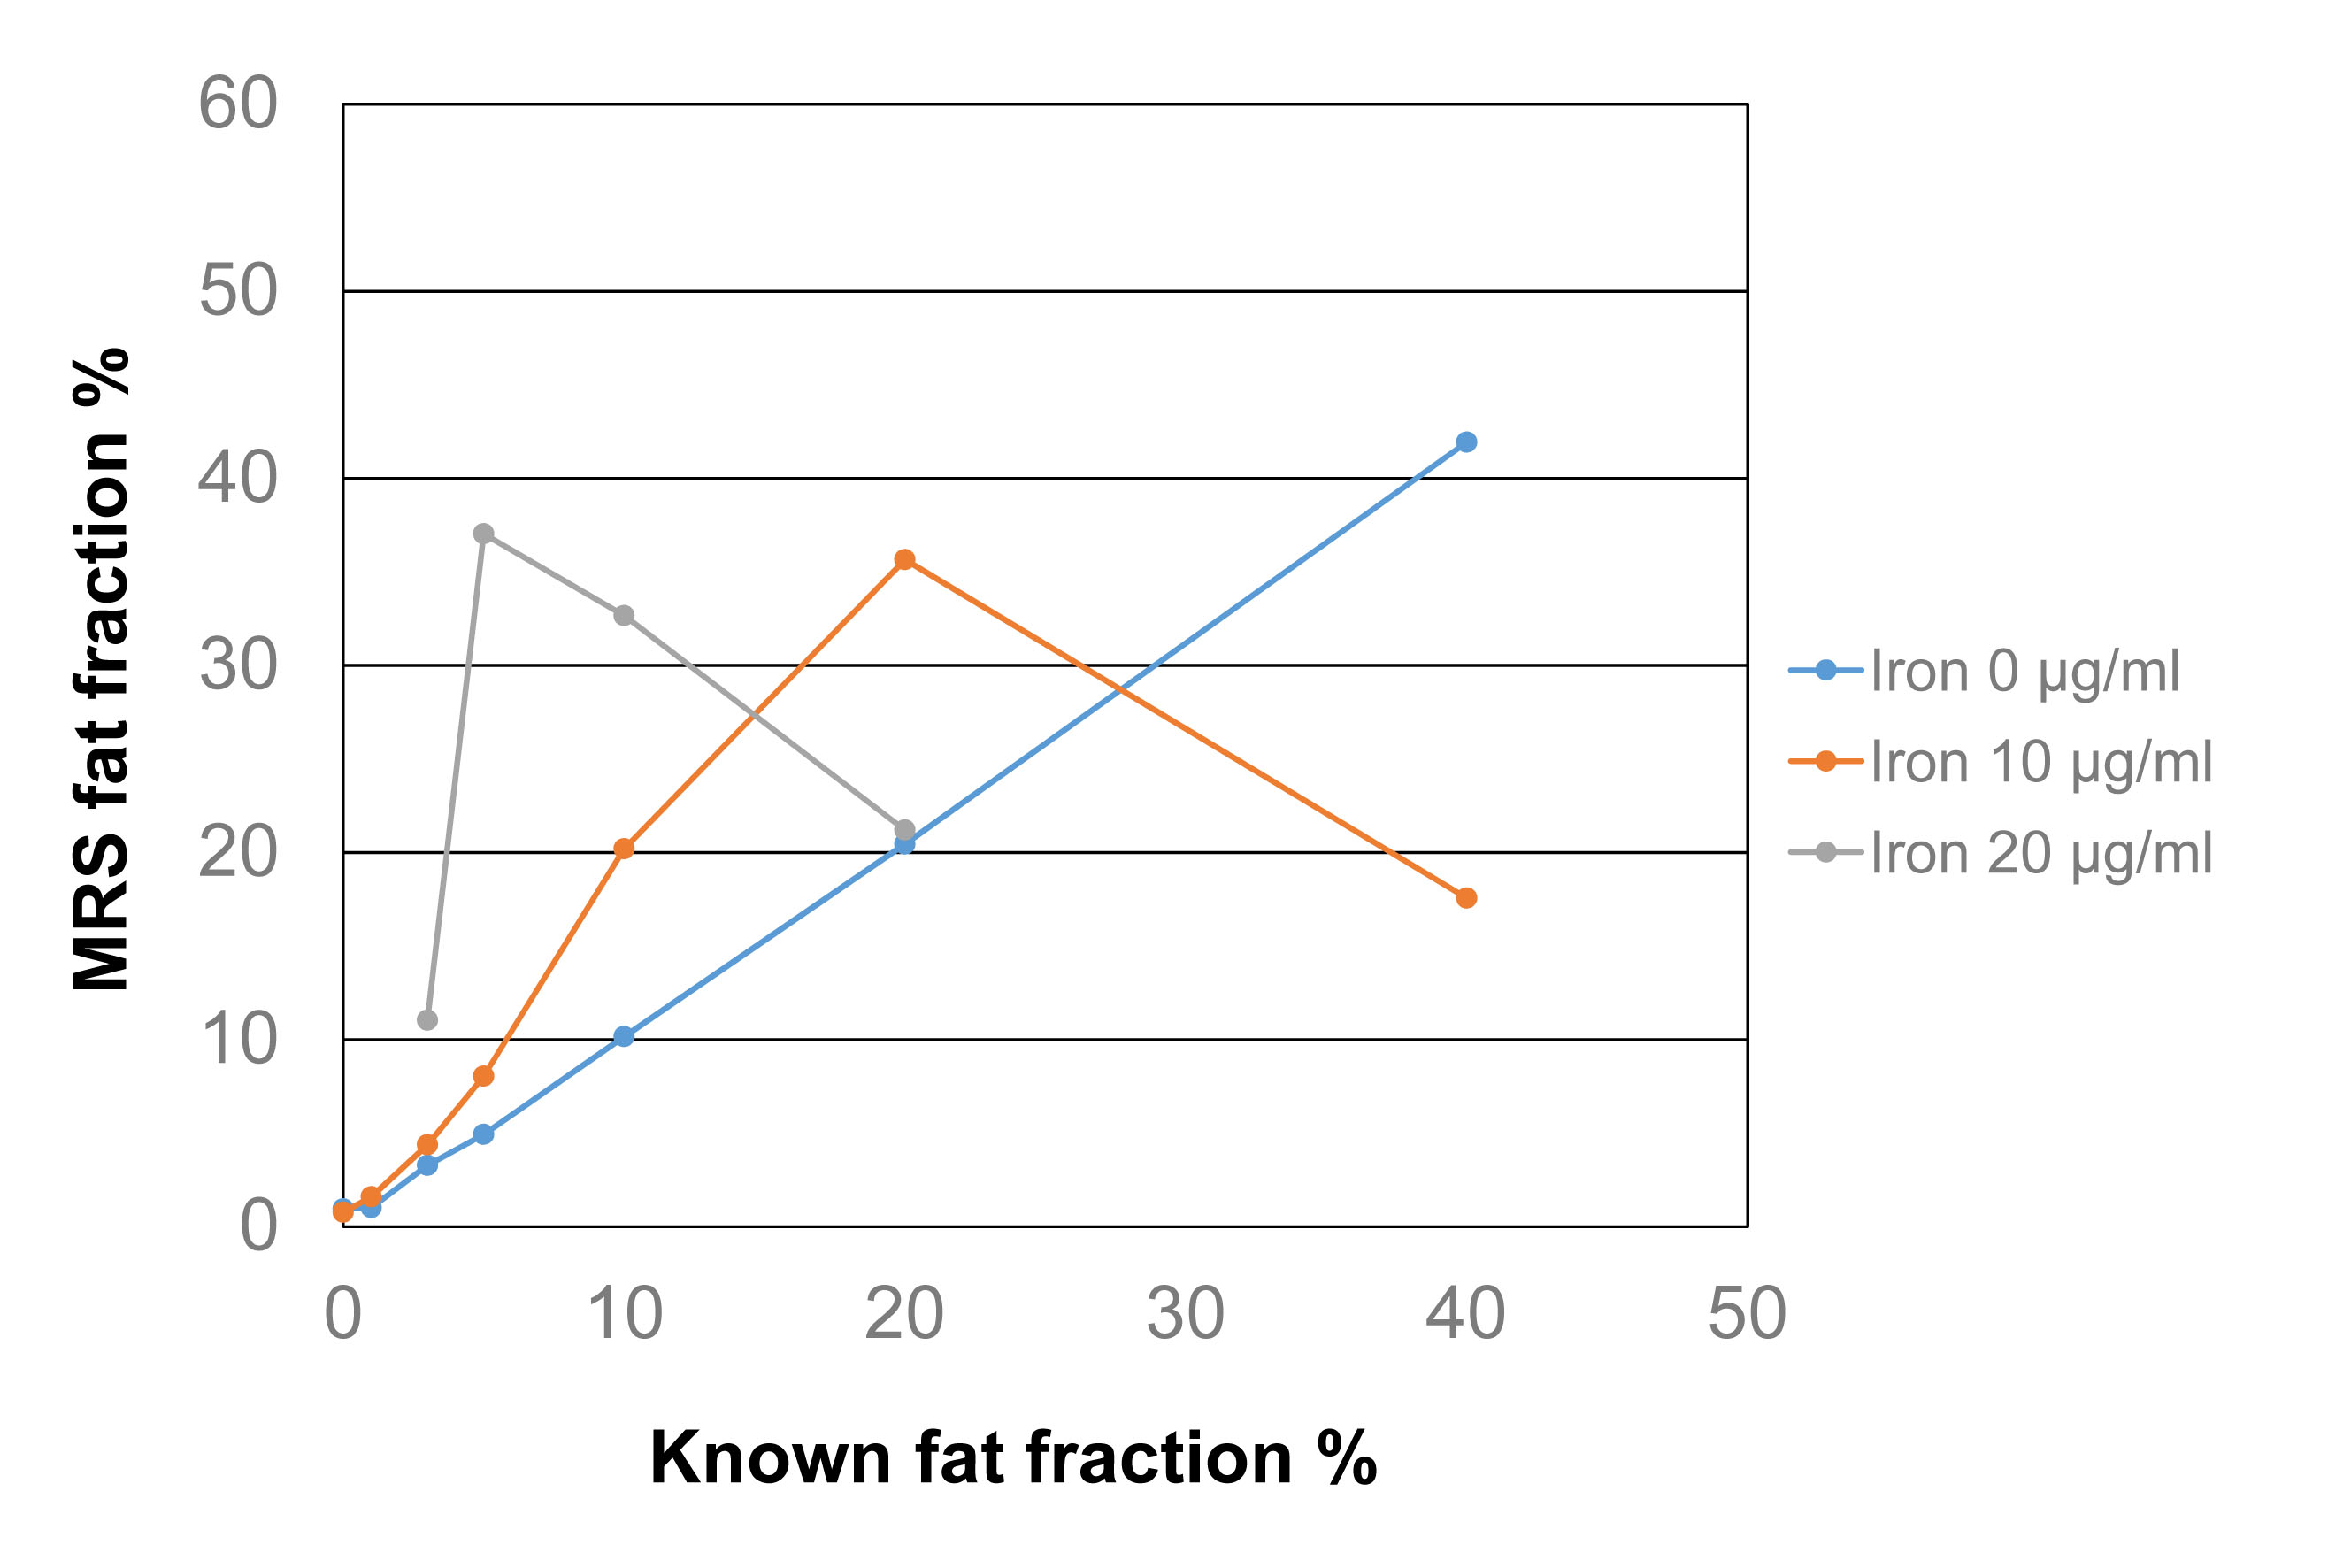
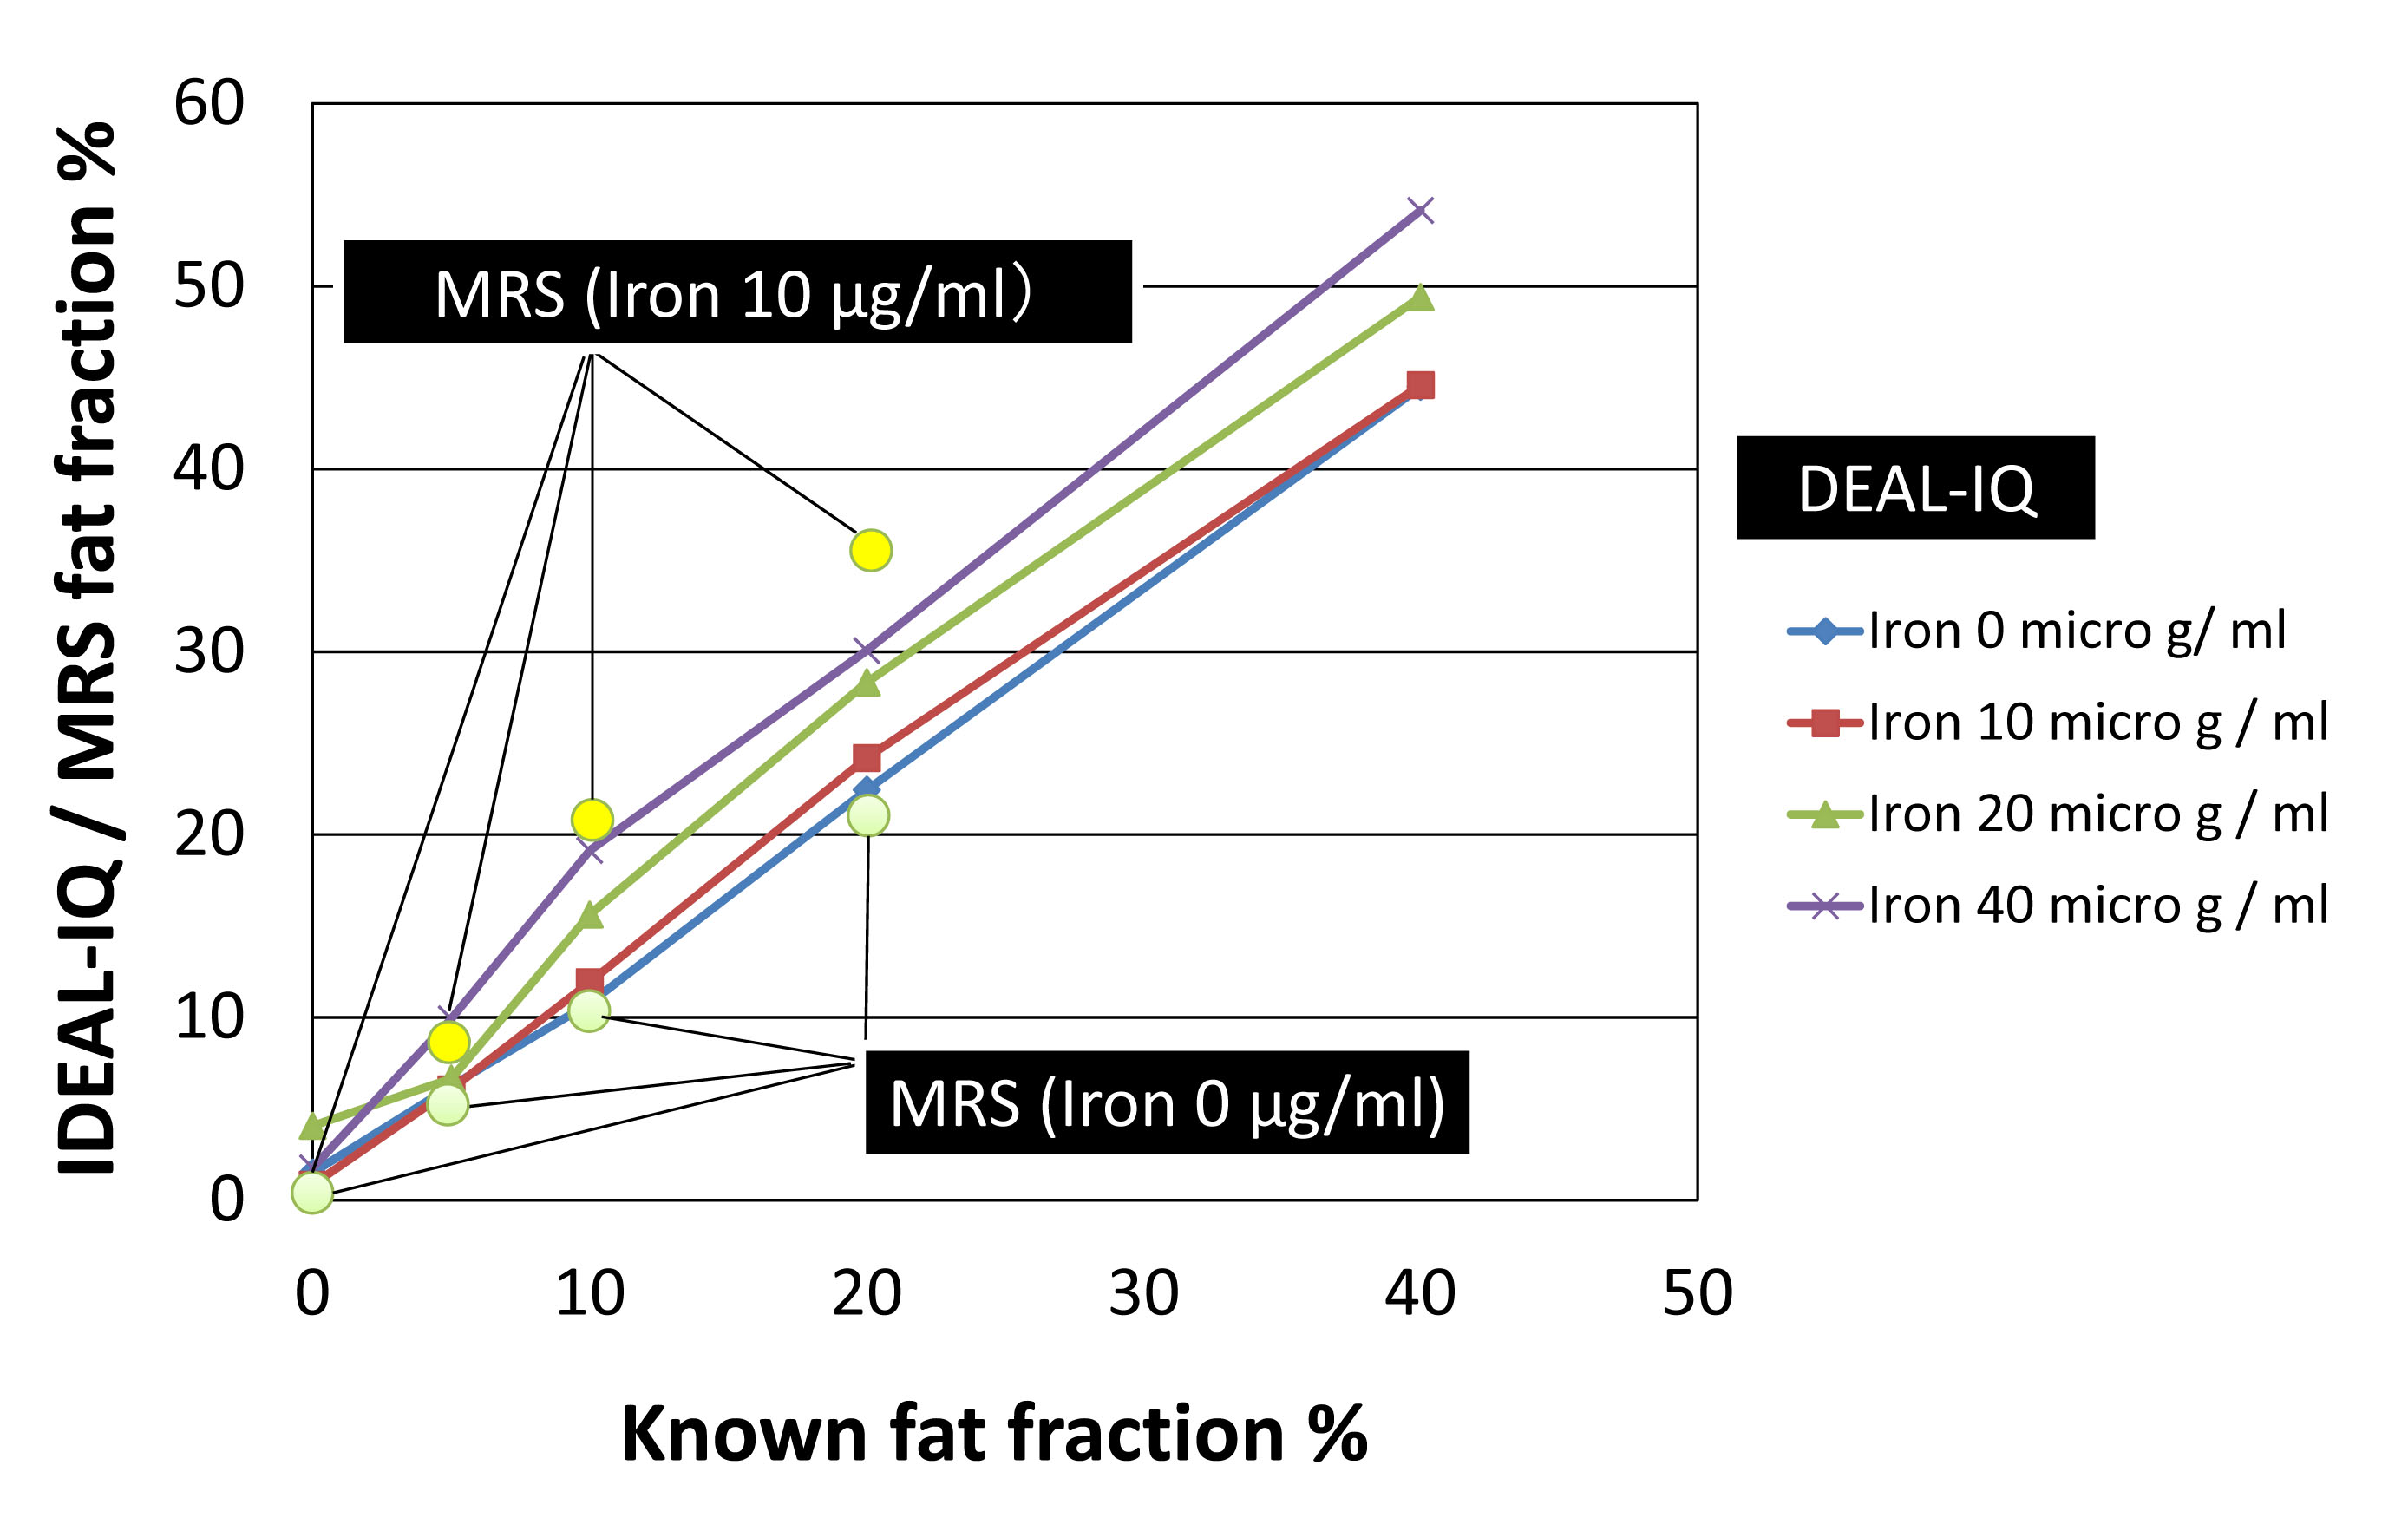
Fat fraction and R2* values were successfully measured by IDEAL-IQ for all phantoms, whereas those values could not be measured for eight phantoms which contained more than 20 µg/mL of iron by MRS probably because of high degree of susceptibility effect. Figures 2 and 3 show scatterplots of known fat fraction (reference standard) versus IDEAL-IQ-measured fat fraction and between known fat fraction versus MRS-measured fat fraction, respectively. Figure 4 shows some MRS data superimposed on scatterplots of known fat fraction versus IDEAL-IQ-measured fat fraction. Fat fraction was accurately measured by both IDEAL-IQ and MRS for phantoms without iron. However, measured fat fraction changed with the presence of iron for both IDEAL-IQ and MRS, with a smaller effect for IDEAL-IQ than for MRS. Figure 5 shows scatterplots of IDEAL-IQ-measured R2* values versus MRS-measured R2* values for successfully measured 20 phantoms. Multiple regression analysis showed that both known fat fraction (P<0.001) and known iron concentration (P<0.001) were significant predictors of IDEAL-IQ-measured fat fraction (R2=0.97), and that only known iron concentration (P<0.001) was the significant predictor of IDEAL-IQ-measured R2* value (R2=0.90). In terms of MRS, both known fat fraction (P=0.002) and known iron concentration (P=0.042) were significant predictors of measured fat fraction (R2=0.50), and only known iron concentration (P=0.002) was the significant predictor of measured R2* value (R2=0.45).DISCUSSION
Liver fat quantification is becoming increasingly important for the management of patients with hepatic steatosis. To evaluate the degree of fat deposition in the liver, MR imaging has been thought as a promising tool. However, iron deposition in the liver is common in chronic liver disease and it can reduce the accuracy of the technique because of its strong susceptibility effects.3 In this study, the presence of iron influenced measured fat fraction for both IDEAL-IQ and MRS, with a smaller effect for IDEAL-IQ than for MRS. In addition, IDEAL-IQ could successfully analyze all phantoms, although MRS failed to analyze some phantoms which contained high amount of iron. Shorter imaging time was also an advantage of IDEAL-IQ over MRS. This study showed potential clinical utility of IDEAL-IQ for noninvasive diagnosis, monitoring, and treatment of patients with fatty liver diseases.CONCLUSION
DEAL-IQ MR imaging yielded an accurate quantification of fat content with a smaller degree of error due to susceptibility effects of iron compared to MRS at 3 Tesla.Acknowledgements
No acknowledgement found.References
1. Reeder SB, Cruite I, Hamilton G, Sirlin CB. Quantitative assessment of liver fat with magnetic resonance imaging and spectroscopy. J Magn Reson Imaging. 2011;34(4):729-749.
2. Hines CD, Yu H, Shimakawa A, et al. T1 independent, T2* corrected MRI with accurate spectral modeling for quantification of fat: validation in a fat-water-SPIO phantom. J Magn Reson Imaging. 2009;30(5):1215-1222.
3. Lee SS, Lee Y, Kim N, et al. Hepatic fat quantification using chemical shift MR imaging and MR spectroscopy in the presence of hepatic iron deposition: validation in phantoms and in patients with chronic liver disease. J Magn Reson Imaging. 2011;33(6):1390-1398.
Figures