3193
T2* measurements in liver at 1.5, 3 and 7T1Sir Peter Mansfield Imaging Centre, School of Physics and Astronomy, University of Nottingham, Nottingham, United Kingdom
Synopsis
Whole body 7T MRI has the potential to improve monitoring of chronic liver disease by building on advances made in parallel transmit technology. This abstract outlays the measurement of T2* in the liver at 7T and compares with measurements on the same subjects at 3 and 1.5T. Acceptable values were obtained across all field strengths and T2* maps of the liver were obtained from analysis of multi-gradient echo imaging sequences. This work forms the start of a normative 7T data set that will provide vital information for developing other 7T MR liver sequences.
Purpose
Chronic liver disease is a growing problem worldwide creating a pressing need to be able to monitor liver inflammation, fibrosis and fat content non-invasively [1]. MRI can provide contrast based on these changes but specificity and sensitivity remain challenges which whole body 7T MRI has the potential to overcome, though much work remains to be done. Building on recent advances in parallel transmit (PTx) technology [2] and 7T liver imaging [3], here we aim to measure the T2* transverse relaxation time in the liver at 7T and to compare with measurements on the same subjects at 3 and 1.5T. T2* is sensitive to iron deposition in the liver, so this will form the start of a normative 7T data set and will provide vital information for developing other 7T MR liver sequences.Methods
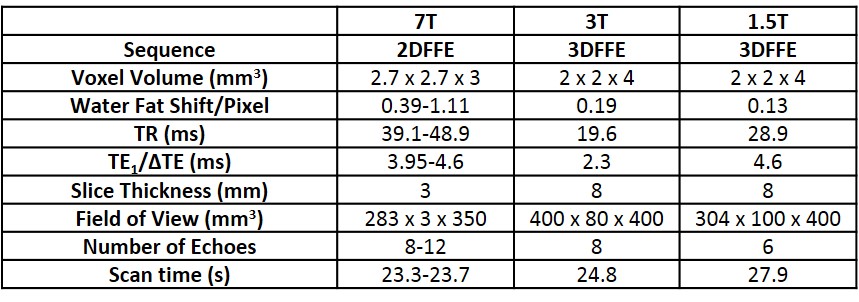
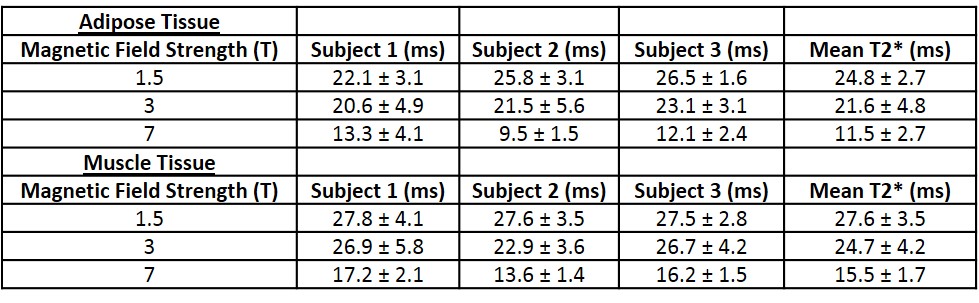
Scanning was carried out on 7, 3 and 1.5T Philips Achieva systems. At 7T an 8-channel transmit, 32-channel receive RF coil (MRcoils, Zaltbommel, Netherlands) was used. Standard Philips body array coils were used at lower fields. T2* values were measured using a multi-gradient echo imaging sequence. Fat-water in-phase echo times were used to yield T2* values from the full tissue including fat and water. TE values and other scan parameters are listed in Table 1. Image based B0-shimming was implemented at all field strengths in rectangular regions encompassing the liver. Three healthy volunteers were scanned using the same protocol at each field strength to obtain transverse slices of the abdomen during a single breathhold. A weighted log-linear least squares regression was used to fit for T2*. A mono-exponential model was chosen as it was assumed that the fat fraction within the liver of the healthy subjects would be low. A correction for through-slice dephasing [4] was found not to be required. To avoid noise bias, a threshold was applied to eliminate later echoes that were dominated by noise. A map was made and the fit for T2* was repeated in three regions of interest (ROI) within high signal areas of the liver for each subject. Fits for adipose tissue and muscle were also made to allow comparison between tissue types. Care was taken to maintain ROI’s of similar location and size whilst avoiding regions near veins or signal drop out at 7T.Results
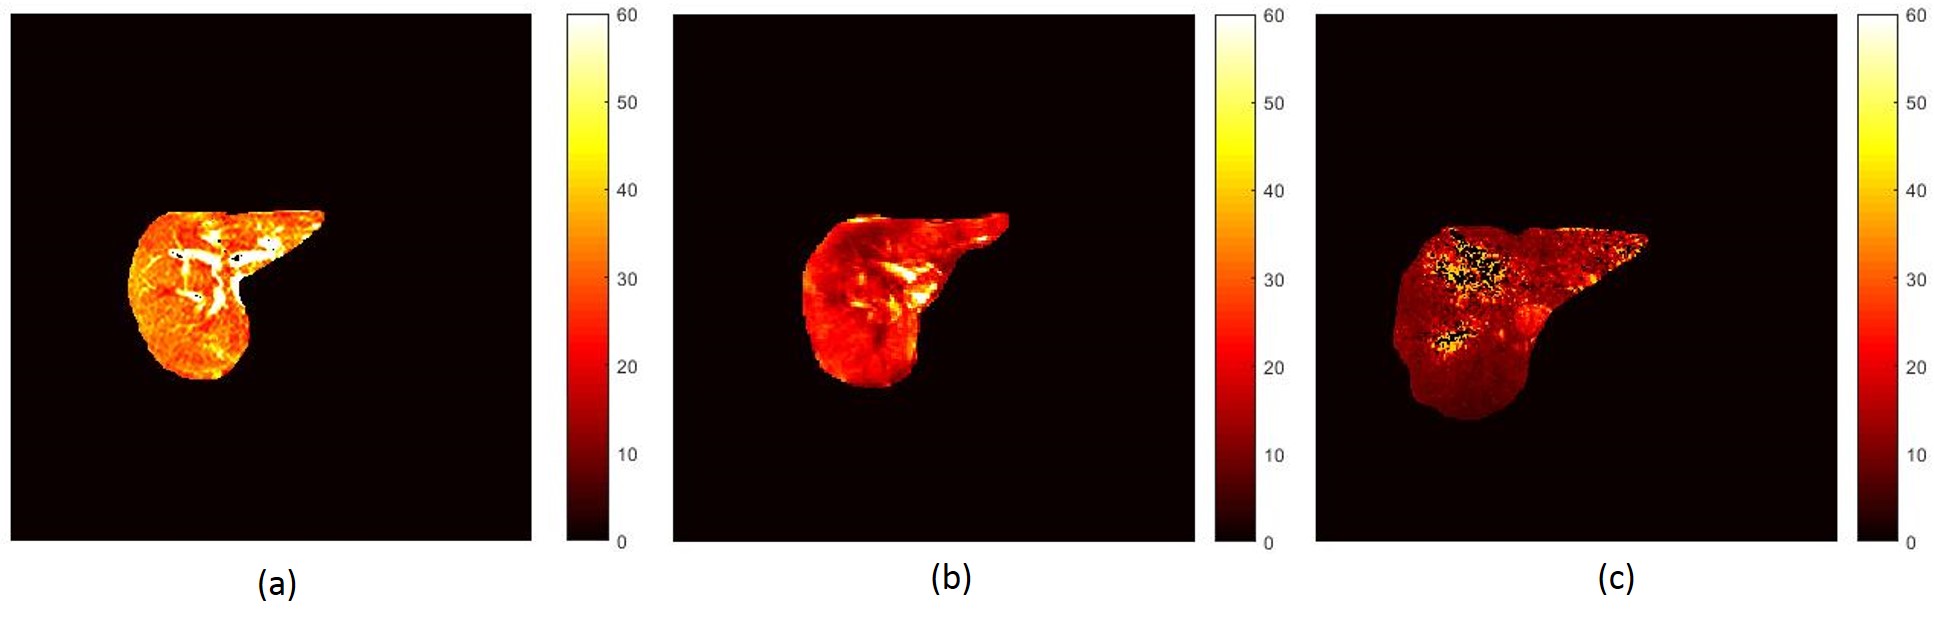
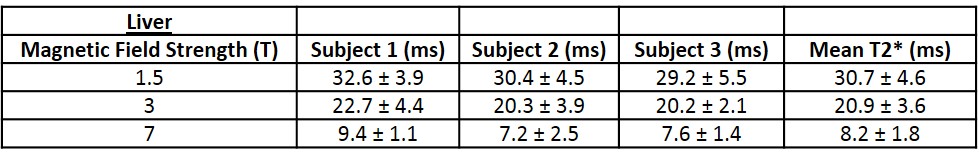
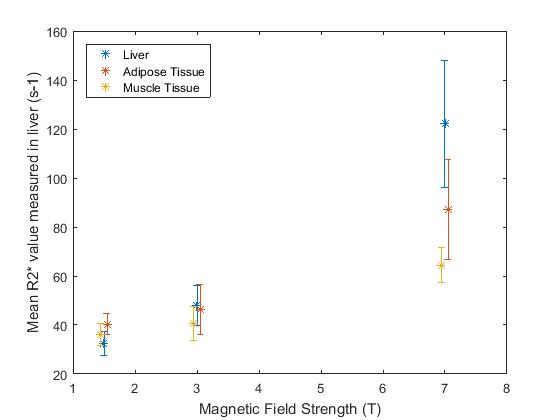
T2* maps of the liver obtained from transverse slices of the abdomen in one subject at 1.5, 3 and 7T are displayed in Figures 1(a), 1(b) and 1(c). The T2* values measured at each field strength are shown in Tables 2 and 3 for the liver and adipose and muscle tissues respectively. The differences in the mean T2* values in the liver at each field strength were statistically significant (p < 0.05) and the inter-subject coefficient of variation (COV) was 10.6 %, 5.8 % and 5.7 % at 7, 3 and 1.5T respectively. The relationship between R2* values and magnetic field strength are shown in Figure 2. Applying a linear regression to the data shown in Figure 2 yielded values of gradient and intercept: 17.3 s-1T-1 and 1.5 s-1 for liver, 8.7 s-1T-1 and 24.2 s-1 for adipose tissue and 5.3 s-1T-1 and 26.3 s-1 for muscle tissue. The R2* values had Pearson correlation coefficients of R = 0.99, 0.98 and 0.97 for liver, adipose and muscle tissues respectively.Discussion
As expected, the average T2* value of 8.2 ms measured in the liver at 7T is significantly lower than the values at 3 and 1.5T. The T2* values measured in the liver at 1.5 and 3T agree with values previously reported in the literature [5]. Figure 1 shows that the T2* distribution is fairly uniform across the liver and decreases as the magnetic field strength is increased. Some areas in the 7T map were excluded from the fit due to low correlation between signal values over all echoes. This indicates that shorter echo times may be required in future rather than restricting the echo times to produce in-phase fat and water signals. In the case of patients with high fat fractions a full fat-water signal model would be required for more accurate signal decay rates.Conclusion
In vivo measurements of T2* in the liver were made at 1.5, 3 and 7T. The results show the expected decrease of T2* at 7T and are in agreement with values previously reported in the literature for 1.5 and 3T. Knowledge of T2* at 7T will advance the development of pulse and sequence design for abdominal imaging at higher field strengths and for investigating other MR measureable parameters within the liver.Acknowledgements
This work was supported by funding from the Engineering and Physical Sciences Research Council (EPSRC) and Medical Research Council (MRC) [grant number EP/L016052/1].References
1. Hoad C.L et al, A study of T1 relaxation time as a measure of liver fibrosis and the influence of confounding histological factors, NMR in Biomedicine, 2015, 28, 706-714
2. Padormo F. et al, Parallel transmission for ultrahigh-field imaging, NMR in Biomedicine, 2015
3. Fischer A. et al, Non-Enhanced T1-Weighted Liver Vessel Imaging at 7 Tesla, PLOS ONE, 2014, 9 (6), 1-9
4. Peters A. M. et al, T2* measurements in human brain at 1.5, 3 and 7 T, Magnetic Resonance Imaging, 2007, 25, 748-753
5. Mohammed H. A et al, Comparison of 3 T and 1.5 T for T2* magnetic resonance of tissue iron, Journal of Cardiovascular Magnetic, 2016, 18(40), 1-9
Figures