3191
Feasibility of measuring the T1 relaxation times before and after Gd-EOB-DTPA administration for characterization of liver tumors1Radiology, Kagoshima University Graduate School of Medical and Dental Sciences, Kagoshima, Japan, 2Radiological Technology, Kagoshima University Hospital, Kagoshima, Japan, 3Siemens Healthcare K.K., Tokyo, Japan
Synopsis
This study focused on the potential of T1 relaxation times measurement before and 20 min after Gd-EOB-DTPA administration to characterize liver tumors. T1 relaxation before Gd-EOB-DTPA administration showed the highest area under the receiver operating characteristic (ROC) curve for distinguishing hemangiomas and HCCs. T1 relaxation times 20 min after Gd-EOB-DTPA administration showed the highest the area under the ROC curve for differentiating HCCs from metastases. ΔR1 was considered to be useful for differentiation between hemangiomas and metastases because of the highest the area under the ROC curve.
Purpose
Diagnosing liver tumors including hemangiomas, hepatocellular carcinomas (HCCs), and metastasesMethods
This study population comprised 68 patients (37 men and 31 women; mean age, 66.0 years; age range, 18–85 years) with 14 hemangiomas (mean size, 38.9 mm; range, 10–129 mm), 35 HCCs (mean size, 34.1 mm; range, 11–90 mm), and 22 metastases (mean size, 22.5 mm; range, 10–70 mm), who underwent 3D T1-weighted volumetric interpolated breath-hold examination at two different flip angles (3° and 17°) for T1 maps with B1 correction before and 20 min after Gd-EOB-DTPA administration. The T1 map of the liver was automatically obtained by using the MapIT processing tool. The processing tool is based on the driven equilibrium single pulse observation of T1 (3). We compared the T1 relaxation times before (T1pre), 20 min after Gd-EOB-DTPA injection (T120min), and ΔR1 within hemangiomas, HCCs, and metastases using Kruskal-Wallis test, followed by the Mann-Whitney U test. Receiver operating characteristic (ROC) analysis was also carried out to assess for differentiation between hemangimas, HCCs and metastases.Results
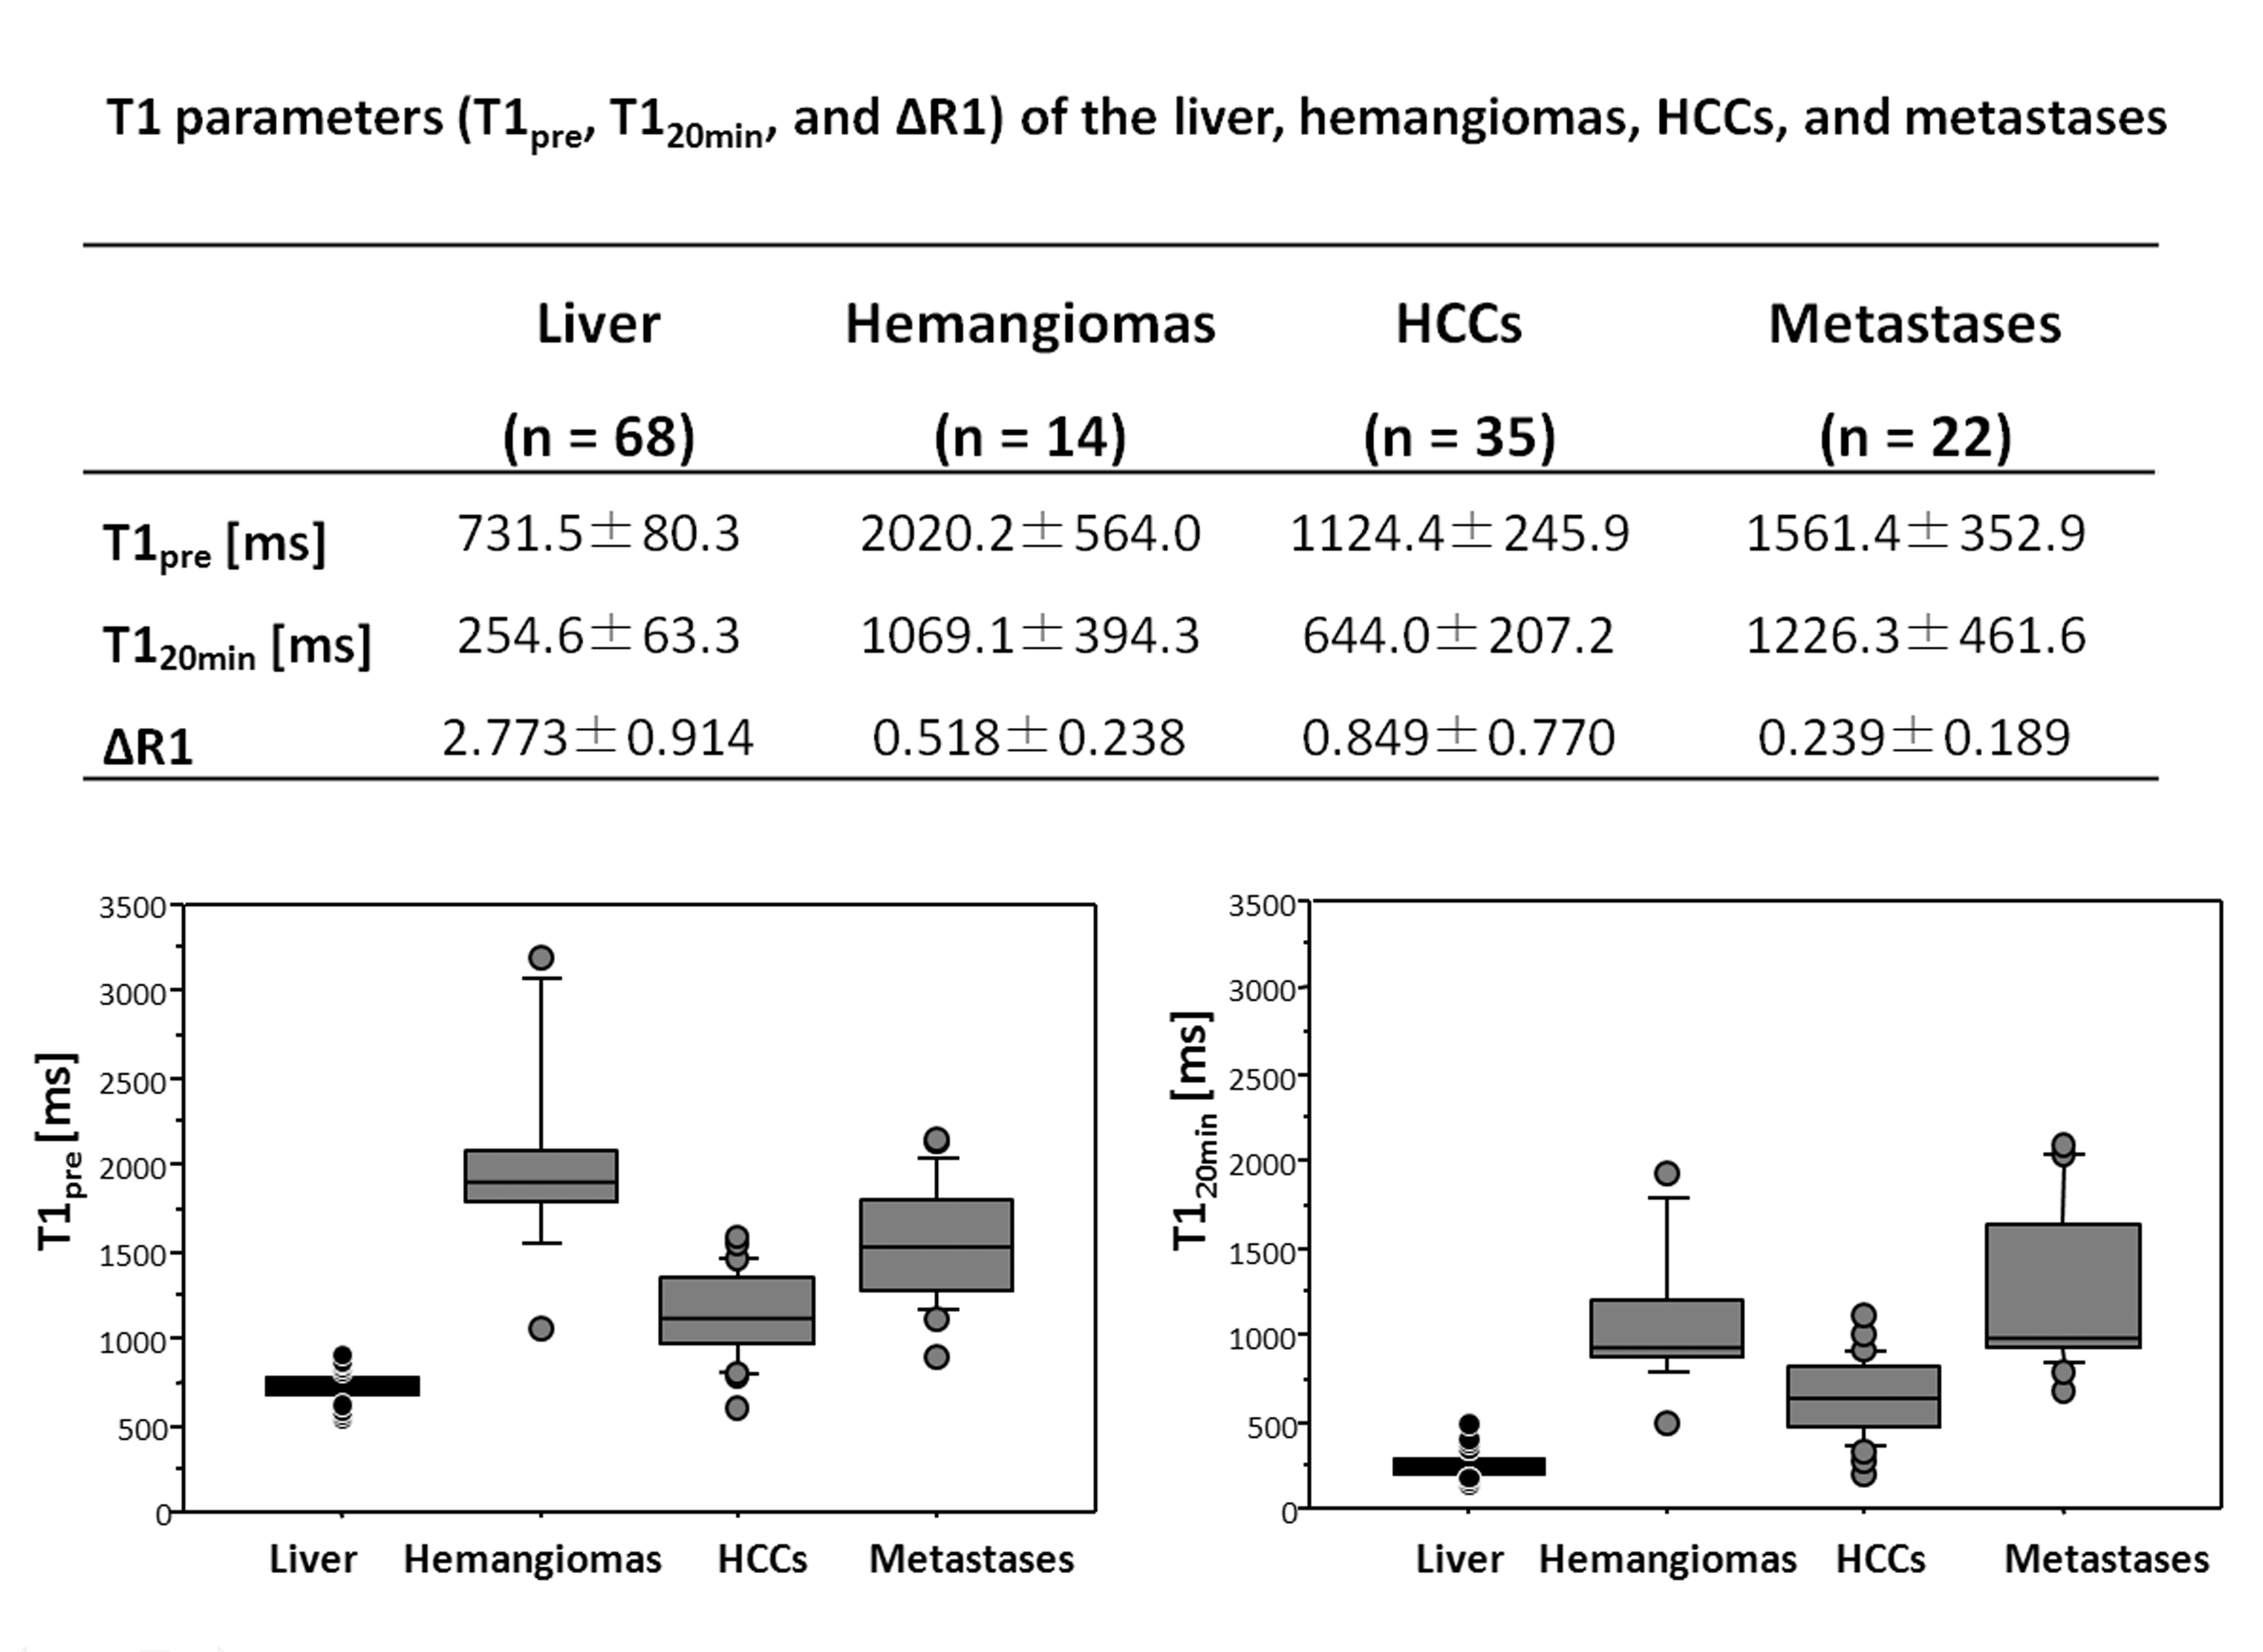
Table 1 shows T1pre, T120min, and ΔR1 of the liver, hemangiomas, HCCs, and metastases. T1pre values of HCCs were significantly lower than those of hemangiomas (P < 0.001) and metastases (P < 0.001). Hemangiomas showed significantly higher T1pre values than metastases (P = 0.013). HCCs showed significantly lower T120min than hemangiomas (P < 0.001) and metastases (P<0.001), but no significant difference was obtained between hemangiomas and metastases (P = 0.270). ΔR1 of metastases was significantly lower than those of hemangiomas (P = 0.001) and HCCs (P < 0.001), but no significant difference was observed between hemangiomas and HCCs (P = 0.199). For differentiating hemangiomas and HCCs, T1pre showed the highest area under the ROC curve (0.957; 95% CI: 0.857, 0.994). T120min showed the highest area under the ROC curve for differentiating HCCs and metastases (0.930; 95% CI: 0.830, 0.981). ΔR1 showed the highest area under the ROC curve for differentiating hemangiomas and metastases (0.821; 95% CI: 0.658, 0.929).Discussion
T1pre and T120min values of HCCs were significantly lower than those of metastases andConclusion
T1 relaxation times before and 20 min after Gd-EOB-DTPA administration could help characterize liver tumors.Acknowledgements
No acknowledgement found.References
1. Kitao A, Matsui O, Yoneda N, et al. The uptake transporter OATP8 expression decreases during multistep hepatocarcinogenesis: correlation with gadoxetic acid enhanced MR imaging. Eur Radiol 2011; 21:2056-66.
2. Peng Z, Jiang M, Cai H et al. Gd-EOB-DTPA-enhanced magnetic resonance imaging combined with T1 mapping predicts the degree of differentiation in hepatocellular carcinoma. BMC cancer 2016; 164:e625.
3. Kang Y, Choi SH, Kim YJ, et al. Gliomas: histogram analysis of apparent diffusion coefficient maps with
Figures