3187
Diffusion and perfusion parameters extracted by bi-exponential model are markers of healthy human placenta development.Michele Guerreri1,2, Silvia Capuani2, Amanda Antonelli3, and Lucia Manganaro3
1SAIMLAL Dept., Morphogenesis & Tissue Engineering, Sapienza University of Rome, Rome, Italy, 2Physics Dept., CNR ISC UOS Roma Sapienza, Rome, Italy, 3Radiology Dept., Department of Radiology, Sapienza University of Rome, Rome, Italy
Synopsis
The purpose was to investigate the potential of bi-exponential model of diffusion-weighted (DW) signal decay to quantify diffusion and perfusion in healthy human placentas. The relation between diffusion and perfusion parameters with microstructural changes occurring during placenta development was also investigated. 26 pregnant women underwent DW examination. Apparent diffusion coefficient D, pseudo-perfusion fraction f and pseudo-diffusion coefficient D* were obtained in specific placental regions. The Pearson correlations between D, D*,f and clinical data (Gestational Age, Body-Mass Index and basal Glycaemia) were evaluated. D and f show to be good indicators of placenta morphological changes due to Gestational Age.
Introduction
Placenta is the organ dedicated to the nutritive and respiratory functions between mother and sun. Moreover, it carries out a fundamental role in the endocrine and immune system regulation of fetus. Abnormalities in placentation are responsible for most failure in pregnancy, such as preeclampsia or late intrauterine death1. Due to the limited ability of ultrasound examinations to provide early placental dysfunction before clinical macroscopic evidences, the search for alternative tools to perform a sensitive and early diagnosis is highly desirable. In this contest, diffusion-weighted imaging is an alternative technique for monitoring microstructural tissue changes in placenta during gestational period. Because the placental tissue is highly vascularized and many diseases are linked to functional properties of the placental vasculature, in this preliminary study, we used a bi-exponential model2 to quantify both water diffusion and blood perfusion in healthy placentas. Toward this goal we examined the placenta of pregnant women at 1.5T, measuring diffusion and perfusion parameters in different placental sites and assessing their associations with subjects’ clinical data such as Gestational Age (GA), Body Mass Index (BMI) and basal Glycaemia (bG).Methodological Details
26 healthy pregnant women (GA range 19-37w), fulfilling the study inclusion criteria, underwent MRI examination at 1.5T (Siemens Avanto, Erlangen, Germany), without mother-foetal sedation. The study was approved by the local Ethics Committee, and written informed consent was obtained from all subjects before entering the study. The MRI protocol included a Diffusion weighted Spin Echo-Echo Planar Imaging with TR/TE=4000ms/79ms; bandwidth=1628Hz/px; matrix size=192x192, number of slices=30. The in-plane resolution was 2.0x2.0mm2, the slice thickness=4mm. The diffusion encoding gradients were applied along 3 no-coplanar directions using six different b-values (50,100,150,400,700,1000 s/mm2), plus the b=0 image. The total acquisition time of DW protocol was 6 minutes. With the help of an expert radiologist three Regions of Interest (ROIs) were identified in each placenta: a Central ROI (C-ROI), a Peripheral ROI (P-ROI) and a Umbilical ROI (U-ROI). Data were spatially smoothed using a Gaussian filter with full-width-half-maximum of 3.2 mm. Signal intensity in each ROI was averaged and then a bi-exponential function: $$$S(b)≈(1-f)e^{-bD}+fe^{-bD^\star}$$$. was used to fit data. D, D* and f are the apparent diffusion coefficient, the pseudo-perfusion coefficient and the pseudo-perfusion fraction, respectively. Pearson test with Bonferroni correction was performed to investigate correlation between D, D* ,f and GA, BMI and bG. Because low Signal to Noise Ratio (SNR) of DWIs and no data at low b-values (i.e. less than 200 s/mm2) are obvious drawbacks to extract reliable D, D* and f parameters, we carefully selected the b-values considering a proper compromise between the number of b values and the duration of the exam. Moreover we evaluated SNR of DWI at each b value.Results
The location of the three different ROIs investigated were displayed in Fig. 1, together with the signal decay and the fitting procedure used to extract D, D* and f in each ROI. D, D* and f mean values were displayed in Fig.2. A positive linear correlation was found between f and GA only in the C-ROI (p<5.5∙10-3). Conversely, no significant correlations were found between D, D*,f and BMI, bG. Importantly, a significant negative correlation, was found between D and GA (p<1.0∙10-4) for GA>30w in P-ROI,. while no-dependence of D on GA was observed in GA range (19-29)w (see Fig. 3) The SNR of DWIs runs from approximately 100 (for the b=0 image) to 25 (for DWI acquired at b=1000s/mm2).Discussion
The SNR was higher than 20, which is a fully acceptable value for considering DW data reliable. The mean D, D* and f values are in agreement with those found in literature 2-4. However, in contrast with previous studies4-7 performed in healthy placenta by using bi-exponential model, we found a positive correlation between f and GA. We obtained a significant progressive increase of f with GA. This behaviour coherently reflects the increase of volume, surface and length of villi with placental volume. On the other hand, the decrease of D occurring from the 30th gestational week, highlights the parenchymal changes characterized by a more fibrotic environment during last gestational weeks.Conclusions
We presented measurements of diffusion and perfusion parameters in placenta of normal pregnancy performed using a bi-exponential model of the DW signal decay and their correlation with clinical data (such as BMI, bG and GA) which change with the placental development. The significant positive correlation found between f and GA and the negative correlation between D and GA in the last week of pregnancy suggest the potential of biexponential model to provide information about placental function and micro-morphology.Acknowledgements
No acknowledgement found.References
1. Siauve N, Chalouhi GE, Deloison B, et al. Functional imaging of the human placenta with magnetic resonance. American journal of obstetrics and gynecology 2015;213:S103-114. 2. Le Bihan D, Breton E, Lallemand D, Aubin M, Vignaud J, Laval-Jeantet M. Separation of diffusion and perfusion in intravoxel incoherent motion MR imaging. Radiology 1988;168:497-505. 3. Moore RJ, Strachan BK, Tyler DJ, et al. In utero perfusing fraction maps in normal and growth restricted pregnancy measured using IVIM echo-planar MRI. Placenta 2000;21:726-732. 4. Moore R, Issa B, Tokarczuk P, et al. In vivo intravoxel incoherent motion measurements in the human placenta using echo-planar imaging at 0.5 T. Magnetic resonance in medicine 2000;43:295-302. 5. Sohlberg S, Mulic-Lutvica A, Lindgren P, Ortiz-Nieto F, Wikstrom AK, Wikstrom J. Placental perfusion in normal pregnancy and early and late preeclampsia: a magnetic resonance imaging study. Placenta 2014;35:202-206. 6. Derwig I, Lythgoe DJ, Barker GJ, et al. Association of placental perfusion, as assessed by magnetic resonance imaging and uterine artery Doppler ultrasound, and its relationship to pregnancy outcome. Placenta 2013;34:885-891. 7. Manganaro L, Fierro F, Tomei A, et al. MRI and DWI: feasibility of DWI and ADC maps in the evaluation of placental changes during gestation. Prenatal diagnosis 2010;30:1178-1184.Figures
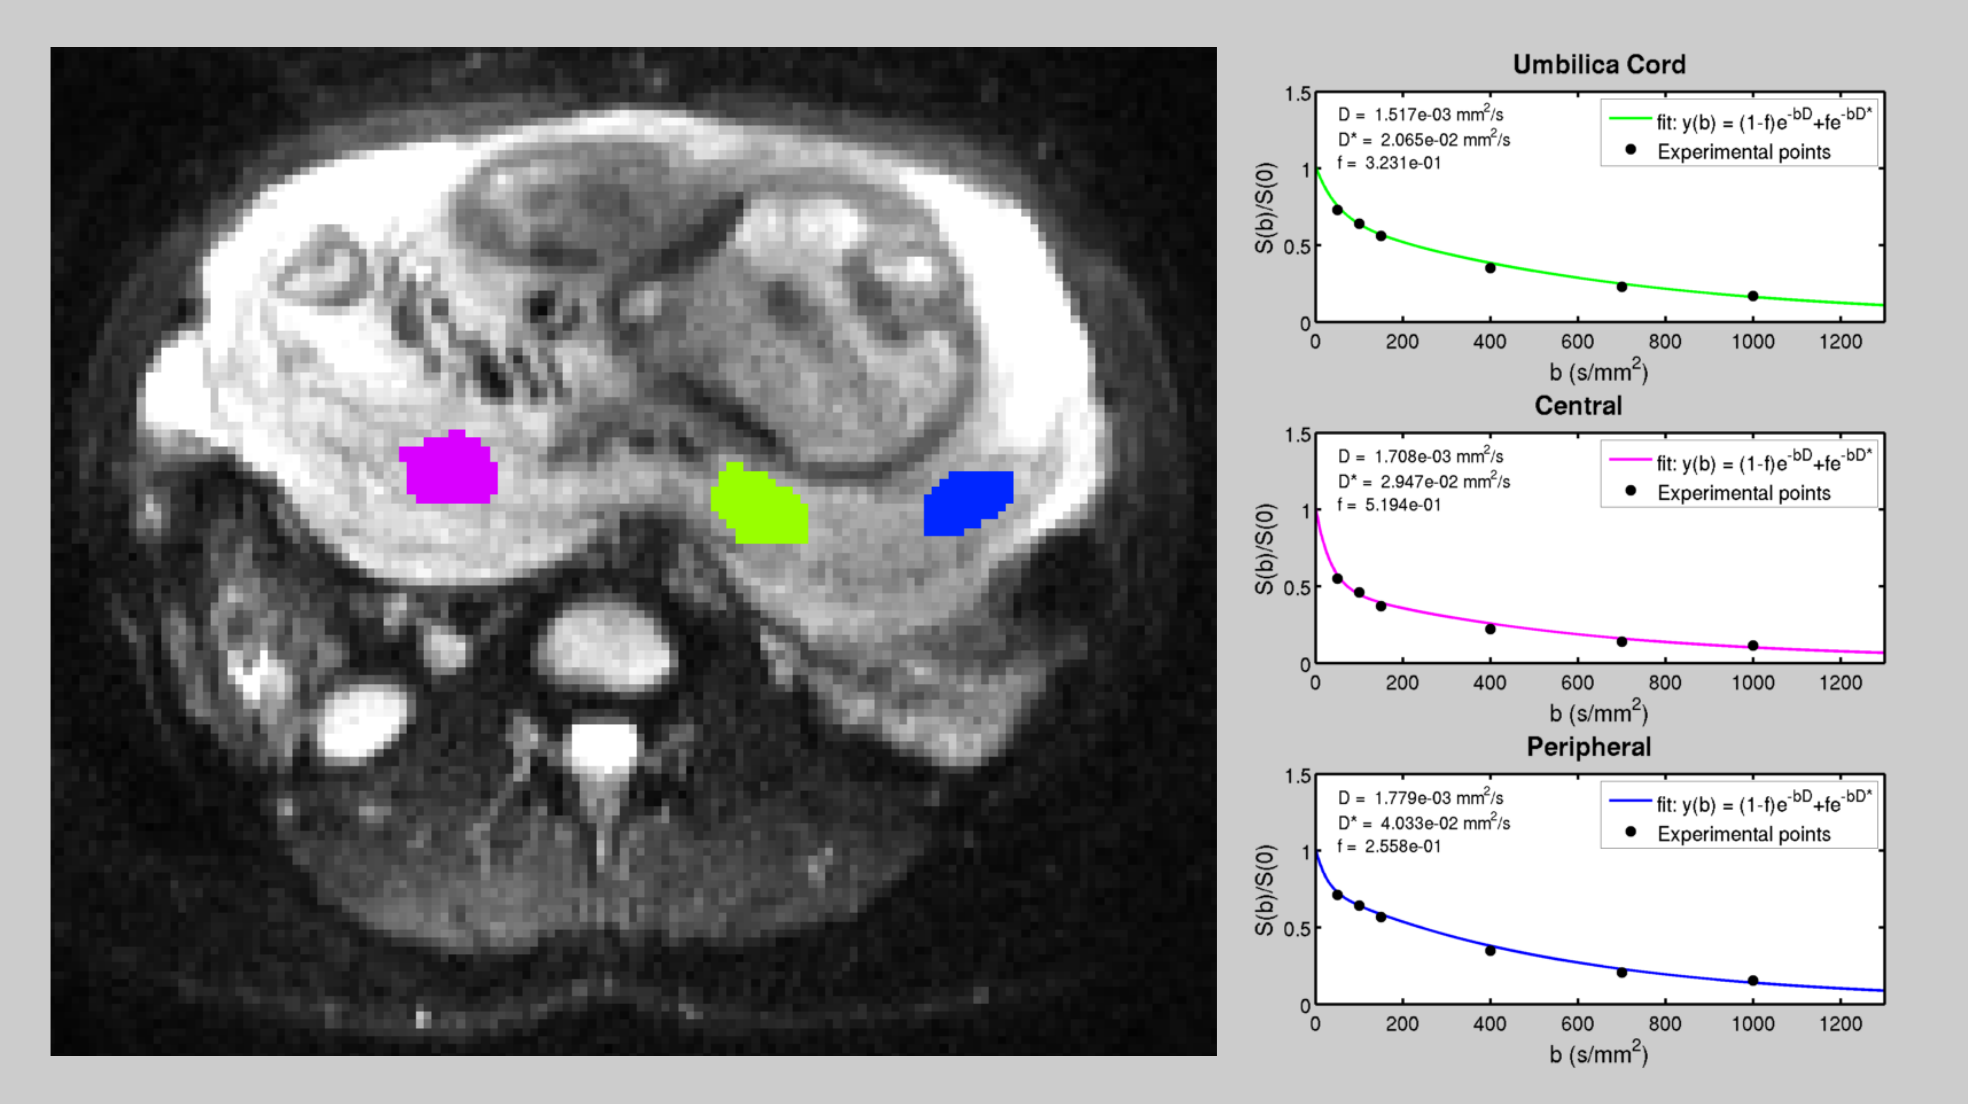
Fig.1. Left:
transverse slice of a subject's placenta. The colored zones indicate the Regions of
Interest (ROIs): magenta for the
Central, blue for the Peripheral and green for the Umbilical ROI. Right: DW experimental data fitted to the bi-exponential function. In the upper-left
corner of each sub-plot the extracted values of D, D* and f.are reported.
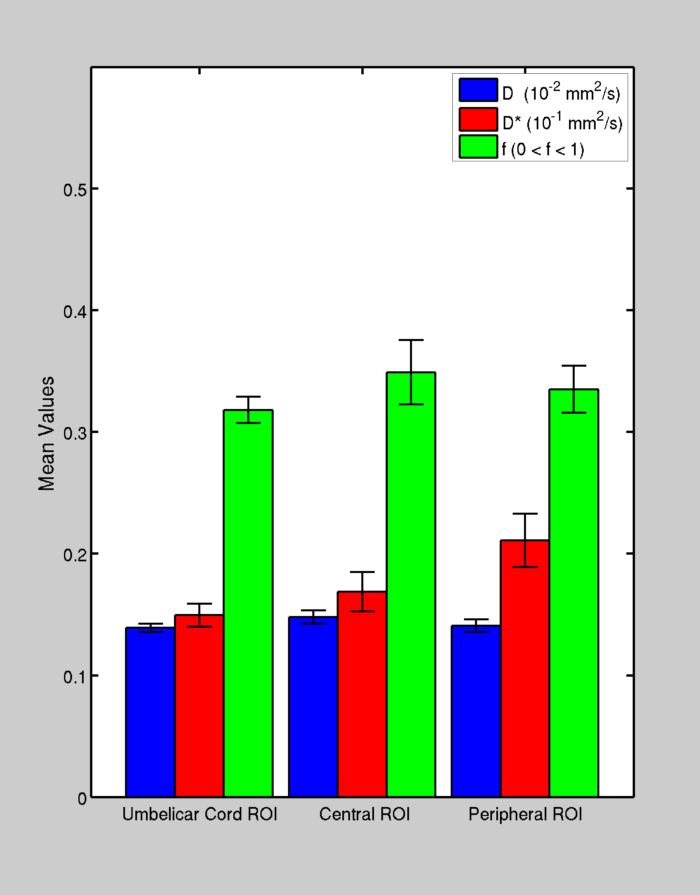
Fig.2. Box plots with error-bars showing the mean values and inter-subjects standard deviation of D, D* and f,
calculated, in each selected ROI.

Fig.3. Scatter-plots of D, D* and f values as a function of the Gestational Age
(GA). The red line indicates the statistically significant linear correlation found between f and GA
(positive, p < 0.005) and between D and GA (negative after the 30th
week, p < 0.0001).