3185
High Resolution Diffusion Weighted Imaging of the Liver using Readout Segmented EPI on 3T1Center for Biomedical Imaging Research, Department of Biomedical Engineering, School of Medicine, Tsinghua University, Beijing, People's Republic of China, 2BIU Clinical Science MR, Philips Korea, Seoul, Korea, Republic of, 3Vascular Imaging Laboratory, Department of Radiology, University of Washington, Seattle, WA, United States
Synopsis
Readout segmented EPI (RS-EPI) can be used for high-resolution diffusion weighted imaging but there are still limited reports on its application to liver DWI. In this study, we reported to use RS-EPI for high resolution DWI of the liver.
Purpose
Single shot EPI has been the primary choice for diffusion weighted imaging of the liver in clinical applications, such as for lesion detection and characterization, assessment of tumor response to treatment, liver fibrosis and cirrhosis and so on(1, 2). Image quality including SNR and spatial resolution have been the limitation for single shot EPI(1). Multi-shot EPI techniques such as readout segmented EPI(3) can be used to solve these problems. Increased spatial resolution can be potential for early detection of small lesions. There are still limited reports on high-resolution liver DWI using RS-EPI(4). In this study, we aim to implement free-breathing high-resolution liver DWI using RS-EPI with respiratory trigger.Methods
Data Acquisition
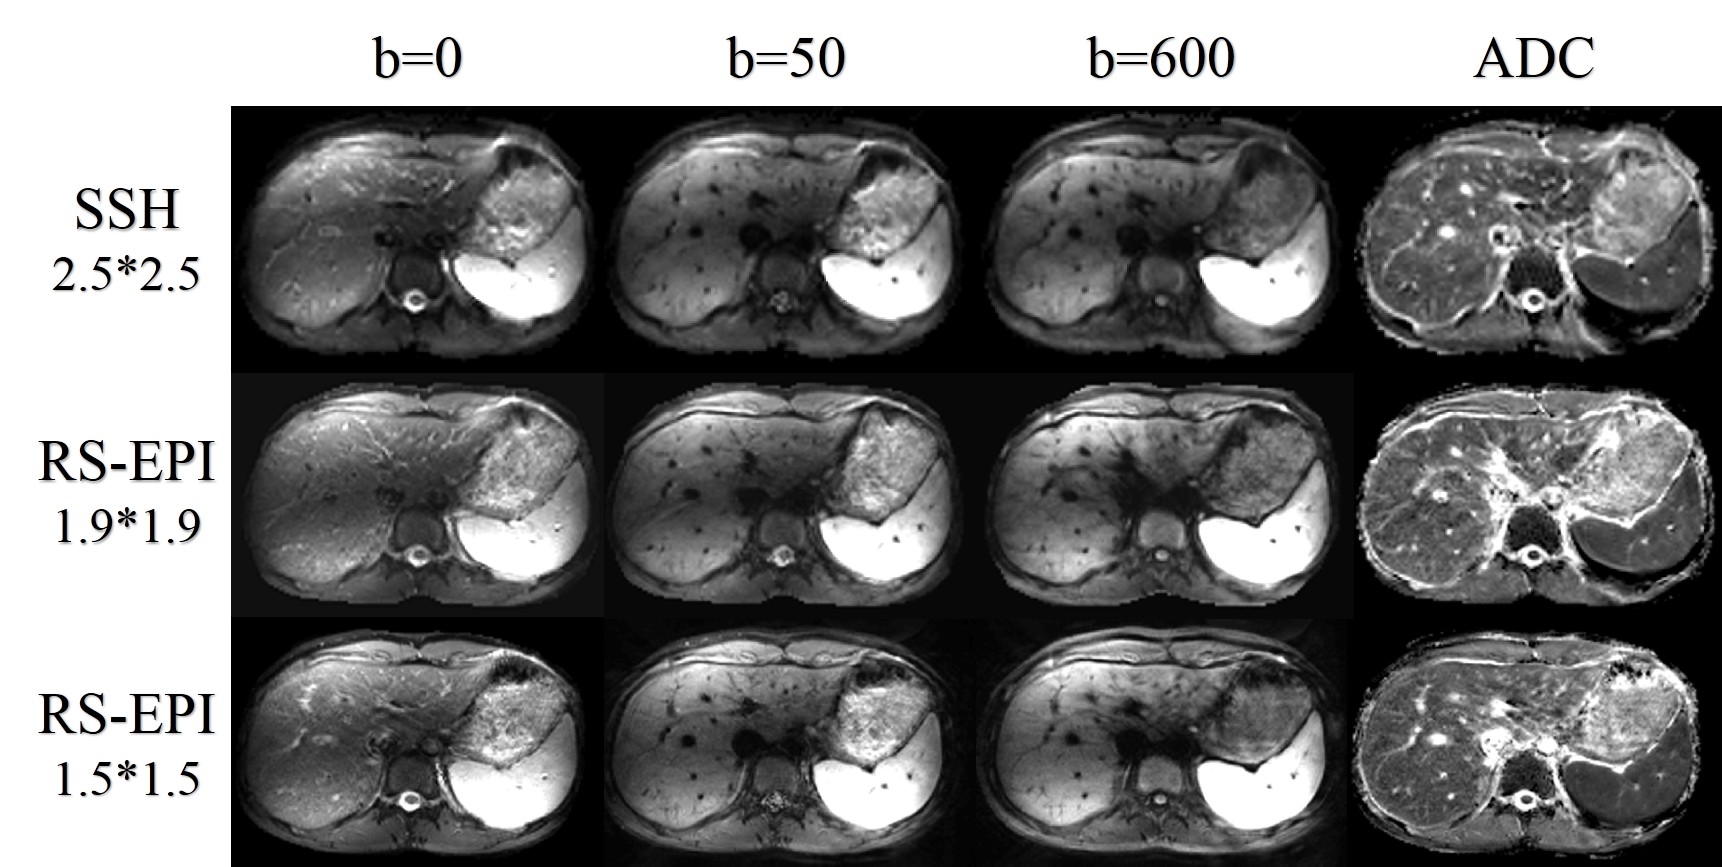
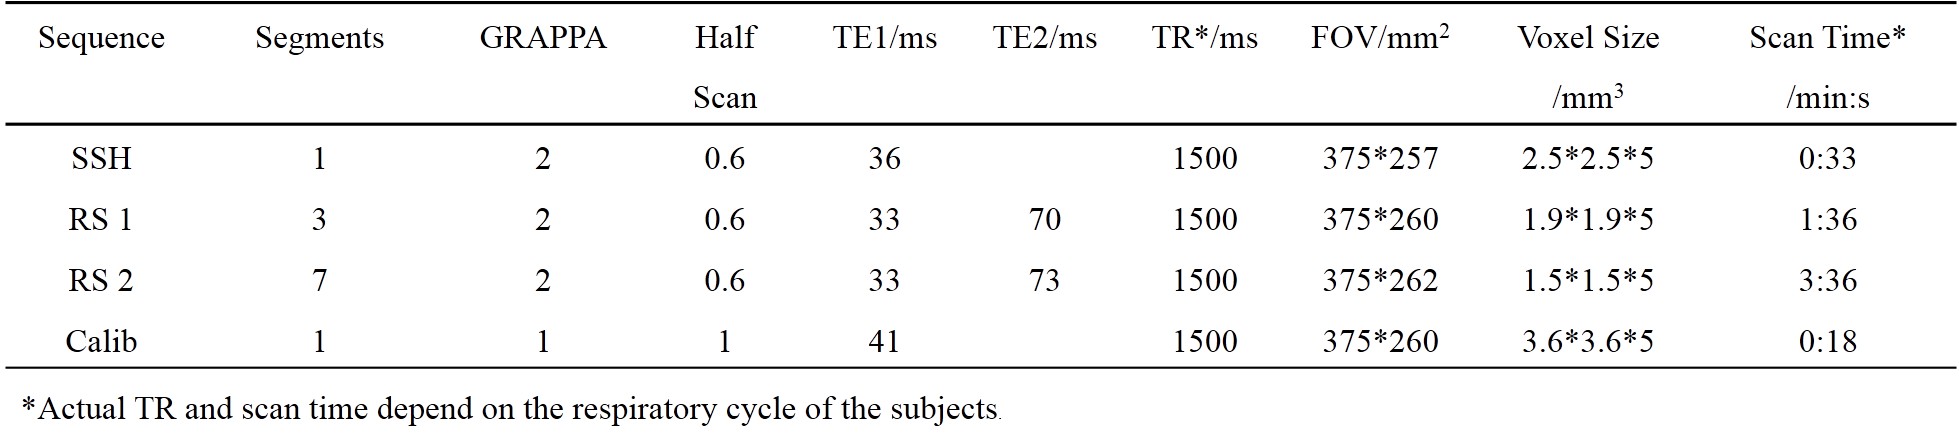
The RS-EPI sequence with a 2D navigator was implemented on a Philips 3T Achieva TX scanner (Philips Healthcare, Best, The Netherlands). In vivo liver diffusion weighted imaging data were acquired using a 32-channel coil. One RS-EPI sequence was scanned with an in-plane resolution of 1.9*1.9 mm2, using 3 segments covering the whole k space. The other was scanned with a resolution of 1.5*1.5 mm2 using 7 segments. The 2nd echo time was 70 ms and 73 ms for the two sequences respectively, to maintain adequate SNR for the 2D navigator, which was critical for the phase correction during reconstruction. A single shot EPI diffusion sequence with a resolution of 2.5*2.5 mm2 was also acquired. Three b values (NSA=2 for b=0 s/mm2 and b=50 s/mm2, NSA=6 for b=600 s/mm2 images) were acquired. A GRAPPA acceleration factor of two and partial Fourier=0.6 was used for all sequences. A low-resolution single shot EPI dataset was acquired for the GRAPPA calibration. Six slices were acquired with a slice thickness of 5mm and slice gap of 4mm. All sequences were acquired under free-breathing using respiratory trigger with a 200ms delay. Detailed scan parameters were shown in Table 1.
Reconstruction
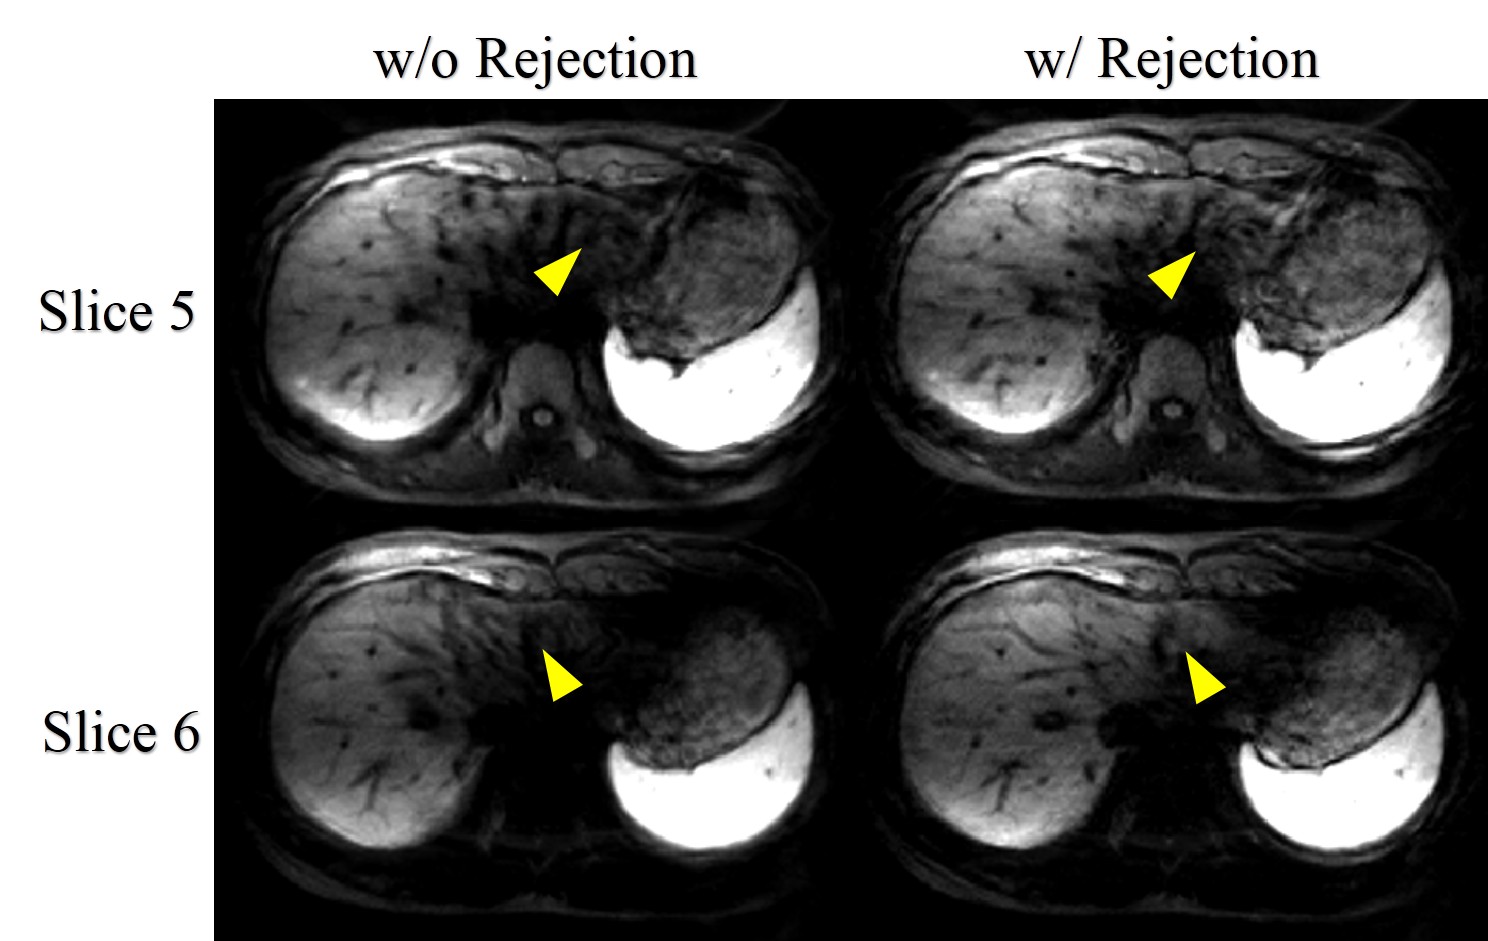
RS-EPI images were reconstructed using the algorithms described in (3). During reconstruction, motion corrupted data which manifested severe signal voids in the liver parenchyma were rejected by manual inspection of the low resolution navigator images, and the remaining data were averaged segment-wise and then combined to form the full k-space. ADC maps were estimated from the images of three b values using linear least-squares fitting. All procedures were implemented using Matlab (Mathworks Inc., Natick, MA).
Results
The diffusion weighted images and ADC maps were shown in Figure 1. As can be seen, RS-EPI can achieve higher resolution than single shot EPI sequence. A sharper edge of the liver and more details were revealed by the RS-EPI images. The necessity of data rejection can be seen in Figure 2.Discussion
Due to the short T2 of the liver parenchyma (5), the echo time of both the image echo and navigator echo must be short. A few strategies were used to achieve this goal in this work, i.e. using GRAPPA acceleration and partial Fourier in the phase encoding direction, increasing the number of segments, utilizing three directions of the gradient system simultaneously to compress the duration of the diffusion gradients. Respiratory triggering is an effective method for motion control, but there are still data corruption due to the cardiac pulsatile motion and irregular respiratory cycle. In this work, we used manual inspection of the navigator data for corrupted data rejection. Calculating the k-space signal distribution and entropy may provide automatic way for the data rejection strategy(3, 6). For now we use retrospective data rejection during the reconstruction, but an online reacquisition implementation should be a better choice(3).Conclusion
Readout segmented EPI can be used for high-resolution diffusion weighted imaging of the liver. The improved details can be potentially beneficial to clinical applications.Acknowledgements
No acknowledgement found.References
1. Taouli B, Koh D-M. Diffusion-weighted MR Imaging of the Liver. Radiology. 2010;254(1):47-66.
2. Lewis S, Dyvorne H, Cui Y, Taouli B. DIFFUSION-WEIGHTED IMAGING OF THE LIVER: TECHNIQUES AND APPLICATIONS. Magnetic resonance imaging clinics of North America. 2014;22(3):373-95.
3. Porter DA, Heidemann RM. High resolution diffusion-weighted imaging using readout-segmented echo-planar imaging, parallel imaging and a two-dimensional navigator-based reacquisition. Magnetic resonance in medicine. 2009;62(2):468-75.
4. Tokoro H, Fujinaga Y, Ohya A, Ueda K, Shiobara A, Kitou Y, et al. Usefulness of free-breathing readout-segmented echo-planar imaging (RESOLVE) for detection of malignant liver tumors: comparison with single-shot echo-planar imaging (SS-EPI). European journal of radiology. 2014;83(10):1728-33.
5. Bazelaire CMJd, Duhamel GD, Rofsky NM, Alsop DC. MR Imaging Relaxation Times of Abdominal and Pelvic Tissues Measured in Vivo at 3.0 T: Preliminary Results. Radiology. 2004;230(3):652-9.
6. Holdsworth SJ, Skare S, Newbould RD, Bammer R. Robust GRAPPA-Accelerated Diffusion-Weighted Readout-Segmented (RS)-EPI. Magnetic resonance in medicine : official journal of the Society of Magnetic Resonance in Medicine / Society of Magnetic Resonance in Medicine. 2009;62(6):1629-40.
Figures