3183
Imaging non-enlarged abdominal lymph nodes and measuring their diffusion coefficient1Sir Peter Mansfield Imaging Centre, School of Physics and Astronomy, University of Nottingham, Nottingham, United Kingdom, 2Nottingham Digestive Diseases Centre, University of Nottingham, Nottingham, United Kingdom, 3NIHR Biomedical Research Unit in Gastrointestinal and Liver Diseases, Nottingham University Hospital, Nottingham, United Kingdom
Synopsis
Inflammatory conditions such as Crohn’s disease cause changes in the lymphatics including enlargement and necrosis, and so improved measures of number, size and function of lymph nodes could provide novel markers of local inflammatory response. Being able to identify small nodes would allow the effect of inflammatory diseases and response to therapy to be monitored. DWIBS was used here to isolate the signal from small abdominal lymph nodes. The diffusion coefficient of the pelvic and abdominal lymph nodes and the cisterna chyli with IVIM effects eliminated, were 0.9±0.2, 1.4±0.3 and 1.7±0.6 x10⁻³ mm2/s.
Introduction
The lymphatic system forms a vital part of the immune system as well as providing a network to transport lipids and regulate interstitial fluid levels [1]. Inflammatory conditions such as Crohn’s disease cause changes in the lymphatics including enlargement and necrosis [2], and so improved measures of number, size and function of lymph nodes could provide novel markers of local inflammatory response. However there are no reports of imaging these small abdominal lymph nodes, except when they have been pathologically enlarged. Being able to identify small nodes would allow the effect of inflammatory diseases and response to therapy to be monitored.
Lymphatics can be identified on T2-weighted, Dixon and diffusion weighted imaging (DWI) MRI scans[3,4] and the Apparent Diffusion Coefficient (ADC) of lymph nodes can be measured using DWI. Diffusion Weighted Imaging with Background Suppression (DWIBS) uses free breathing and fat suppression to improve visualisation of lesions[5], recent studies used this to show a difference in ADC between benign and malignant enlarged abdominal nodes[4]. DWIBS was used here to isolate the signal from the small abdominal lymph nodes. Aim: to identify healthy abdominal lymph nodes and measure the diffusion coefficient, excluding any Intra voxel incoherent motion (IVIM) perfusion contributions.
Method
Ten participants were scanned on a Phillips 3T Ingenia (Best, the Netherlands) with ethics approval. DWIBS was optimized on the pelvic lymph nodes (N=5 subjects) since they are less affected by motion and are generally larger than abdominal nodes. Abdominal nodes were subsequently imaged in N=5 subjects. To reduce the through plane motion, slices were orientated sagittally, and respiratory triggering was used. B values between 0 and 1000 s/mm2 (spacing varied to investigate IVIM effects) were acquired with 6 averages each. The images were acquired with 1.67 x 1.67 x 5 mm3 voxels and reconstructed to 1.1 x 1.1 mm2 in-plane. TE= 75 ms, TI= 260 ms, TR=3000 ms [6].Results
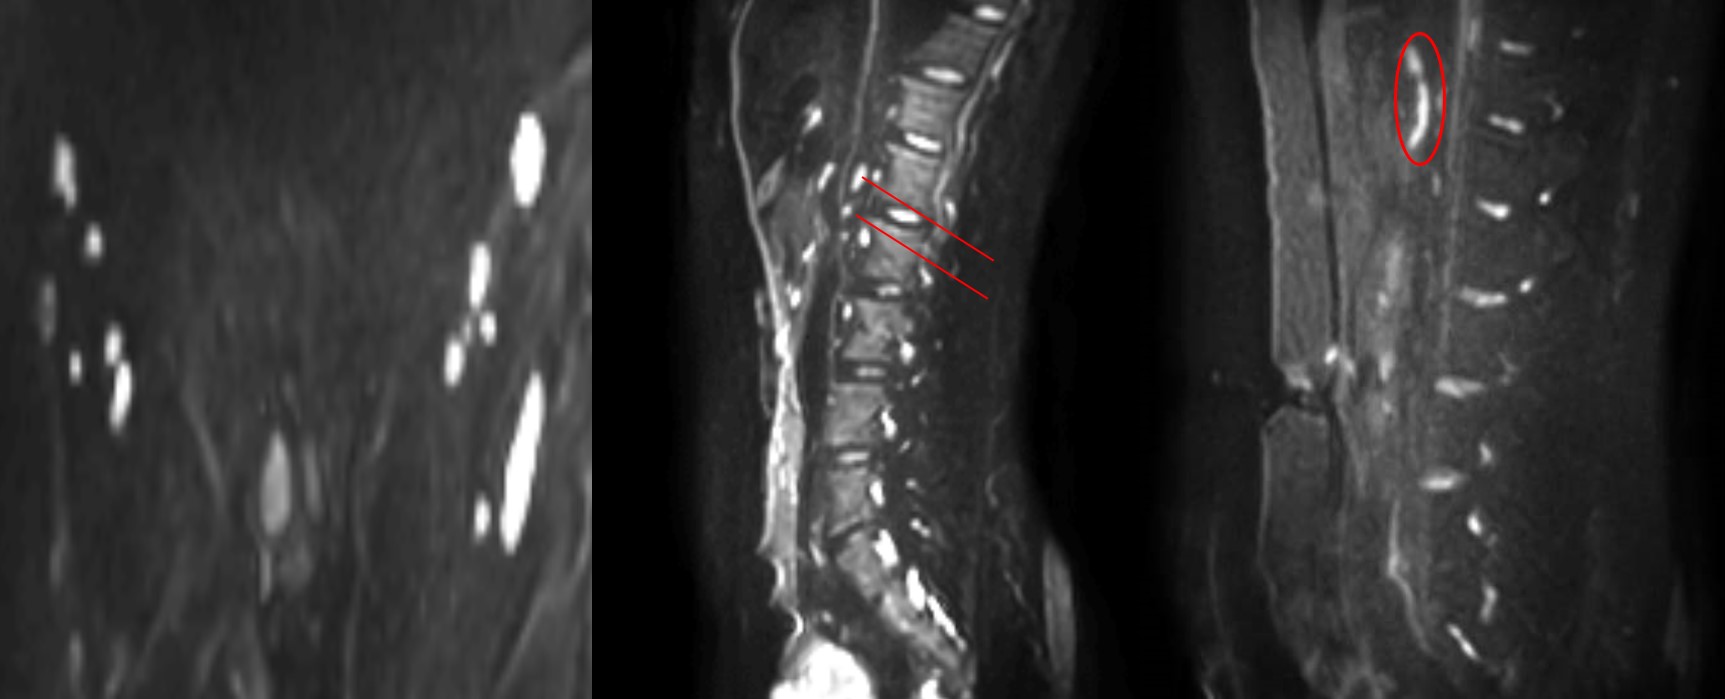
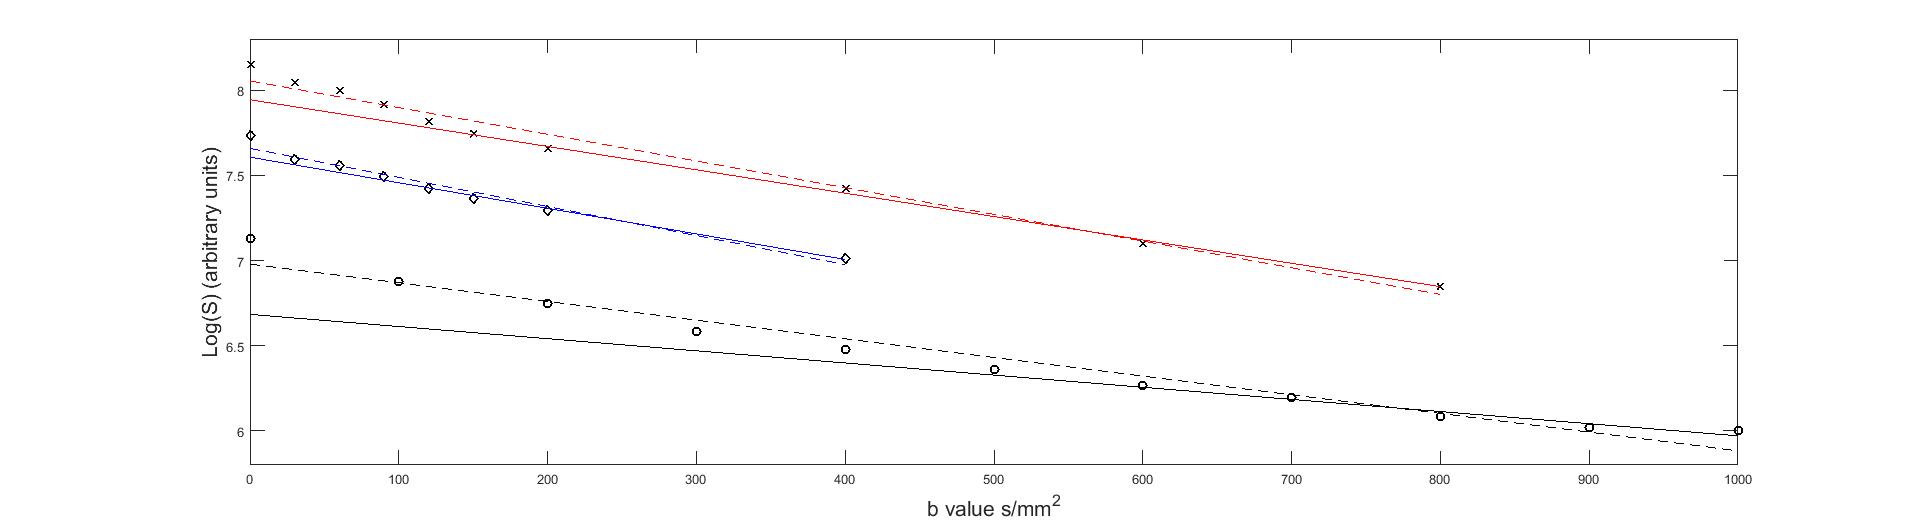
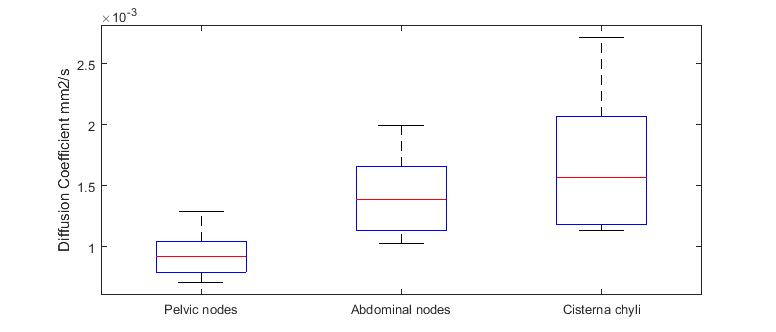
Figure 1 shows that diffusion weighted images highlighted small healthy pelvic and abdominal nodes and the cisterna chyli (sac like structure at the lower end of the thoracic duct[7]) Figure 2 shows the corresponding diffusion decay curves from which it was determined that generally b values above ~200 s/mm2 would exclude perfusion, but above 800 s/mm2 would give too low SNR. The diffusion coefficient was measured in 2 abdominal lymph nodes and the cisterna chyli for each of the 5 subjects. The diffusion coefficient of the pelvic lymph nodes, abdominal lymph nodes and the cisterna chyli with IVIM effects eliminated, were 0.9±0.2, 1.4±0.3 and 1.7±0.6 x10⁻³ mm2/s. Figure 3 summarises the inter subject variability in these results.Discussion
Imaging of abdominal lymph nodes is important for studying inflammatory diseases but presents a challenge due to their small size and respiratory and digestive motion. Here we have used DWIBS to highlight these nodes in healthy volunteers for the first time, overcoming the problem of low contrast in conventional imaging without the use of contrast agent [8]. This opens up the possibility of imaging changes in these small nodes in inflammatory disease. At least two abdominal lymph nodes were identified in each participant and the cisterna chyli was also visible in all participants. We characterised the diffusion decay curve to assess the diffusion coefficient of these lymph nodes without the confounding effects of perfusion (IVIM model). The measured values of the true diffusion coefficient in the lymph nodes was lower compared to previous measurements of ADC in enlarged nodes, which is to be expected (see figure 2)[4]. Thus we found the optimum b values to assess diffusion in the abdominal lymph nodes and the cisterna chyli in a feasible imaging time for future experimental studies of inflammatory diseases: the optimal b values are between 200 and 600s/mm2. Normally one would use b values separated by 1.1D but the greater values will contain too much noise[9]. The signal intensity from the cisterna chyli was lower than the abdominal lymph nodes suggesting that it has a lower T2 value or proton density than the lymph nodes.Conclusion
The diffusion coefficients of the pelvic lymph nodes, abdominal lymph nodes and the cisterna chyli with IVIM effects eliminated, were 0.9±0.2, 1.4±0.3 and 1.7±0.6 x10⁻³ mm2/s. The optimum b values to measure D in the abdominal nodes whilst eliminating IVIM effects and keeping above the noise floor were found to be 200 and 600 s/mm2.Acknowledgements
We would like to thank the Medical Research Council for funding this work.
References
1. Tortora, G.J. and B.H. Derrickson, Principles of Anatomy and Physiology, 9th Edition. 2000: Wiley. 2. Alexander, J.S., et al., Gastrointestinal lymphatics in health and disease. Pathophysiology, 2010. 17(4): p. 315-335.
3. Arrive, L., et al., Noncontrast Magnetic Resonance Lymphography. J Reconstr Microsurg, 2016. 32(1): p. 80-6.
4. Akduman, E.I., et al., Comparison Between Malignant and Benign Abdominal Lymph Nodes on Diffusion-weighted Imaging. Academic Radiology, 2008. 15(5): p. 641-646.
5. Takahara, T., et al., Diffusion weighted whole body imaging with background body signal suppression (DWIBS): technical improvement using free breathing, STIR and high resolution 3D display. Radiat Med, 2004. 22(4): p. 275-82.
6. Kwee, T.C., et al., Diffusion-weighted whole-body imaging with background body signal suppression (DWIBS): features and potential applications in oncology. European Radiology, 2008. 18(9): p. 1937-1952.
7. Swartz, M.A., The physiology of the lymphatic system. Adv Drug Deliv Rev, 2001. 50(1-2): p. 3-20.
8. Krishnamurthy, R., et al., Imaging the Central Conducting Lymphatics: Initial Experience with Dynamic MR Lymphangiography. Radiology, 2015. 274(3): p. 871-878.9. Conturo, T.E., et al., Diffusion MRI: precision, accuracy and flow effects. NMR Biomed, 1995. 8(7-8): p. 307-32.
Figures