3182
Prognostic Value of Pretreatment Diffusion Weighted Magnetic Resonance Imaging based Texture in Concurrent Chemo-radiotherapy of Esophageal Squamous Cell Cancer1Shandong Cancer Hospital to Shandong University, Shandong Academy of Medical Sciences, Jinan, People's Republic of China, 2Department of Radiation Oncology, the Fourth Hospital of Hebei Medical University, Shijiazhuang, People's Republic of China, 3Philips Healthcare, Shanghai, People's Republic of China
Synopsis
This study has important clinical significance. The pretreatment texture features combined with conventional prognostic factors may present a more accurate predictive tool for OS of ESCC patients. The parameters can be used to evaluate the prognosis of ESCC after CRT at an early time.
Purpose
To explore the prognostic value of diffusion weighted magnetic resonance imaging (DWI) 3D texture features [1,2] in esophageal squamous cell carcinoma (ESCC) patients undergoing concurrent chemo-radiotherapy (CRT).Methods
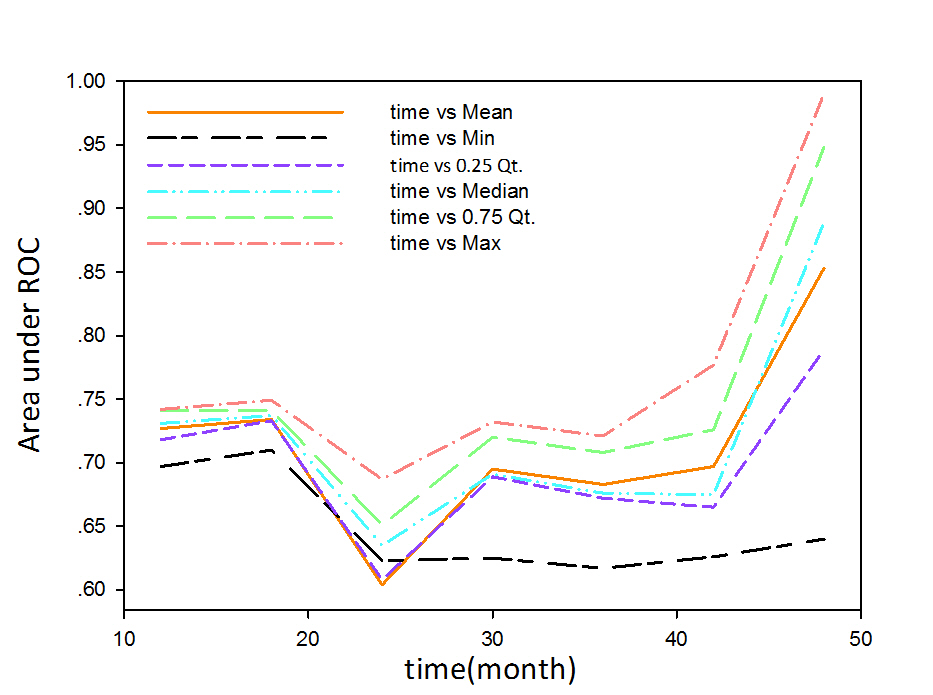
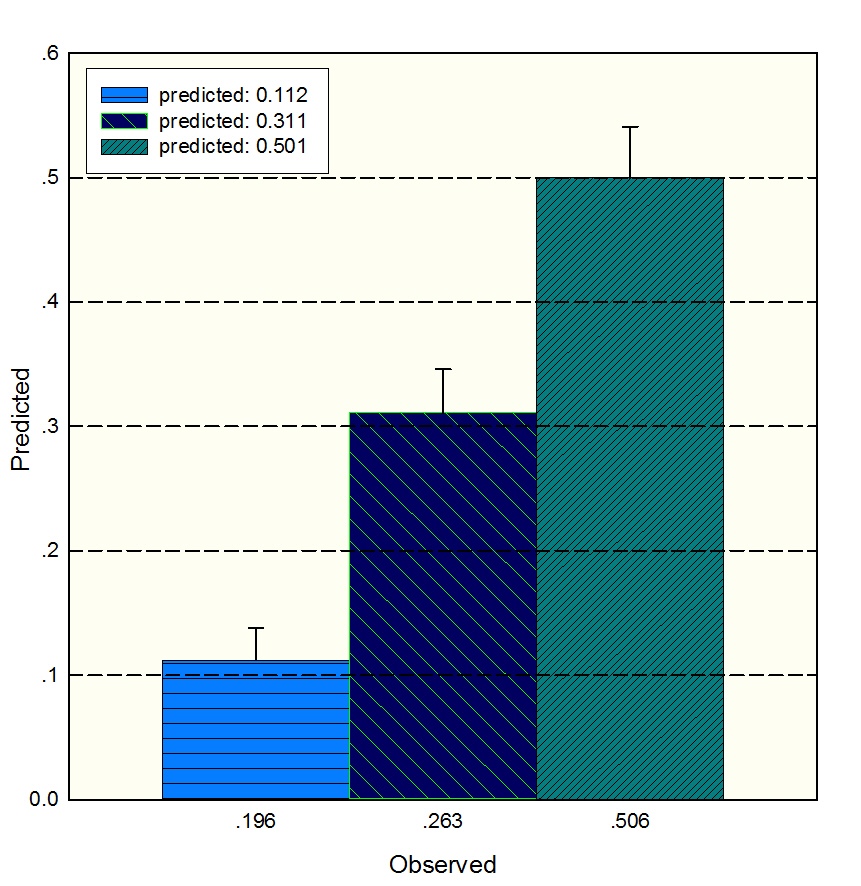
We prospectively enrolled 82 cases with ESCC into a cohort study which underwent DWI before CRT. All MR examinations included axial T2WI, T1WI and diffusion-weighted sequences (b=0, b=600 s/mm2). Two groups of tumor features were examined: (1) clinical features (eg, TNM stage, age and gender) and demographics; (2) spatial texture features of apparent diffusion coefficient (ADC), which characterize tumor intensity range, spatial patterns and distribution and associated changes resulting from CRT. A reproducible and no redundant feature set was statistically filtered and validations. The prognostic value of each parameter for overall survival was investigated using Kaplan-Meier and Cox regression models for univariate and multivariate analyses respectively.Results
Both univariate and multivariate Cox model analyses showed that the radiation dose; IHIST_energy, m_contrast_1, m_clustershade_2, Diff_ClusetrTendency_2, Diff_homogeneity_2, m_lnversevariance_2, high intensity small zone emphasis (HISE) and low intensity large zone emphasis (LILE) [3] associated significantly with the survival. Our study showed seven 3D texture parameters extracted from ADC maps could distinguish high, median and low risk groups (Log-rank c2=9.7, P=0.00773).Discussion
DWI is a powerful MR sequence that provides unique information related to tumor cellularity and the integrity of the cellular membrane. The technique can be applied widely for tumor detection and tumor characterization and for the monitoring of response to treatment. The ADC map can be acquired by two DWIs (e.g., the b values of 0 and 600mm/s2) in MR work station. It is independent of magnetic field strength and can overcome the effects of T2 shine-through, thus allowing more meaningful comparison of results.Conclusions
The ADC 3D texture features can be useful biomarkers to predict the survival of ESCC patients underwent CRT. The combination of DWI texture and conventional prognostic factors can be used to generate robust predictive models for survival rate.Acknowledgements
This work was supported in part by the National Natural Science Foundation of China under Grants 81530060 , 81272501 and by Taishan Scholars Program of Shandong Province, China (Grant NO. ts20120505). Engineering research center for medical imaging and radiation therapy of Shandong province also gave great support.References
1. Ng F, Kozarski R, Ganeshan B, Goh V. Assessment of tumor heterogeneity by CT texture analysis: can the largest cross-sectional area be used as an alternative to whole tumor analysis? Eur. J. Radiol. 2013;82(2):342-8. doi:10.1016/j.ejrad.2012.10.023
2. Tixier F, Le Rest CC, Hatt M, Albarghach N, Pradier O, Metges JP, Corcos L, Visvikis D. Intratumor heterogeneity characterized by textural features on baseline 18F-FDG PET images predicts response to concomitant radiochemotherapy in esophageal cancer. J. Nucl. Med. 2011;52(3):369-78. doi:10.2967/jnumed.110.082404
3. Haralick RM, K S, H. DI. Textural features for image classification. IEEE Trans. Syst. Man Cybern. 1973;3(6):22.
Figures