3181
Gradient First Moment Dependence of ADC in Liver Diffusion Weighting Imaging.1Department of Radiological Sciences, University of California, Los Angeles, CA, United States, 2Biomedical Physics IDP, University of California, Los Angeles, CA, United States
Synopsis
The effect of perfusion on Diffusion Weighting Imaging (DWI) and particularly the Apparent Diffusion Coefficient (ADC) at low b-value is a confounder in pathology assessment. In this study, in order to investigate the gradient first moment (M1) dependence of perfusion on the ADC, waveforms were generated using convex diffusion encoding (CODE) framework leading to a range of M1 for a given b-value. After comparing ADC calculated with different M1 and different b-value, we found that motion compensated waveform (M1=0) ensures independence of the ADC to perfusion even at low b-value, which can improve SNR.
Purpose
Diffusion Weighting Imaging (DWI) is a non-contrast MRI technique that can detect and characterize hepatic tumors1. In particular, Apparent Diffusion Coefficient (ADC) measurements in the liver have shown promising results for the assessment of necrotic lesions2.
However, DWI signals, in general, do not follow a mono-exponential decay due to the multi-compartmental composition of human tissues that imparts perfusion sensitivity and complicates ADC measurement. The DWI signal is particularly sensitive to perfusion at low b-values, as has been demonstrated in the intra-voxel incoherent model3 (IVIM). To limit the contribution from perfusion in ADC measurements, recommendations suggest using two b-values outside the perfusion range4 (typically >200 s/mm²). Usually even higher b-values are selected to minimize any perfusion contribution, but this can result in an acquisition with low SNR.
Recent work5,6 has demonstrated that the perfusion sensitivity of DWI is dependent on the first moment (M1) of the diffusion encoding gradient waveform in addition to the b-value. By using a motion compensated waveform (M1=0), it is theoretically possible to limit the impact of perfusion on the DWI signal at any b-value, which would enable accurate (perfusion-free) ADC measurements with lower b-values and consequently improved SNR.
In this study, we investigate the M1 dependence of the ADC using DWI with a range of M1 and b-values in the healthy liver.
Materials and methods
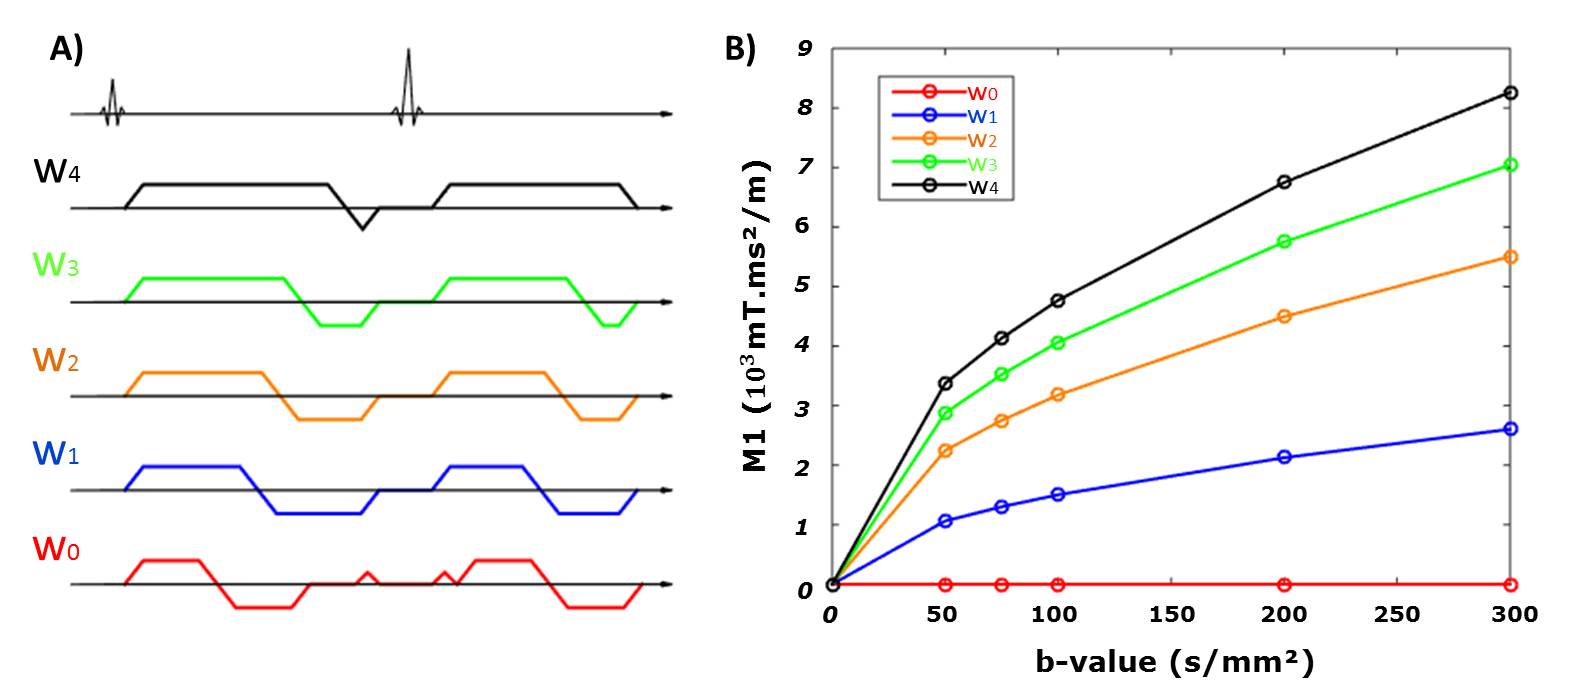
Healthy volunteers (N=5) were imaged on a 3T scanner (Prisma, Siemens). The convex optimized diffusion encoding (CODE) framework proposed by Aliotta7 was modified and used to generate five different diffusion encoding waveforms (w0-w1-w2-w3-w4). Six different low b-values (0, 50, 75, 100, 200, 300s/mm²) were acquired with six directions and two repetitions. For each waveform, M1 increased differently with increasing the b-value as shown in Fig. 1. A single axial SE-EPI DWI slice was acquired with a spatial resolution of 2.7x2.7x5mm (interpolated to 1.3x1.3x5mm with zero filling), TE/TR=54ms/4000ms, end-respiratory triggering, scan time~20-minutes. TE was fixed for the five waveforms. ADC maps were generated pixel-wise for each b-value (bi) and a reference b-value (b0) using the equation:
$$ ADC=log(S_i/S_0) /(b_0-b_i) $$
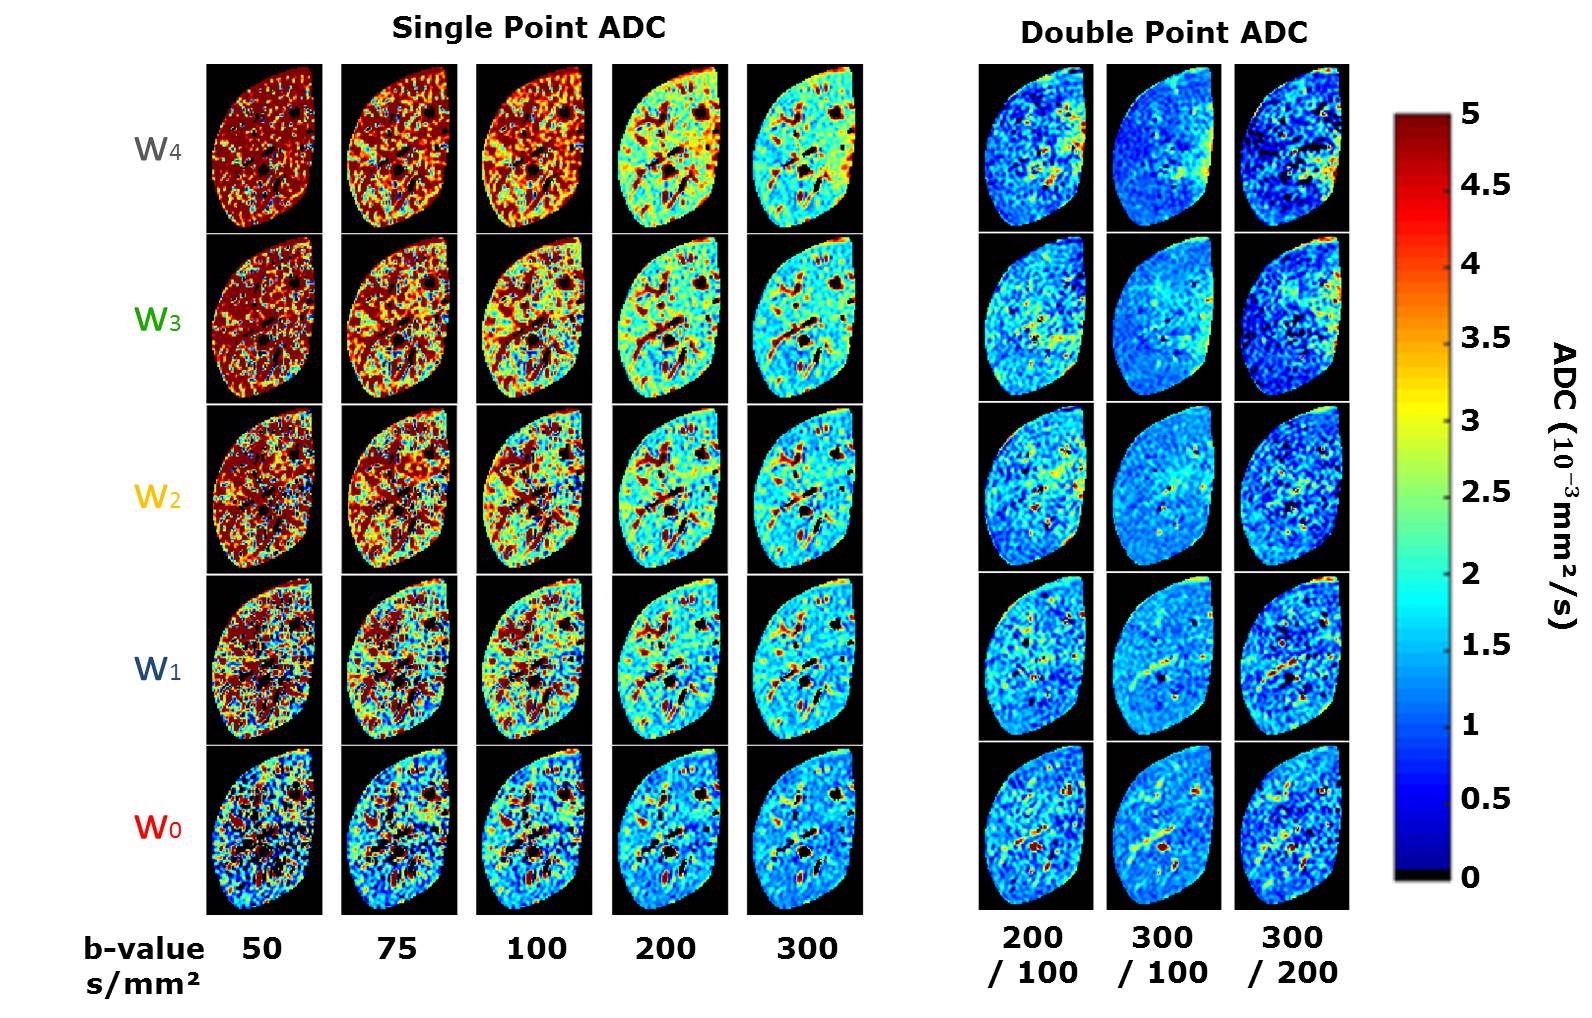
Where Si is the diffusion weighting signal corresponding to the b-value bi. The single point ADC was calculated using each of the five b-values (bi=[50, 75, 100, 200, 300s/mm²]) independently and the non-weighted imaging (b0=0) as reference. Two-point ADC maps were also generated using b0=[100 or 200s/mm²] and using bi=[200 and 300s/mm²]. Mean liver ADC was then measured for each method using a manual segmentation of the left lobe of the liver.
Results
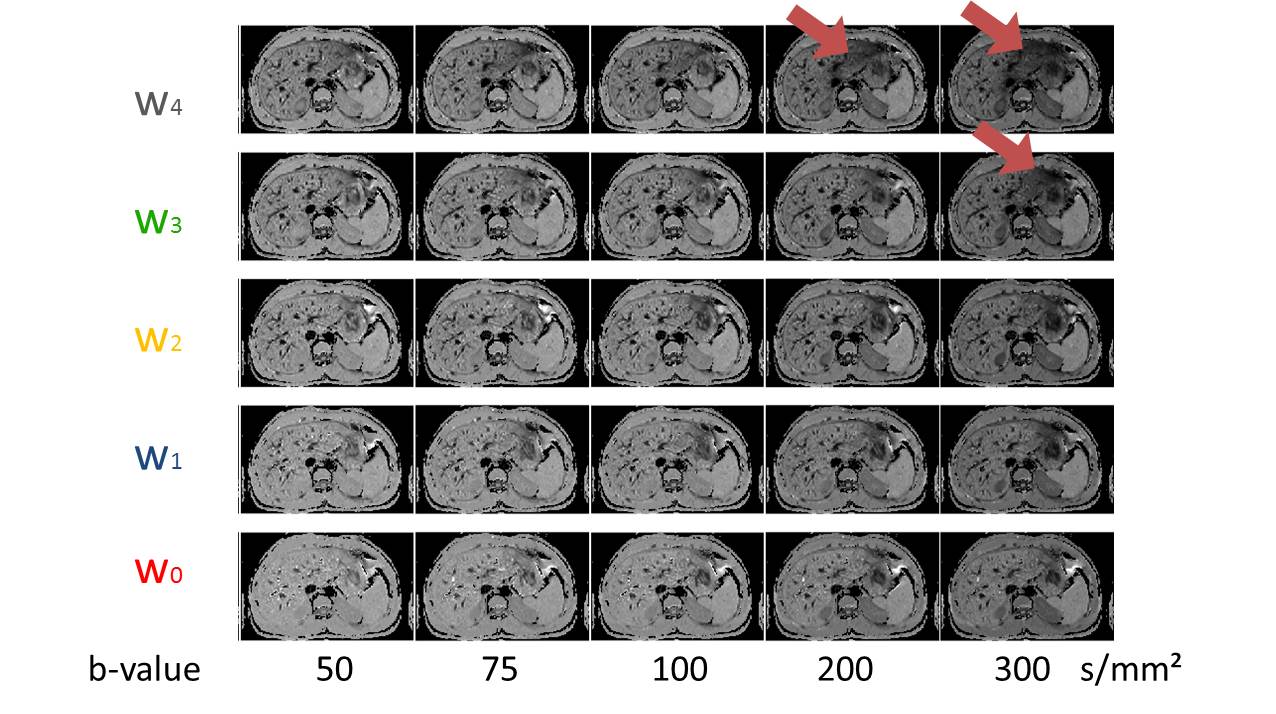
Fig. 2 shows example normalized DWI (Si/S0) for every combination of the five waveforms and the five b-values. Example ADC maps are shown in Fig. 3 for the single-point and two-point calculations. For the single-point case, perfusion has a large impact on the DWI signal especially at low b-value, leading to the expected overestimation of ADC.
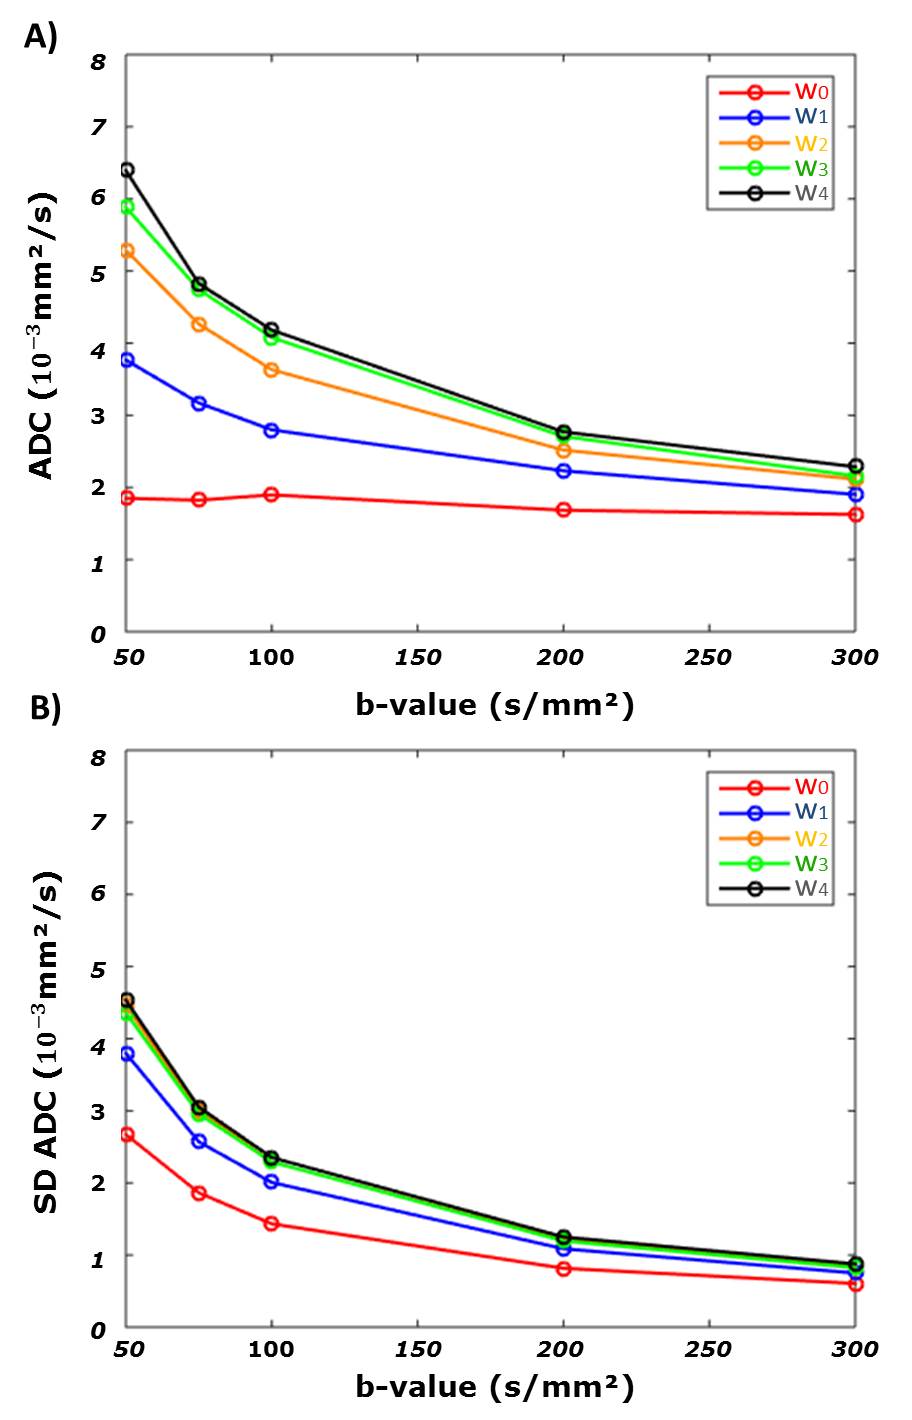
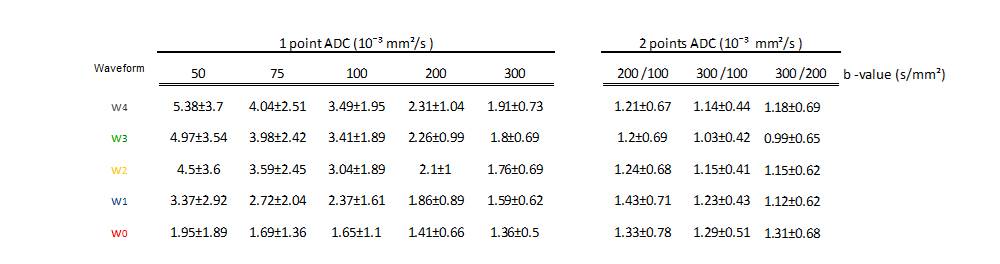
Fig 4 shows the mean and standard deviation (SD) of ADC across the volunteers for the single-point calculation where it is apparent that perfusion contribution is function of M1 and b-value. Mean ADC obtained with the motion compensated waveform (w0) appears independent of b-value, however the SD remains higher for low b-values.
As reported in Fig 5, ADCs calculated with the two-point method have lower ADCs than the single-point method. As expected, only the ADCs obtained with the waveform w0 converge to the same value for both calculations.
Discussion
The results clearly demonstrate the perfusion dependence of ADC at low b-values as a function of the diffusion encoding gradient’s M1.
The differences in the two-point measurements between the flow compensated waveform (w0) and the other waveforms (w1-4) is explained by micro-vascular and large vessels. Indeed, motion compensated DWI leads to bright vessels in both the DWI and the b=0 images (Fig2) and thus the micro-vascular diffusion signal will add to the ADC measure. In the case of the other waveforms the vessels are black in both the reference and the main images and there is no impact on ADC.
The w0 waveform is very promising and shows low perfusion sensitivity using the single-point calculation which benefits from b-value = 0 images having higher SNR than DWI with b-value>0 .
Future work will focus on using this approach to generate maps of perfusion in addition to ADC.
Conclusion
Acknowledgements
Funding support from the Department of Radiological Sciences.References
(1) Charles-Edwards, E. M., & deSouza, N. M. (2006). Diffusion-weighted magnetic resonance imaging and its application to cancer. Cancer Imaging, 6(1), 135–143. http://doi.org/10.1102/1470-7330.2006.0021
(2) Kele, PG., Jagt, EJVD. (2010) Diffusion weighted imaging in the liver. World J Gastroenterol., 16(13): 1567-1576
(3) Le Bihan, D., Breton, E., Lallemand, D., Aubin, ML., Vignaud, J., Laval-Jeantet, M. (1988) Separation of Diffusion and Perfusion in Intravoxel Incoherent Motion MR Imaging, Radiology., 168:497-505
(4) Dyvorne, H. A., Galea, N., Nevers, T., Fiel, M. I., Carpenter, D., Wong, E., … Taouli, B. (2013). Diffusion-weighted Imaging of the Liver with Multiple b Values: Effect of Diffusion Gradient Polarity and Breathing Acquisition on Image Quality and Intravoxel Incoherent Motion Parameters—A Pilot Study. Radiology, 266(3), 920–929. http://doi.org/10.1148/radiol.12120686
(5) Wetscherek, A., Stieltjes, B. and Laun, F. B. (2015), Flow-compensated intravoxel incoherent motion diffusion imaging. Magn. Reson. Med., 74: 410–419. doi:10.1002/mrm.25410
(6) Ahlgren, A., Knutsson, L., Wirestam, R., Nilsson, M., Ståhlberg, F., Topgaard, D., and Lasic, S. (2016) Quantification of microcirculatory parameters by joint analysis of flow-compensated and non-flow-compensated intravoxel incoherent motion (IVIM) data. NMR Biomed., 29: 640–649. doi: 10.1002/nbm.3505.
(7) Aliotta, E., Wu, H. H. and Ennis, D. B. (2016), Convex optimized diffusion encoding (CODE) gradient waveforms for minimum echo time and bulk motion–compensated diffusion-weighted MRI. Magn. Reson. Med.. doi:10.1002/mrm.26166
Figures