3180
Unbiased diffusional kurtosis measurements in the pelvis at low signal-to-noise ratio: A new approach for noise-level estimations1Institute for Clinical Radiology, Ludwig-Maximilians-University Hospital Munich, Munich, Germany
Synopsis
The purpose of this study was to propose a robust technique for the determination of unbiased kurtosis values in body applications; for this aim, a new strategy to pixelwise estimate the noise level in DKI acquisitions is described and its feasibility for pelvic DKI is demonstrated in prostate tissue.
The "naive" evaluation (without considering the image noise) resulted in significantly biased positive kurtosis values of urine of $$$K=0.42\,($$$standard deviation: $$$0.06)$$$, indicating non-monoexponential signal decay caused by the influence of noise at higher b-values. This bias is almost completely removed ($$$K=-0.01\,(0.32)$$$) after including the pre-calculated noise-level map in the evaluation.
Purpose
Diffusional kurtosis imaging (DKI) is a technique to assess the extent of non-Gaussian water diffusion in biological tissue, which reflects properties of tissue microstructure.1 DKI is based on the non-monoexponential signal attenuation at high b-values $$$(b_{\max}\approx2000\,\text{s/mm}^2)$$$. However, non-monoexponential signal attenuation influencing the DKI analysis can also be caused by very low signals at or below the noise level – particularly, in body applications, where relatively short $$$T_2$$$ relaxation times and high diffusion coefficients compromise the obtainable signal-to-noise ratio (SNR).
Microcapillary tissue perfusion (as described by intravoxel-incoherent-motion (IVIM) MRI2,3) can be a further cause (additional to actual high-b non-gaussian diffusion and influences of noise) of non-monoexponential signal attenuation in pelvic applications.4
The purpose of this study was to propose a robust technique for the determination of unbiased kurtosis values in body applications; for this aim, a new strategy to pixelwise estimate the
noise level in DKI acquisitions is described and its feasibility for pelvic DKI is demonstrated in prostate tissue.
Methods
MRI of the pelvis was performed on a 1.5-Tesla whole-body MRI system in 12 male patients (40–84y) with oncologic disease outside the prostate. A single-shot EPI sequence with 6 b-values of $$$0, 200, 500, 1000, 1500, 2000\,\text{s/mm}^2$$$ was used (isotropic diffusion weighting, scan duration: 7:06 min). The diffusion coefficient, $$$D$$$, and the diffusional kurtosis, $$$K$$$, of healthy appearing prostate tissue (center of the gland) and of urine in the bladder were obtained by non-linear least-squares DKI fitting with the DKI signal equation $$S_\text{DKI}(b)=S_0\exp\left(-bD+\frac{K}{6}(bD)^2\right)$$ (fit parameters: initial signal $$$S_0,D,K$$$) with three different methods:
(1) "naive" fitting of the signal equation to the signal at all 6 b-values,
(2) "noise-aware" fitting to the signal at all 6 b-values with a pixelwise estimated noise level as described below,
(3) "noise/IVIM-aware" fitting to the signal at the 5 b-values between $$$200$$$ and $$$2000\,\text{s/mm}^2$$$.
The (pixelwise pre-calculated) noise level $$$N$$$ (defined as the mean value of the noise signal) was included in the noise-aware non-linear fitting process (methods 2 and 3) by using so-called power images as proposed by Miller and Joseph5, i.e. the noisy signal $$$S_\text{noise}(b)$$$ was defined as $$S_\text{noise}(b;N)=\sqrt{S_{\text{DKI}}(b)^2+N^2}.$$
Estimation of noise level:
To pixelwise estimate the
magnitude-image noise level $$$N$$$ (which was assumed to vary spatially because of
parallel imaging, distortion correction, and signal-homogeneity filtering6),
we calculated a polynomial 2D fit (of order 8, i.e. a spatially low-pass
filtered image) to the magnitude signal at the highest b-value
($$$b=2000\,\text{s/mm}^2$$$) after masking of the residual signal. Based on
the observation that large areas of the highest b-value images do contain only
noise (and no visual signal), a mask was defined that included all pixels with
intensity lower than the 75th percentile of the slice signal (this mask was combined
with a foreground mask defined by thresholding the $$$b=0$$$ image); cf. Fig.
1.
Results
Diffusion coefficients and kurtosis values averaged over all 12 patients are summarized in Table 1. In the prostate, the averaged diffusivity was about $$$1.8\times10^{-3}\,\text{mm}^2/\text{s}$$$ and the averaged kurtosis was about $$$0.6$$$. The averaged diffusivity of urine was about $$$3.4\times10^{-3}\,\text{mm}^2/\text{s}$$$. The kurtosis of urine was $$$0.42$$$ (standard deviation $$$0.06$$$) with the naive approach, $$$-0.32 (1.21)$$$ with the noise-aware DKI evaluation, and $$$-0.01 (0.32)$$$ with the noise/IVIM-aware approach.
Examples of parameter maps obtained with all three approaches are shown in Figs. 2 and 3.
Discussion
In this study, we proposed a new technique to estimate the spatially varying noise level of DKI acquisitions and used the diffusional kurtosis of urine in the bladder as standard of reference to assess its feasibility: urine as a liquid with low viscosity should show approximately Gaussian diffusion behavior and, thus, an excess kurtosis of about 0. The "naive" evaluation resulted in significantly biased ($$$p<10^{-3}$$$, t-test) positive kurtosis values of urine of $$$K=0.42\,(0.06)$$$, indicating non-monoexponential signal decay caused by the influence of noise at higher b-values. This bias is almost completely removed ($$$K=-0.01\,(0.32)$$$) after including the pre-calculated noise-level map in the evaluation.
By discarding the $$$b=0$$$ acquisition, the
inter-individual standard deviation of kurtosis values improved and the diffusion
coefficient of the prostate decreased from $$$1.98\,(0.22)$$$ to
$$$1.74\,(0.21)\times10^{-3}\text{mm}^2/\text{s}$$$. The higher (kurtosis) variance of method (2) may be caused by image artifacts predominantly present in some $$$b=0$$$ image. Generally, our corrected kurtosis values of the prostate are slightly lower than earlier published results7,8 by about $$$10-20\%$$$.
Conclusion
DKI measurements (particularly in the body) are highly sensitive to the influence of noise on the signal. In this study, we demonstrated the feasibility to determine the (spatially varying) noise level by polynomial fitting and included this noise-level map in DKI of the prostate.Acknowledgements
No acknowledgement found.References
1. Jensen JH, Falangola MF, Hu C, et al. Preliminary observations of increased diffusional kurtosis in human brain following recent cerebral infarction. NMR Biomed. 2011;24(5):452-457.
2. Le Bihan D, Breton E, Lallemand D, et al.
Separation of diffusion and perfusion in intravoxel incoherent motion MR imaging.
Radiology. 1988;168(2):497-505.
3. Koh DM, Collins DJ, Orton MR. Intravoxel incoherent motion in body
diffusion-weighted MRI: reality and challenges. AJR Am J Roentgenol. 2011;196(6):1351-1361.
4. Dietrich O, Graser A, Karpitschka M et al. Influence of image noise and microcapillary perfusion (IVIM) on diffusional kurtosis measurements in the body. Proc Intl Soc Mag Reson Med. 2013;21:2082.
5. Miller AJ, Joseph PM. The use of power images to perform quantitative analysis on low SNR MR images. Magn Reson Imaging. 1993;11(7):1051-1056.
6. Dietrich O, Raya JG, Reeder SB, et al. Measurement of signal-to-noise ratios in MR images: influence of multichannel coils, parallel imaging, and reconstruction filters. J Magn Reson Imaging. 2007;26(2):375-385.
7. Roethke MC, Kuder TA, Kuru TH, et al. Evaluation of diffusion kurtosis imaging versus standard diffusion imaging for detection and grading of peripheral zone prostate cancer. Invest Radiol. 2015;50(8):483-489.
8. Rosenkrantz AB, Sigmund EE, Johnson G, et al. Prostate cancer: feasibility and preliminary experience of
a diffusional kurtosis model for detection and assessment of aggressiveness of
peripheral zone cancer. Radiology. 2012;264(1):126-135.
Figures
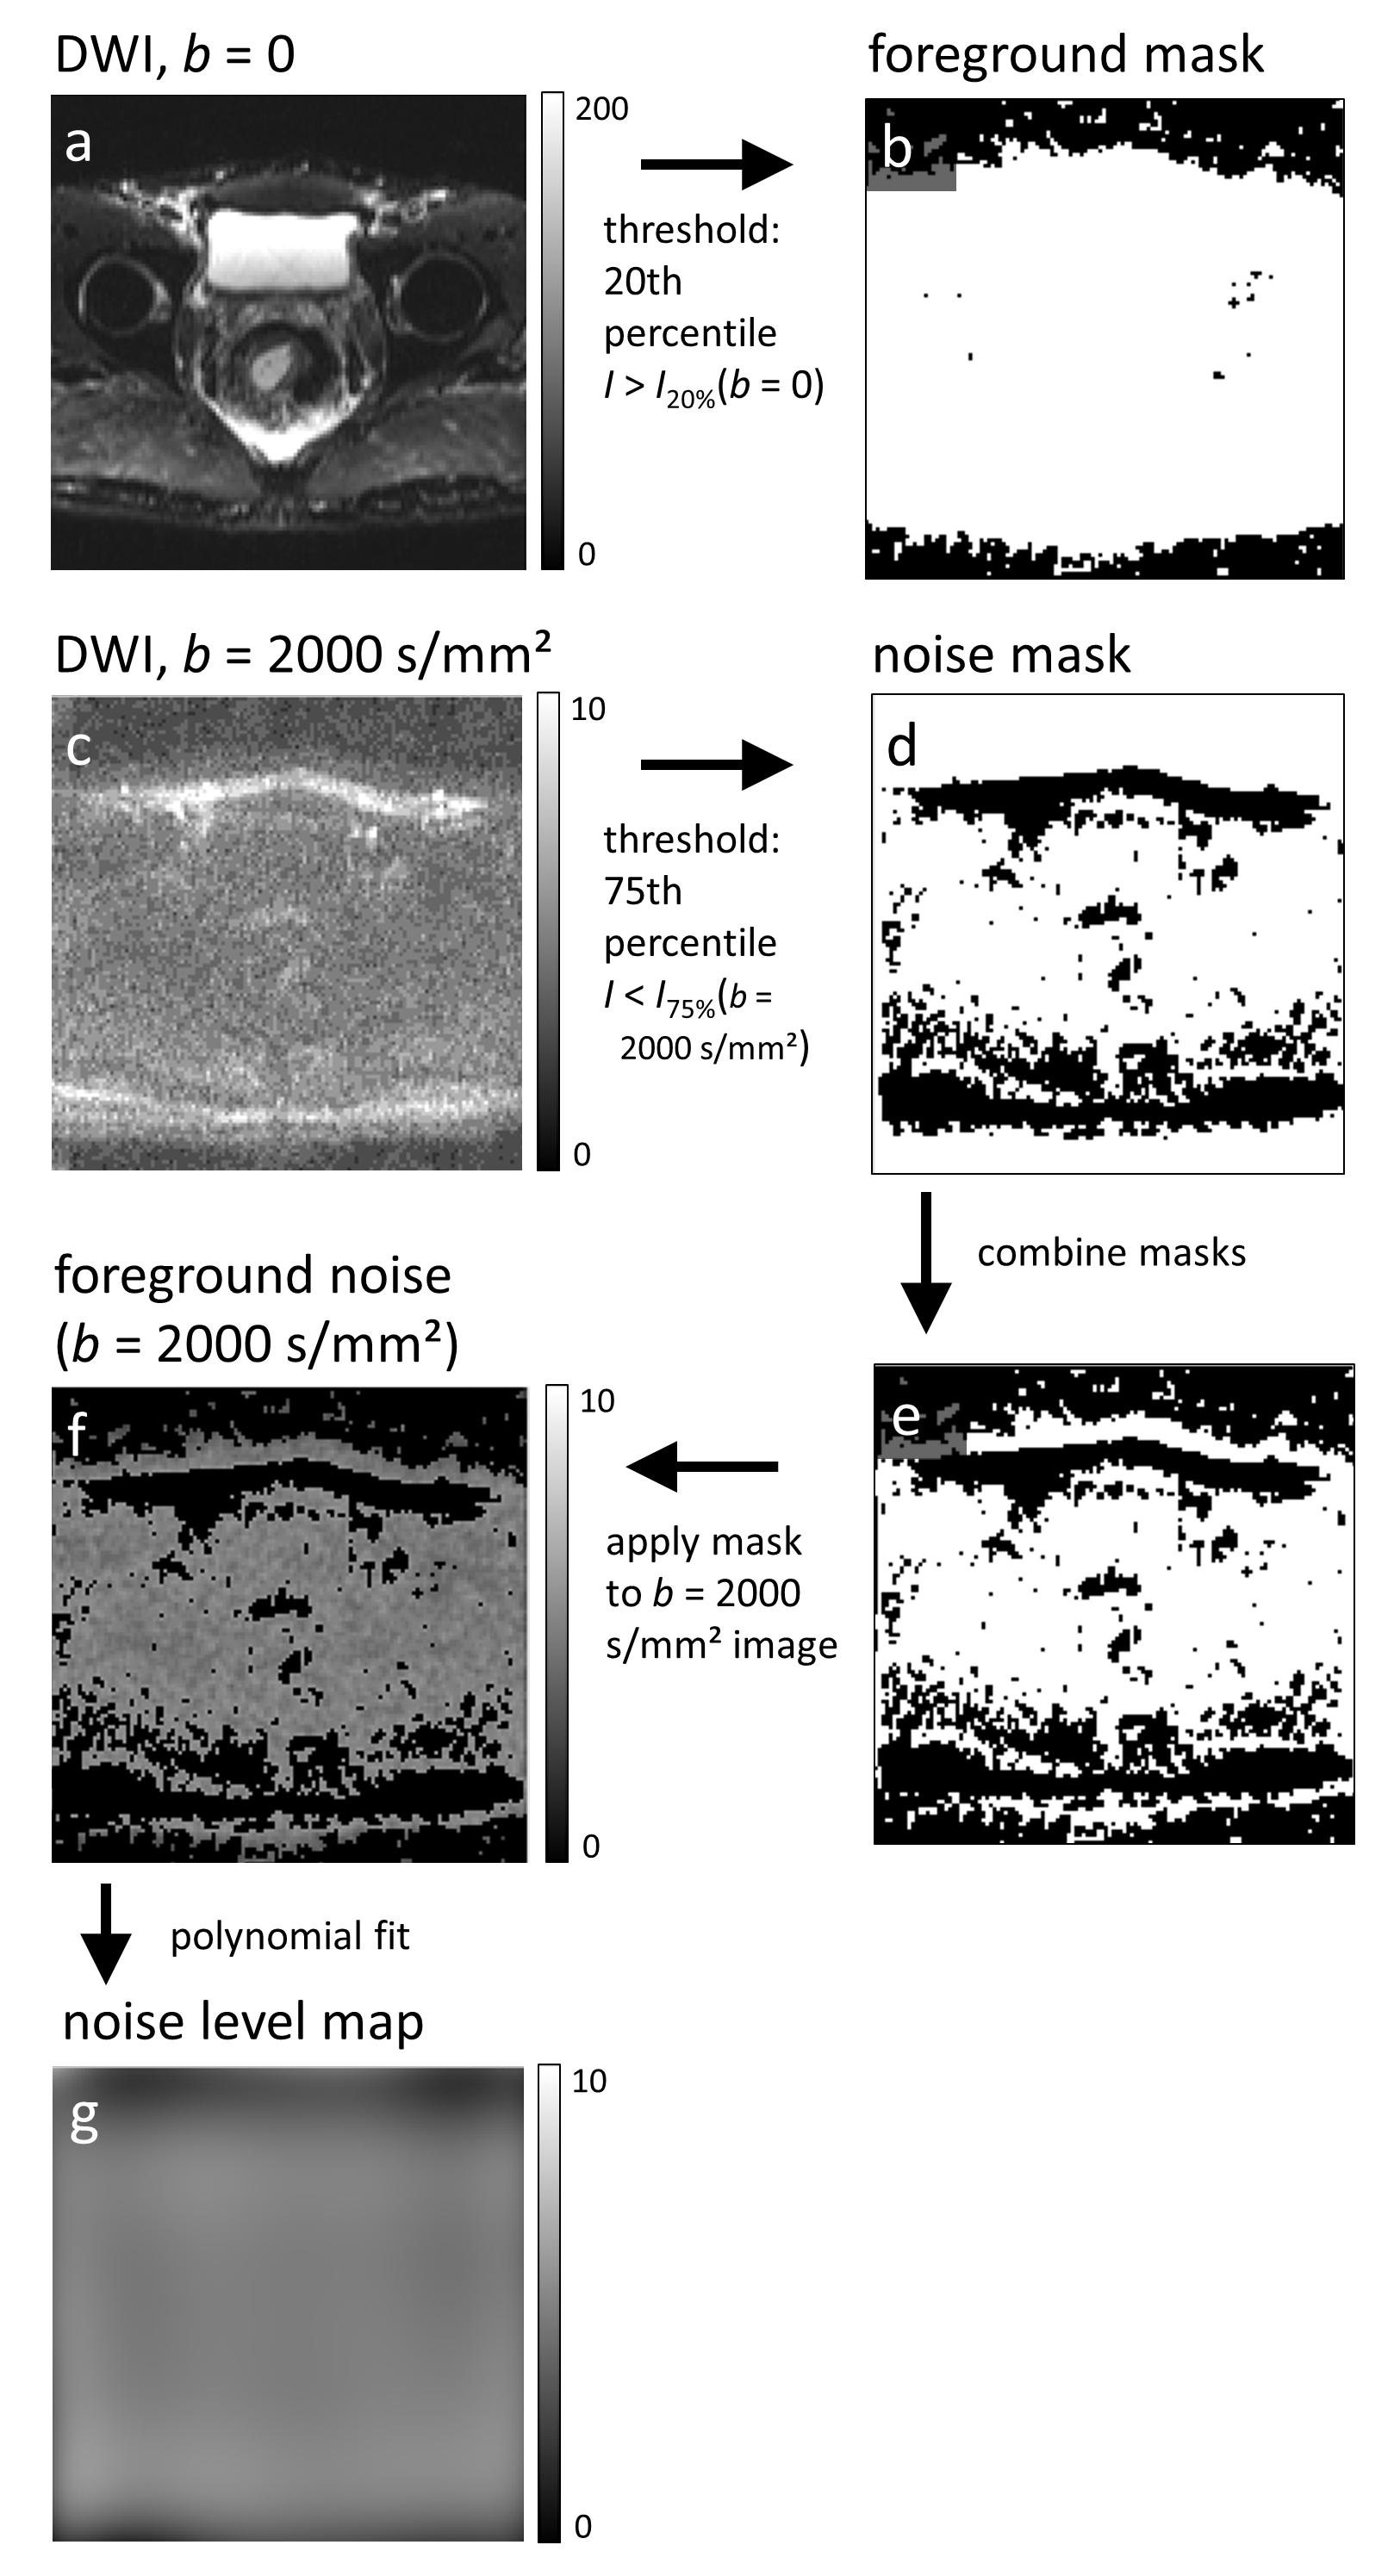
Figure 1: Calculation of the noise level map. (a) From the $$$b=0$$$ DWI, a foreground mask (b) is calculated by removing all pixels below the 20th percentile. (c) From the $$$b=2000\,\text{s/mm}^2$$$ DWI, a noise mask (d) is calculated by removing all pixels above the 75th percentile. (e) Both masks are combined and applied to the $$$b=2000\,\text{s/mm}^2$$$ DWI to obtain a noise-only image (f). A 2D polynomial fit to (f) is used to generate a noise-level map (g) for all pixels in the data set.
No user interaction is required to generate the noise-level map.
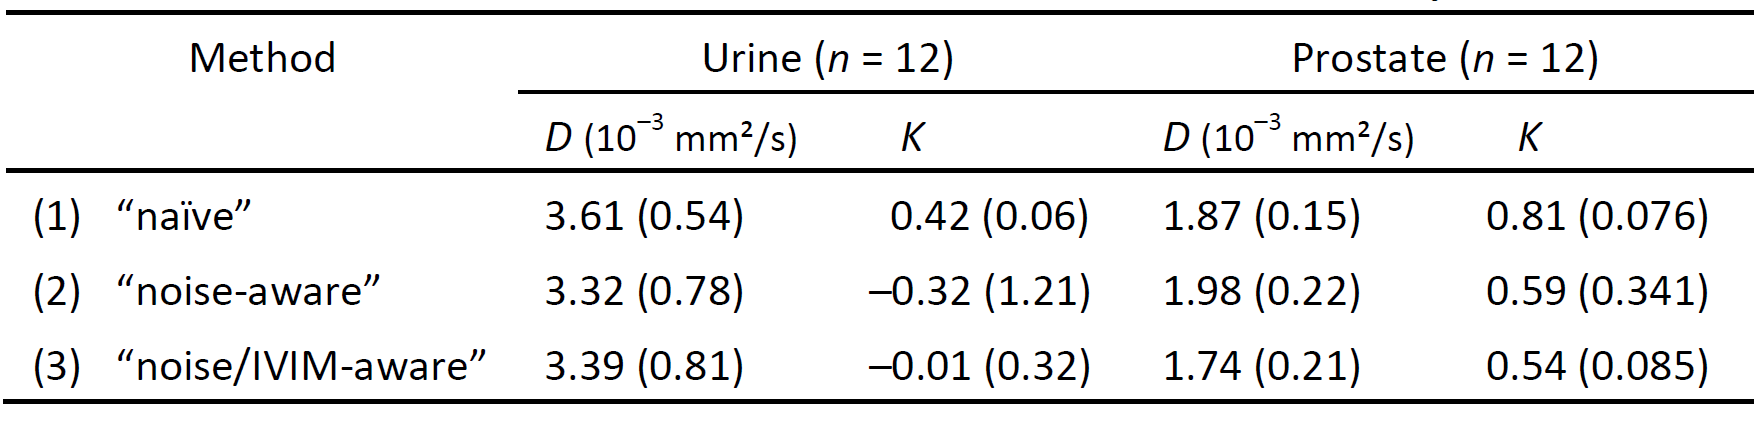
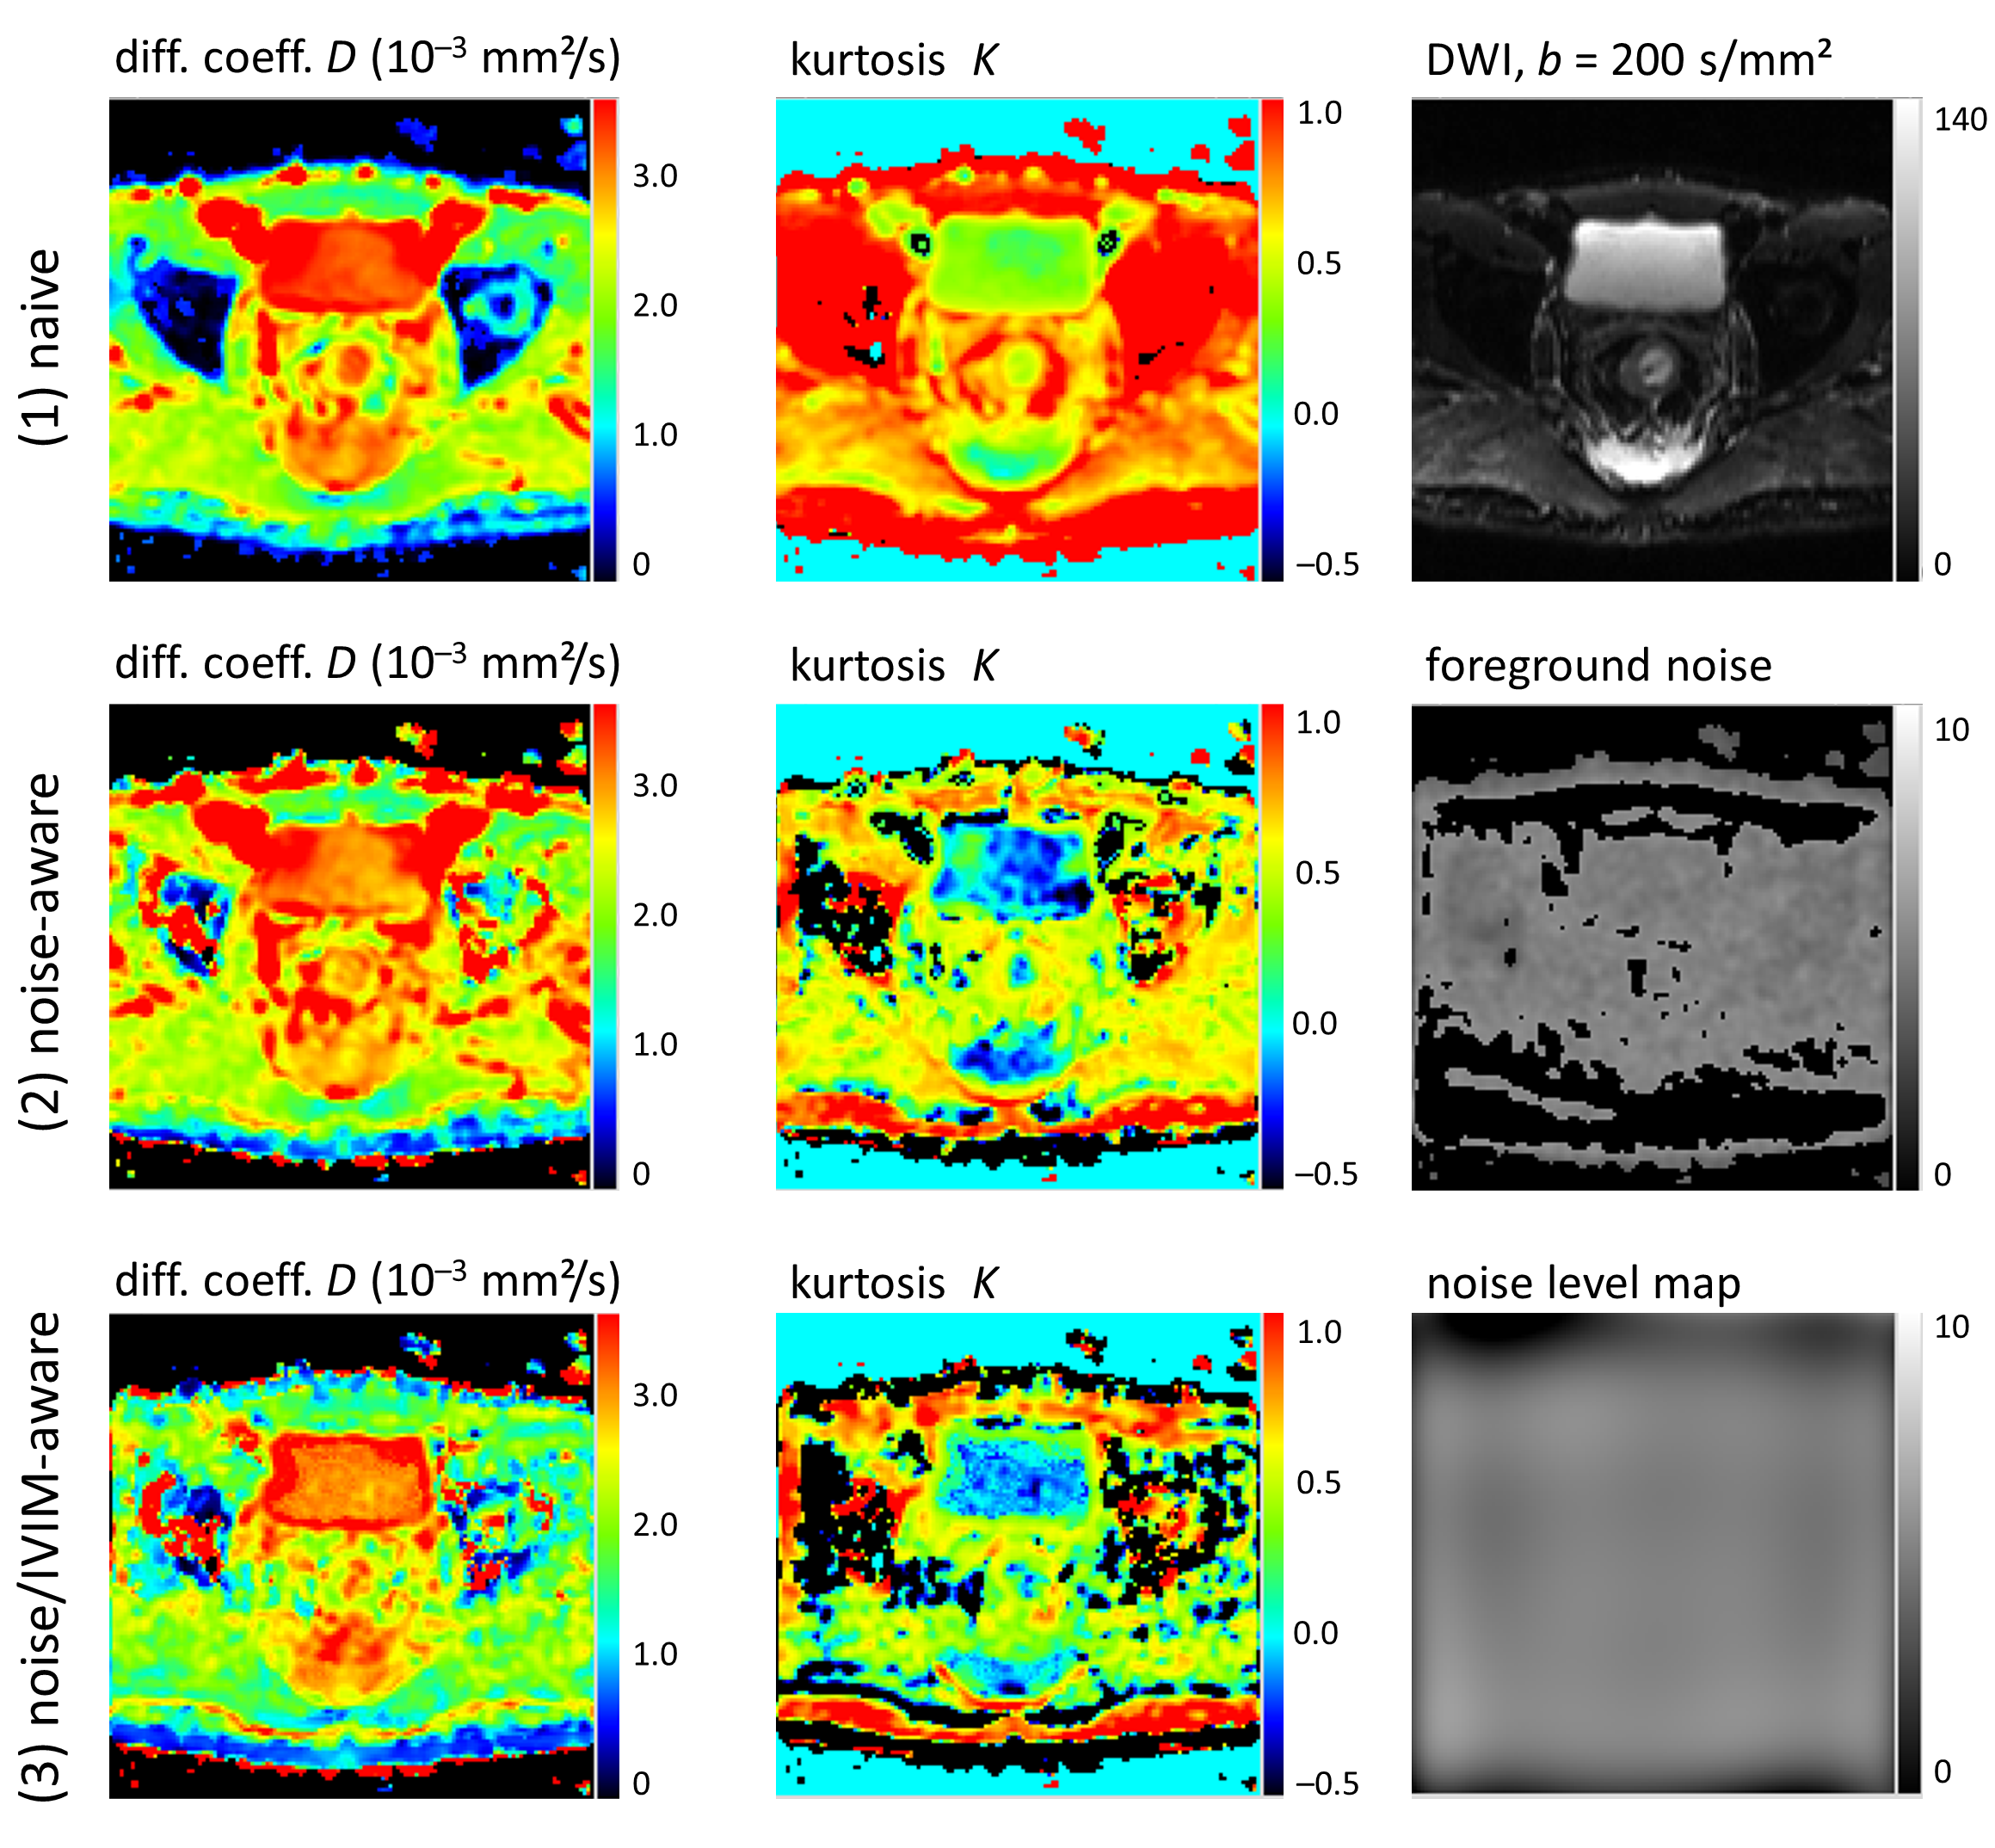
Figure 2: Example parameter maps of $$$D$$$ and $$$K$$$ (in the first two columns) from a slice at bladder level. The rows contain (1) the "naive", (2) the noise-aware, and (3) the noise/IVIM-aware evaluation approach.The kurtosis in the bladder is substantially increased in row (1) due to the influence of noise at high b-values. This bias is reduced in rows (2) and (3). Discarding the $$$b=0$$$ acquisition in row (3) results in generally lower (IVIM-corrected) diffusion coefficients outside the bladder compared to row (2).
Third column: a slice from the original data, masked foreground noise, and the calculated noise-level map.
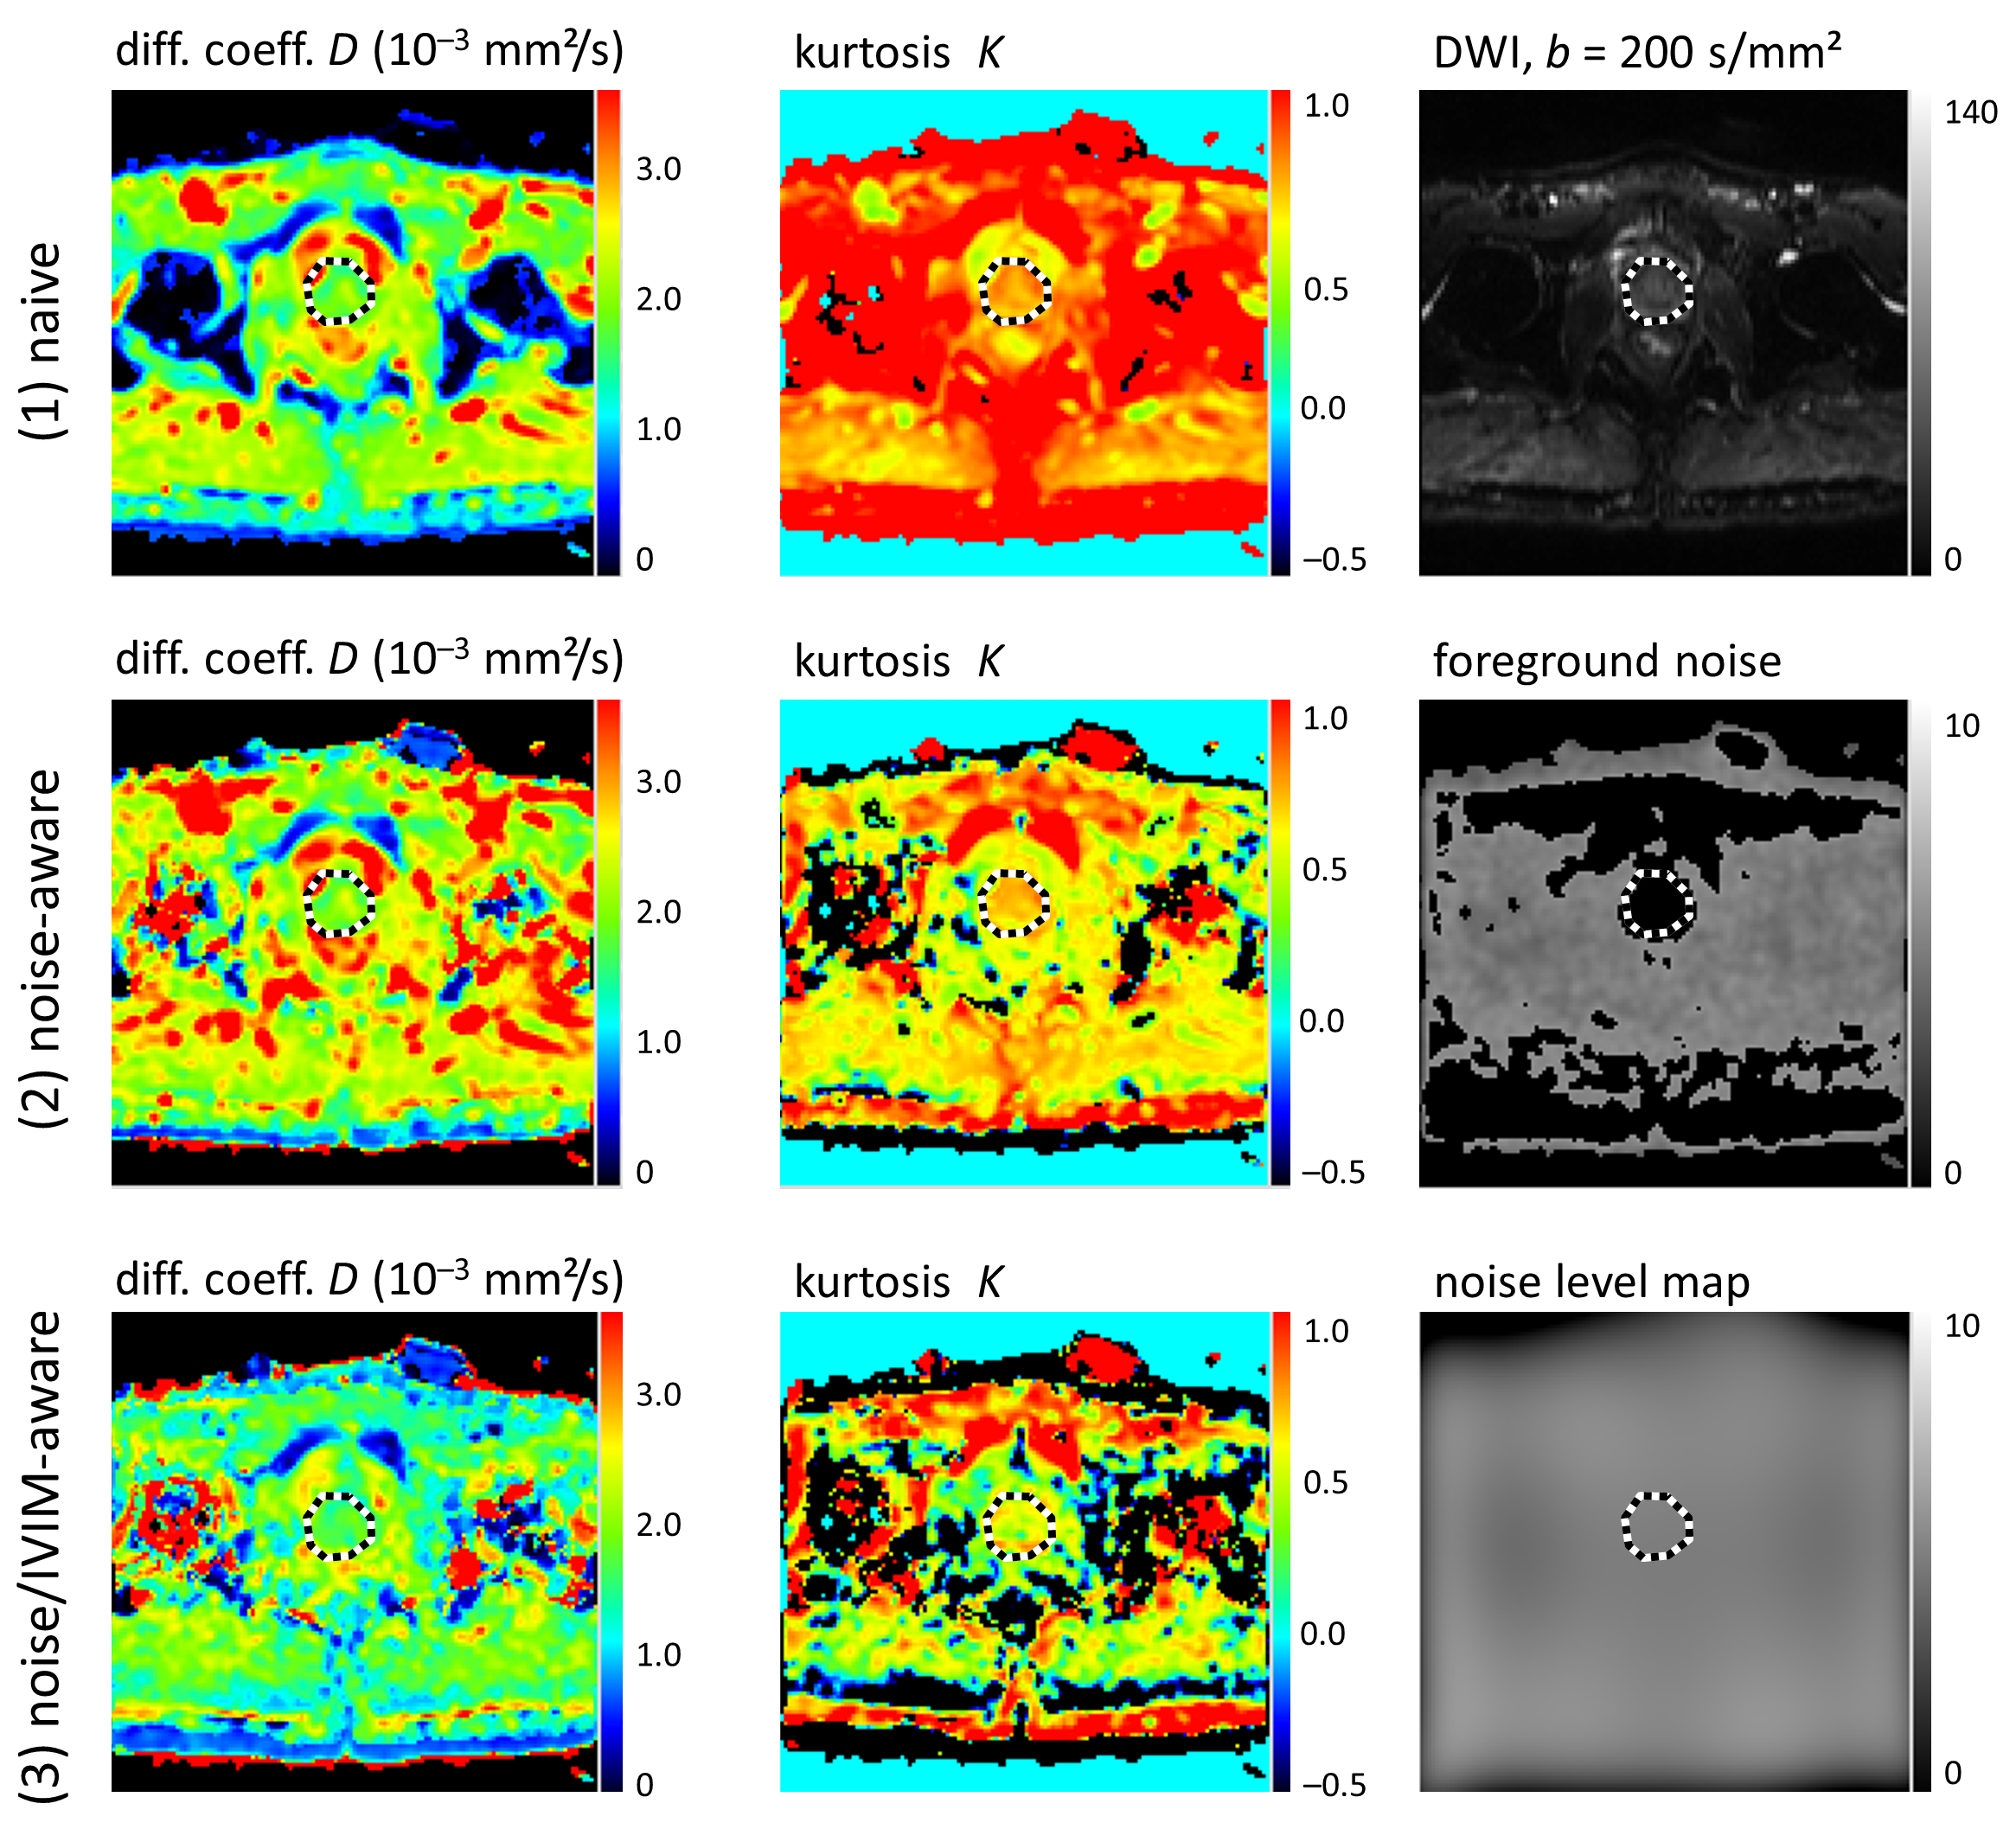
Figure 3: Example parameter maps of $$$D$$$ and $$$K$$$ from a slice at prostate level; figure layout as in Fig. 2. The kurtosis in the prostate (dotted region of interest) is increased in row (1) due to the influence of noise at high b-values. This bias is reduced in rows (2) and (3). Discarding the $$$b=0$$$ acquisition in row (3) results in generally lower (IVIM-corrected) diffusion coefficients compared to row (2).