3176
Early evaluation of liver fibrosis in radiation-induced liver fibrosis rat models using intra-voxel incoherent motion theory1MR Research China, GE Healthcare, Beijing, People's Republic of China, 2Medical Imaging Center, The First Affiliated Hospital of Jinan University, Guangzhou, People's Republic of China
Synopsis
This study found that IVIM-derived D could efficiently detect and differentiate the liver fibrosis in radiation-treaed rats at the early stage in vivo.
Introduction
We aimed to investigate the feasibility of intravoxel incoherent motion (IVIM) MRI in evaluating the early stages of liver fibrosis in radiation-induced liver fibrosis rats.Methods
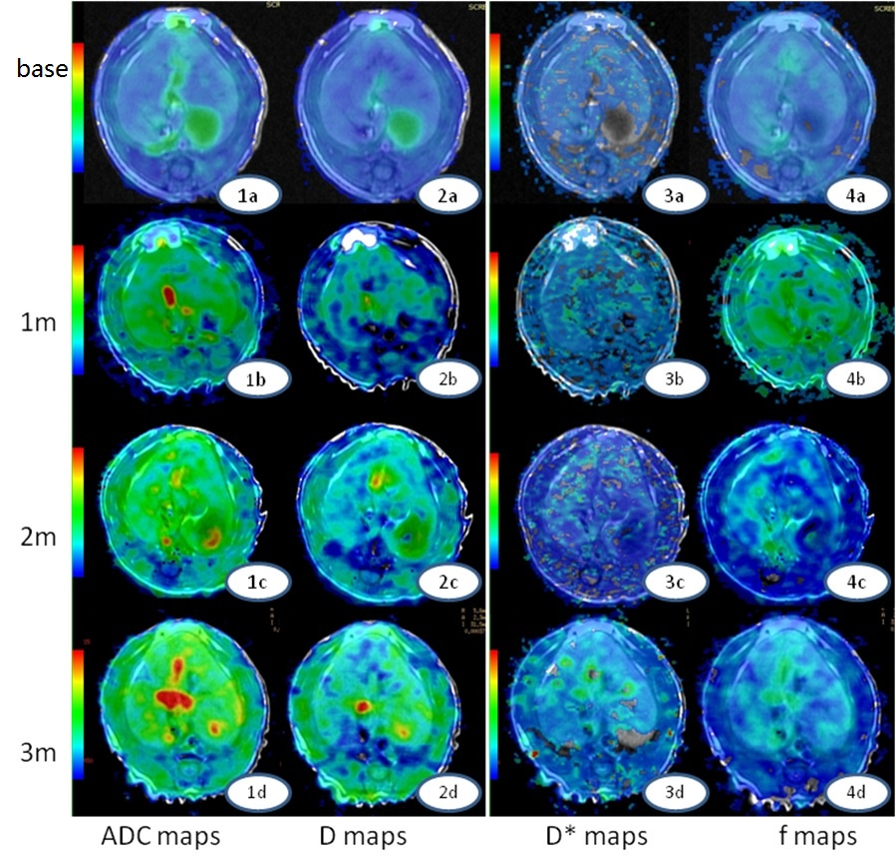
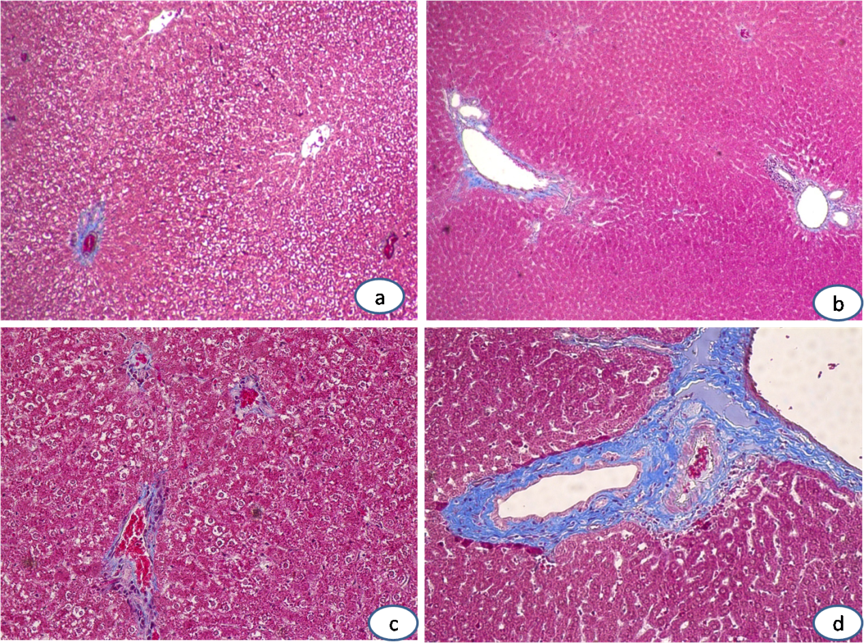
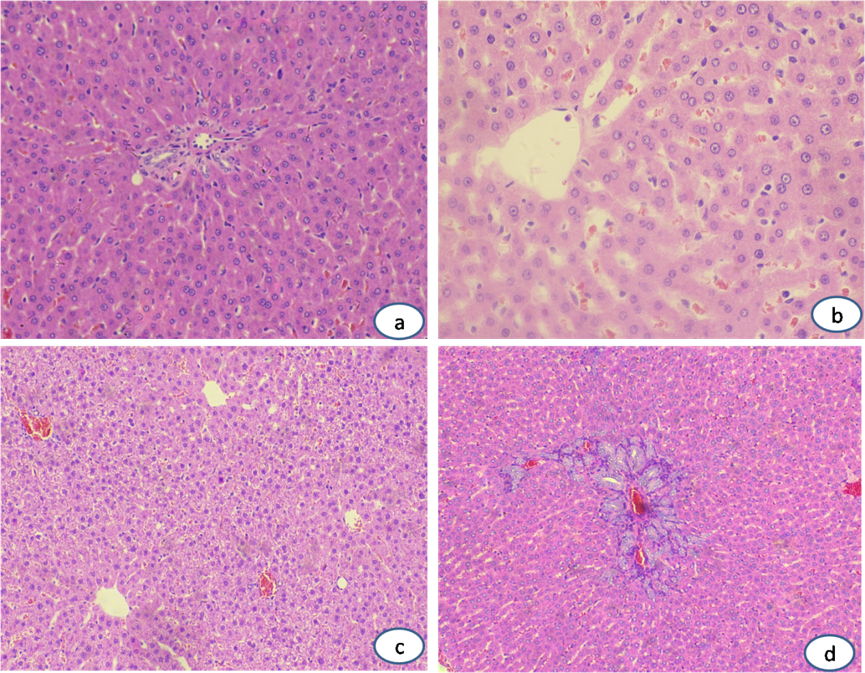
This study was approved by local Medical Ethics Committee. Thirty Sprague-Dawley (SD) rats’ right hepatic lobes were irradiated by linear accelerator with the single dose of 20 Gy. All rats were divided into three groups randomly and underwent T1WI, T2WI and IVIM-MRI scans on a 1.5T MRI scanner (Signa EXCITE HDxT, GE Medical System, Milwaukee, WI). Scan parameters for these sequences are as follows: Fast spin echo T1W, TR=420ms, TE=10.6ms, Bandwidth(BW)=20.8kHz, Field of view (FOV)=8x8cm, Number of Excitations (NEX)=2, acquisition matrix=256x192, slice thickness / gap=3.0/0.5mm; Fast spin echo T2W with fat saturation, TR=2640ms, TE=63.9ms, BW=20.8kHz, FOV=8x8cm, NEX=2, acquisition matrix=256x192, slice thickness / gap = 3.0/0.5mm; Single-shot diffusion-weighted echo-plannar imaging with 9 b-values (0, 5, 10, 20, 50, 100, 200, 400, 800 s/mm2), TR=4000ms, TE=91.3ms, BW=125kHz, FOV=10x5cm, NEX=2, acquisition matrix=96x128, slice thickness / gap=3.0/0.5mm. MRI exams were performed before and 1 month, 2 month, 3 month after irradiation treatment. ADC was calculated with mono-exponential model, D, D* and f were obtained by fitting diffusion-weighted signals at all b-values into IVIM bi-exponential model. Finally rats of each group were sacrificed at 1, 2 and 3 month timepoints, respectively. Pathological samples were stained with hematoxylin eosin (HE) and masson trichrome (MT), and the stages of liver fibrosis were then identified (F0, F1 and F2).
Results
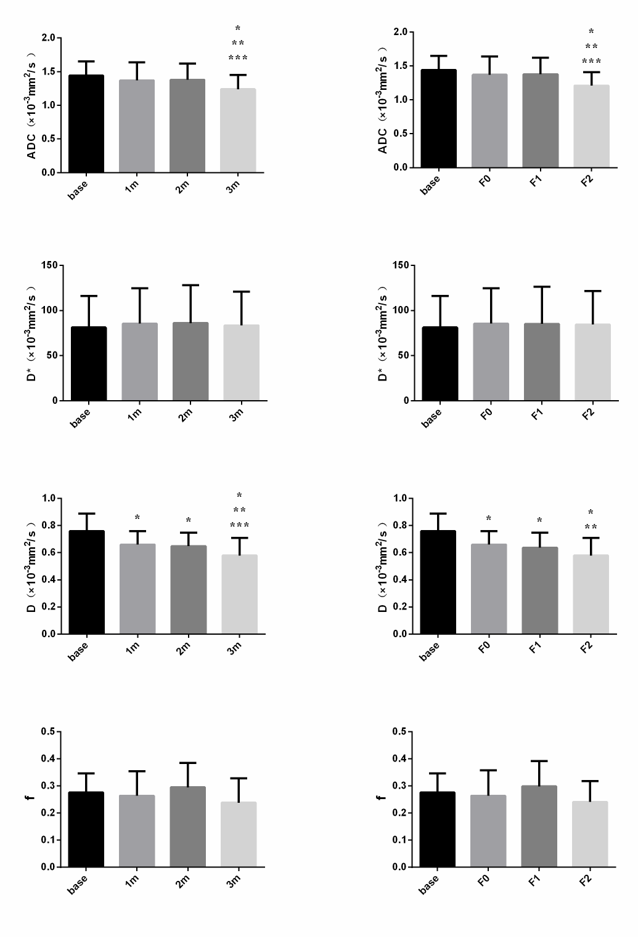
7 rats died during this research, and finally number of rats remained at 1, 2 and 3 month timepoints were 8, 8 and 7. According to pathological results, number of rats with right hepatic lobes identified as F0, F1 and F2 degree were 8, 10 and 5 respectively, and no abnormality was found at the left hepatic lobes of all samples. The ADC and D showed significant difference among different time points and different fibrosis stages (P<0.05), and D was significantly different between base line and 1m/2m group (P=0.002/0.001), as well as the F0/F1 group (P=0.002/0.001). ADC and D exhibited significant negative correlations with post-irradiation time (r=-0.303/-0.436, P=0.001/0.001) and fibrosis staging (r=-0.312/-0.424, P=0.001/0.001).Conclusion
Both ADC and IVIM-derived D have the ability to identify the early fibrosis stage in liver. Furthermore D presented a better performance than ADC. This indicated that IVIM-MRI is a feasible method to assess the early stage of hepatic fibrosis in vivo.Acknowledgements
No acknowledgement found.References
No reference found.Figures