Qian Ji1, Zhi-qiang Chu2, Pan-li Zuo3, and Wen Shen1
1Radiology, Tianjin First Central Hospital, Tianjin, People's Republic of China, 2Transplantation, Tianjin First Central Hospital, Tianjin, People's Republic of China, 3MR Collaborations NE Asia, Siemens Healthcare, Beijing, People's Republic of China
Synopsis
Hepatic
warm ischemia-reperfusion injury (WIRI) is clinically relevant in liver operation.
We undertook this study to determine the feasibility of using IVIM for the early diagnosing and
grading of hepatic WIRI. Fifty different
grades of hepatic WIRI models and control rabbits were examined using a 3T
clinical MR scanner, which followed by biochemical and histopathological
analysis. There were significant differences of IVIM parameters between different
groups. IVIM parameters corresponded well with biochemical parameters. ROC
analysis showed the AUC of PF was the largest. This indicated that IVIM is a noninvasive and valuable technique for
assessing and grading of hepatic WIRI.
Introduction/Purpose
Hepatic warm ischemia-reperfusion injury (WIRI) is the most common cause of postoperative liver dysfunction, graft rejection, and chronic liver diseases1. Intravoxel incoherent motion (IVIM) MRI has been successfully applied to assess the hepatic WIRI, but the results are controversial2,3. Being different from the previous studies, the purpose of this study was to evaluate the hepatic WIRI in a dynamic, time-dependent way, and to investigate the diagnostic efficacy of IVIM in the grade of hepatic WIRI in rabbit models.
Method
The protocols and procedures were approved by the local Animal Experimentation Ethics Committee. Hepatic WIRI was induced in rabbit by occluding hepatic inflow for 30 minutes and reperfusion for 6 hours. Fifty rabbits were randomly divided into sham-operation group (n=10) and four test groups (n=10 for each group) according to different hepatic warm ischemia time. IVIM was performed on MAGNETOM Trio Tim 3T MR scanner (Siemens, Erlangen, Germany). Transversal IVIM imaging was acquired using a single-shot echo-planar imaging (ss-EPI) prototype sequence with TE/TR of 57.2/1000 ms, and 11 b values of 0, 20, 40, 60, 80, 100, 150, 200, 400, 600, and 800 s/mm2 on 3 gradient directions. To separate the perfusion and diffusion, a bi-exponential fit was used to calculate the perfusion fraction (PF), Dfast and Dslow4. Rabbits were sacrificed after MR imaging for biochemical analysis, including alanine transaminase (ALT), aspartate transaminase (AST), lactate dehydrogenase (LDH), malondialdehyde (MDA), myeloperoxidase (MPO) and superoxide dismutase (SOD), and histomorphology. IVIM-derived parameters, including ADC, Dfast, Dslow and PF, were compared between the five groups, and the correlations analysis and receiver operating characteristic (ROC) curves were used to determine diagnostic efficacies.
Results
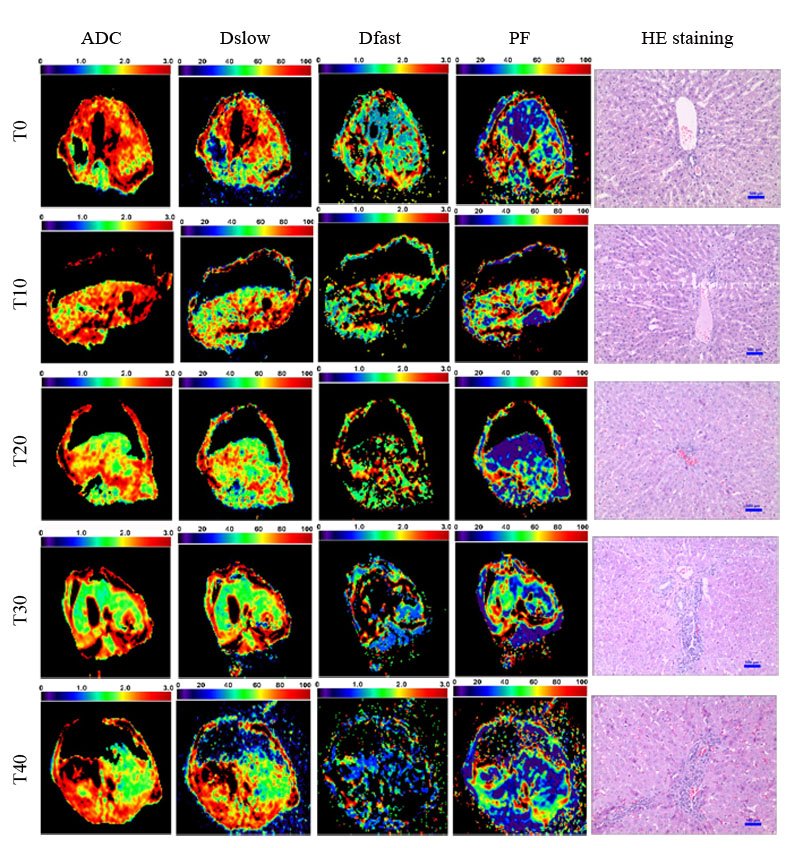
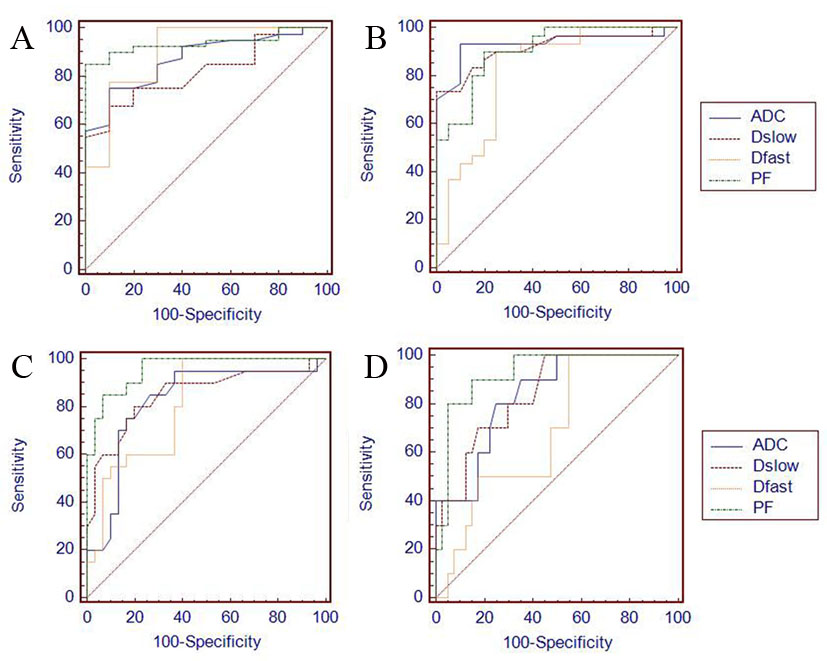
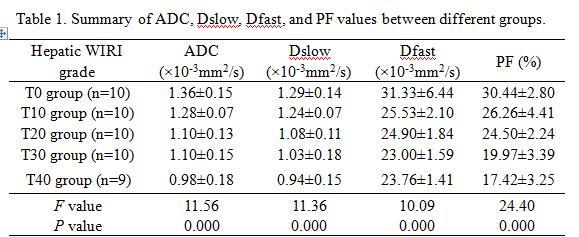
Fig.1 shows image examples of ADC, Dslow, Dfast, PF and HE staining maps in a control rabbit and hepatic WIRI model rabbits with different grades. The statistical analysis is shown in Table 1. ADC, Dslow, Dfast, and PF showed moderate to excellent interobserver reproducibility. Significant differences were found between different grades of hepatic WIRI by ADC, Dslow, Dfast, and PF (P <0.001). IVIM parameters corresponded well with biochemical parameters (P <0.01). ROC analysis showed that the differences in ADC, Dslow, Dfast, and PF among different grades of hepatic WIRI were significant (P <0.05), and the area under the ROC curve (AUC) of PF was the largest (Fig. 2). Histopathological analysis showed with the prolonged warm ischemia time, the degree of hepatocyte edema, mesenchymal inflammatory cell infiltration and sinusoids congestion aggravated, local hepatic lobule structure disappeared, partial liver cells appeared fatty degeneration, eosinophilic degeneration and focal necrosis, fibrous tissue hyperplasia gradually appeared until fibrosis (Fig. 1).
Discussion
Hepatic WIRI cause severe ischemia and anoxia, oxidation/antioxidation imbalance, and excessive inflammatory response5, which result in liver microcirculatory disorders and histological damage. Our study expands the scope of previous work on IVIM in hepatic WIRI evolution by using a dynamic and time-dependent study. This study demonstrated that the reliability and sensitivity of IVIM-derived parameters for early diagnosis and grade of hepatic WIRI, and that PF is more sensitive indicator than other parameters.
Conclusion
IVIM MRI is a noninvasive, valuable,
and sensitive technique in early diagnosing and grading of hepatic WIRI in a rabbit
model, with the PF being the most reliable parameter.
Acknowledgements
Project
supported by the National Natural Science Foundation of China (Grant No
81301197). References
1. Hirao H, Uchida Y, Kadono K, et al. The protective function of galectin-9 in
liver ischemia and reperfusion injury in mice. Liver Transpl.2015;21:969-981.
2. Cheung JS, Fan SJ, Chow AM, et
al. In vivo DTI assessment of hepatic ischemia reperfusion injury in an
experimental rat model. J Magn Reson Imaging. 2009;
30: 890-895.
3. Ye W, Li J, Guo C, et
al. Can intravoxel incoherent motion diffusion-weighted imaging characterize
the cellular injury and microcirculation alteration in hepatic
ischemia-reperfusion injury? An animal study.J Magn Reson Imaging. 2016;
43: 1327-1336.
4. Le Bihan D, Turner R, MacFall JR. Effects of intravoxel incoherent
motions (IVIM) in steady-state free precession (SSFP) imaging: application to
molecular diffusion imaging. Magn Reson
Med. 1989; 10: 324–337.
5. Wang C, Chen K, Xia Y, et al.
N-acetylcysteine attenuates ischemia-reperfusion-induced apoptosis and autophagy in mouse liver via regulationof
the ROS/JNK/Bcl-2 pathway.PLoS One.2014;9: e108855.