3170
Free-breathing 3D Body Diffusion Imaging at 3T Using M1-compensated Diffusion Preparation and Stack-of-Stars Readout1Siemens Healthcare, Los Angeles, CA, United States, 2Cedars-Sinai Medical Center, Los Angeles, CA, United States
Synopsis
Diffusion-weighted (DW) MRI enables qualitative and quantitative assessment of tissue diffusivity. Body diffusion imaging at 3T using conventional single-shot EPI sequence is challenged by respiratory and cardiac motions of subject, limited spatial resolution, and image distortion and ghosting. In this work, a new 3D imaging technique incorporating M1-compensated diffusion preparation and motion-robust stack-of-stars data acquisition was developed. Preliminary volunteer studies demonstrated its feasibility for free-breathing body diffusion imaging at 3T. From one patient underwent MR-PET scan, reduced ADC and increased FDG uptake was observed in the same focal lesion.
Introduction
Diffusion-weighted (DW) MRI enables qualitative and quantitative assessment of tissue diffusivity without the use of contrast agent. While such method has gained great success in the brain, DW MRI remains challenging in the body (e.g., liver imaging) particularly at 3T and higher field strength. Diffusion-sensitizing gradients can lead to substantial signal loss in the targeted organ due to body motions (e.g., breathing, heart beating) beyond diffusion. Meanwhile, the conventional single-shot EPI diffusion sequence is challenged by limited spatial resolution, increased image distortion and ghosting artifacts at high field strength. Previous work demonstrated that a first-order moment (M1) nullified gradient module significantly increases the tolerance of diffusion preparation to cardiac and respiratory motions [1]. Furthermore, stack-of-stars sampling scheme was shown to be a motion robust method and was successfully utilized for free-breathing body imaging [2]. In this work, we developed a motion robust diffusion sequence incorporating an M1-compensated diffusion preparation module and stack-of-stars data acquisition. The feasibility of using this sequence for free-breathing 3D diffusion imaging was tested at 3T.Methods
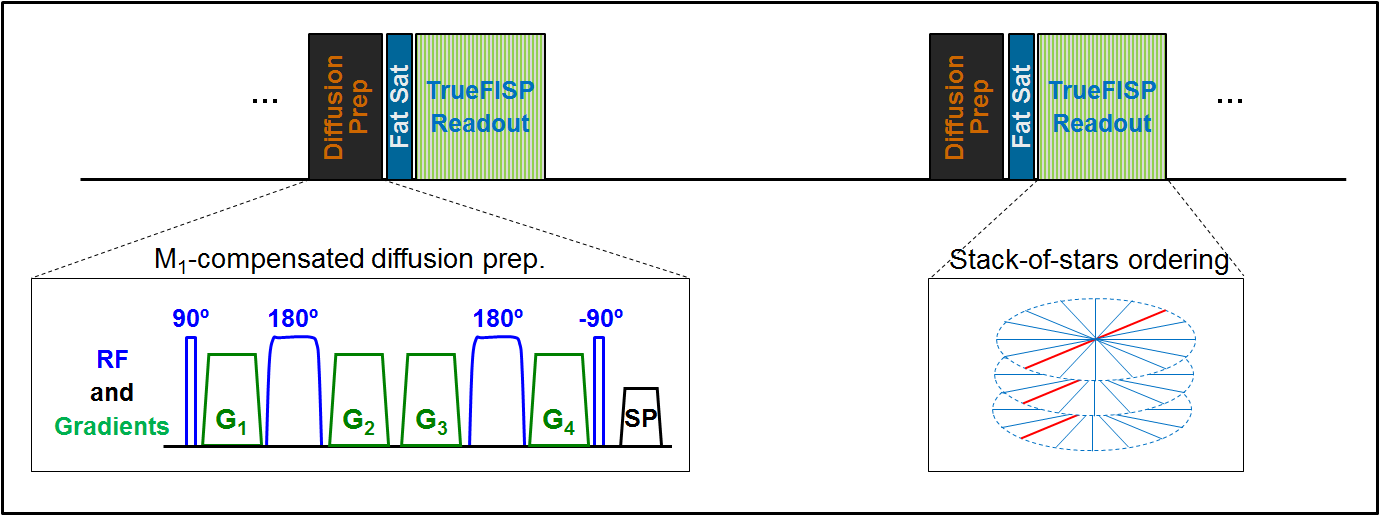
Fig. 1 shows the schematic of the prototype 3D diffusion sequence. Diffusion preparation and data acquisition were decoupled into independent modules - diffusion contrast was generated by adding diffusion-sensitizing gradients to a T2-preparation module encompassing hard pulse excitation and adiabatic pulse refocusing [3]. The amplitude, duration and polarity of gradients can be adjusted to set the b value, T2prep time, and selectively nulling the zeroth-order moment (M0) and/or M1. Such diffusion/T2 preparation module was immediately followed by fat saturation and data readout. Five healthy volunteers (34.4 ± 3.4 yrd, 4 males) were scanned on 3T clinical scanners (MAGNETOM Verio and Prisma, Siemens Healthcare, Germany). One patient (35-year-old female) scheduled for a complex ovarian cyst evaluation on a MR-PET scanner (Biograph mMR, Siemens Healthcare, Germany) was also enrolled. For each subject, T2-weighted (T2W) images (T2prep = 72 ms, b = 0 s/mm2) and M1-compensated DW images (T2prep = 72 ms, b = 500 s/mm2) were acquired under free-breathing. For comparison, additional M0-compensated DW images were collected from two volunteers. Stack-of-stars k-space ordering was used in all measurements. Following each diffusion/T2 preparation module, same radial view was acquired for all partitions with centric order in the partition-encoding direction [4]. Such magnetization preparation and readout train were repeatedly applied (repetition time 1s) with increased Azimuthal angle until all prescribed radial views were sampled. Other imaging parameters include: FOV = 300 mm; 44 partitions; 264 projections; 2.1x2.1x2.0 mm3 voxel size. TrueFISP readout with 6 Kaiser-Bessel ramp-ups; FA = 45°; TR/TE = 3.4/1.7 ms; diffusion gradients (29.7 mT/m; 6.5/12 ms for M0/M1-compensation) for b = 500 s/mm2) were simultaneously applied on all three axis. Apparent diffusion coefficient (ADC) map was calculated offline using in-house developed MATLAB scripts.Results
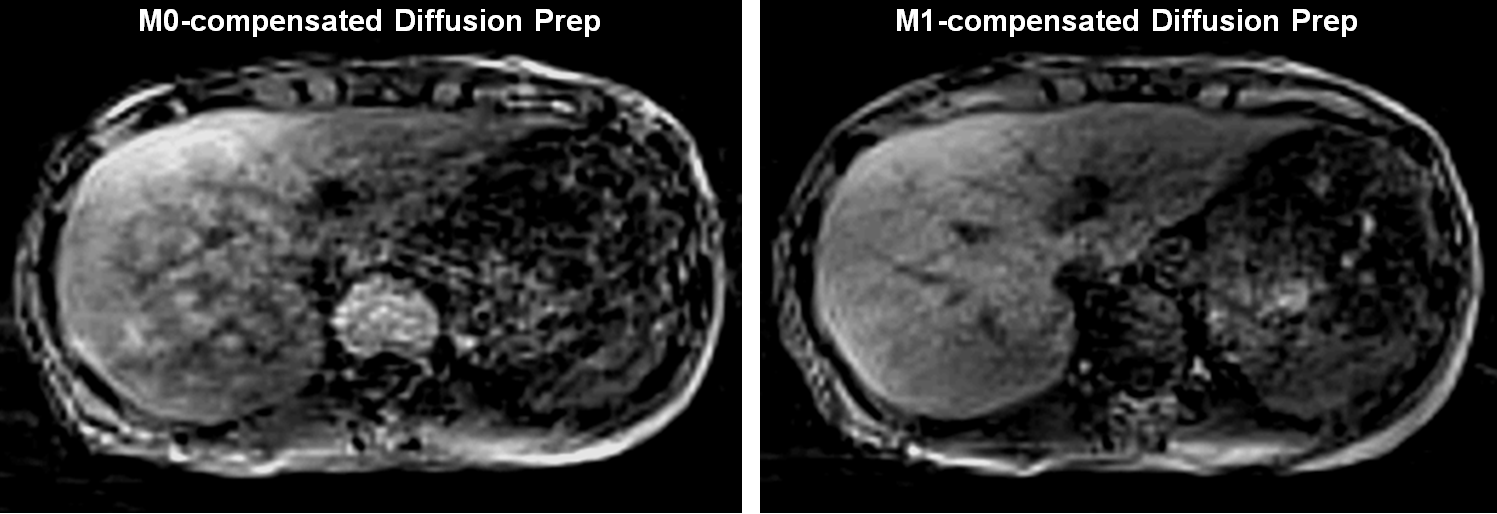
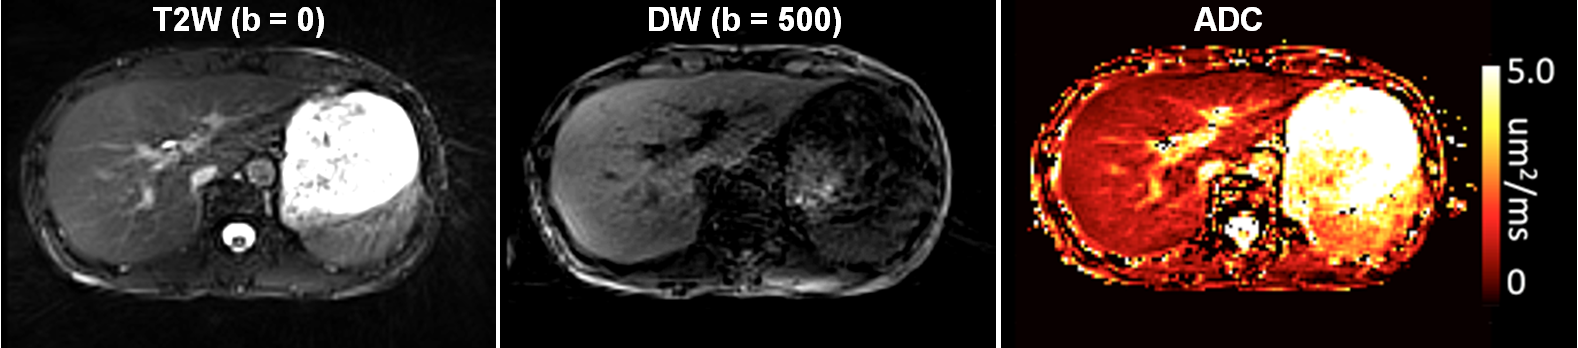
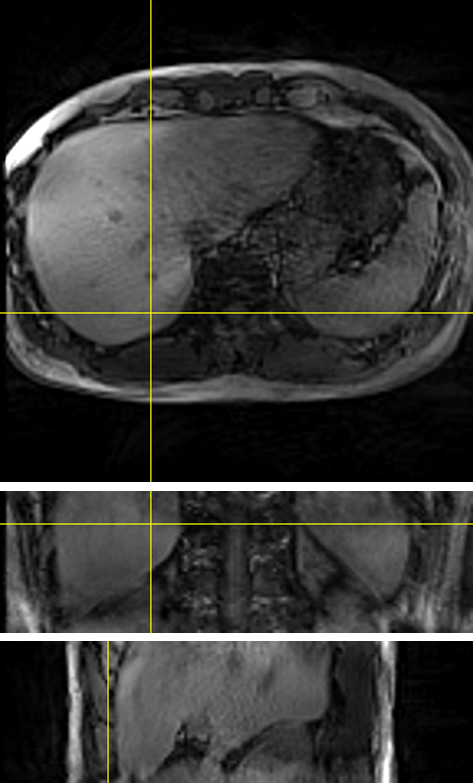
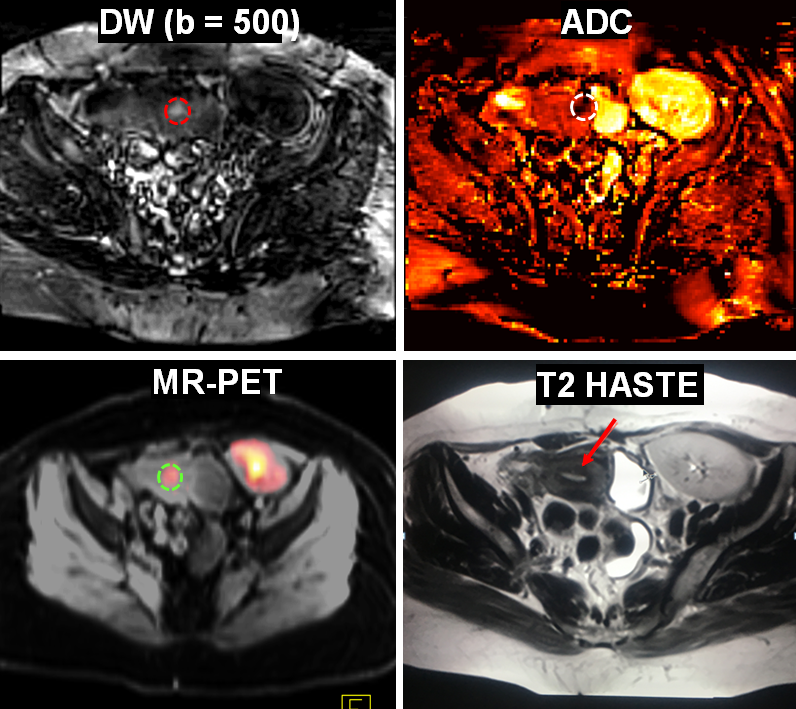
T2W and DW images were successfully acquired from all subjects. The total imaging time for acquiring T2W and DW image sets was close to 9 minutes (4’24” x 2). Fig. 2 shows representative DW images acquired with M0- and M1-compensated diffusion preparation. The delineation of liver is substantially improved with M1 compensation despite longer T2prep time (M1 vs M0 compensation: 72 vs 50 ms). T2W image, M1-compensated DW image and corresponding ADC map of one selected partition are illustrated in Fig. 3. Tissue boundaries in both T2W and DW images were well delineated although images were acquired under free-breathing. ADC map was homogeneous in the entire liver (mean ADC = 1.1 ± 0.2 µm2/ms). Fig. 4 shows exemplary M1-compensated DW images in three orthogonal views reconstructed from such isotropic, volumetric dataset. From the patient study, elevated focal signal was detected in the uterus (Fig. 5). This was correlated with markedly decreased ADC value (lesion vs surrounding tissue: 0.5 vs 1.5 µm2/ms). PET images simultaneously acquired with MR acquisition delineated increased FDG uptake in the same region.Discussion
Preliminary volunteer studies demonstrate that the proposed diffusion sequence has good tolerance to respiratory motion, thanks to the M1-compensated diffusion preparation and stack-of-stars data acquisition. The capability of imaging under free-breathing enables isotropic, volumetric T2W and DW measurements. Although motion correction can be readily performed between T2W- (b=0) and DW-weighted image sets for the ADC calculation, this was not needed in our preliminary tests with all images acquired under the same breathing pattern. Such free-breathing, 3D method has the potential of improving image quality and success rate of diffusion imaging in the body.Conclusion
A new 3D imaging technique incorporating M1-compensated diffusion preparation and stack-of-stars readout was developed. Preliminary volunteer studies demonstrated that such technique is feasible for free-breathing body diffusion imaging at 3T.Acknowledgements
No acknowledgement found.References
[1] Nguyen C et al, MRM 2014, p1275. [2] Chandarana H et al, Invest Radiol. 2013, p10. [3] Jenista ER et al, MRM 2013, p1360. [4] Bi X et al, ISMRM 2014, p555
Figures