3169
Intravoxel Incoherent Motion Analysis for Perfusion Using Portal Vein Embolization Pig Model1Center for Biomedical Imaging Research, Department of Biomedical Engineering, School of Medicine, Tsinghua University, Beijing, People's Republic of China, 2Clinic for Radiology and Nuclear Medicine, Basel University Hospital, Basel, Switzerland, 3Department of Radiology, University of Wisconsin-Madison, Madison, WI, United States, 4Department of Radiology, University of Washington, Seattle, WA, United States, 5Department of Medical Physics, University of Wisconsin-Madison, Madison, WI, United States, 6Department of Biomedical Engineering, University of Wisconsin-Madison, Madison, WI, United States, 7Department of Medicine, University of Wisconsin-Madison, Madison, WI, United States, 8Department of Emergency Medicine, University of Wisconsin-Madison, Madison, WI, United States
Synopsis
Portal vein embolization (PVE) is often performed before liver tumor resection, to induce hypertrophy of the anticipated liver remnant and reduce the complications after partial liver resection. The perfusion changes of the embolized and non-embolized liver segments are of great interest. Intravoxel incoherent motion (IVIM) is a component of the diffusion weighted signal model that allows for separating estimation of perfusion. Estimation of IVIM from diffusion weighted imaging which may provide a unique way to measure the perfusion of liver tissue. This study aimed to test the intra-observer repeatability of IVIM and parameters change after PVE used a pig model.
INTRODUCTION
Portal vein embolization (PVE) is often performed in patients scheduled for liver tumor resection, to induce hypertrophy of the anticipated liver remnant and reduce the complications after partial liver resection (1,2). The perfusion changes of the embolized and non-embolized liver segments are of great interest, as this may predict PVE success with regard to liver remnant growth. Intravoxel incoherent motion (IVIM) is a component of the diffusion weighted signal model that allows for separating estimation of perfusion. Estimation of IVIM from diffusion weighted imaging which may provide a unique way to measure the perfusion of liver tissue (3). Thus, this study used IVIM on a PVE pig model to test the intra-observer repeatability of IVIM and IVIM parameters change after PVE.METHODS
In-vivo experiment and MR imaging
This study was approved by our institutional animal care and use committee (IACUC). Five pigs were included and underwent catheter based PVE of the left branch of portal vein. Four MRI exams were performed on each pig using a clinical 3T MRI system (GE Healthcare, Waukesha, WI) before, immediately after, one week, and two weeks after PVE. IVIM imaging was included in the MRI protocol using a pencil-beam navigated free-breathing diffusion-weighted spin-echo echo-planar imaging (SE-EPI) sequence with the following acquisition parameters: TE= 50 ms, axial, in-plane resolution = 1.54 mm, slice thickness = 6 mm, NSA = 4 and 11 b values (0, 10, 20, 30, 40, 50, 100, 150, 200, 400, 800 sec/mm²). Images analysis
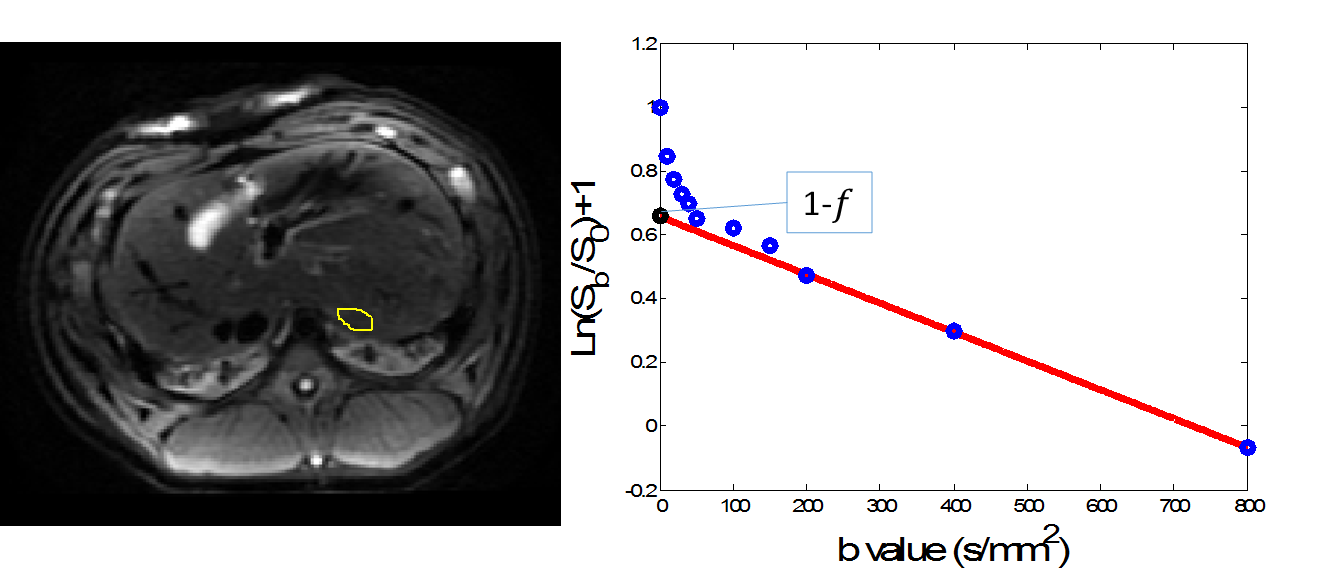
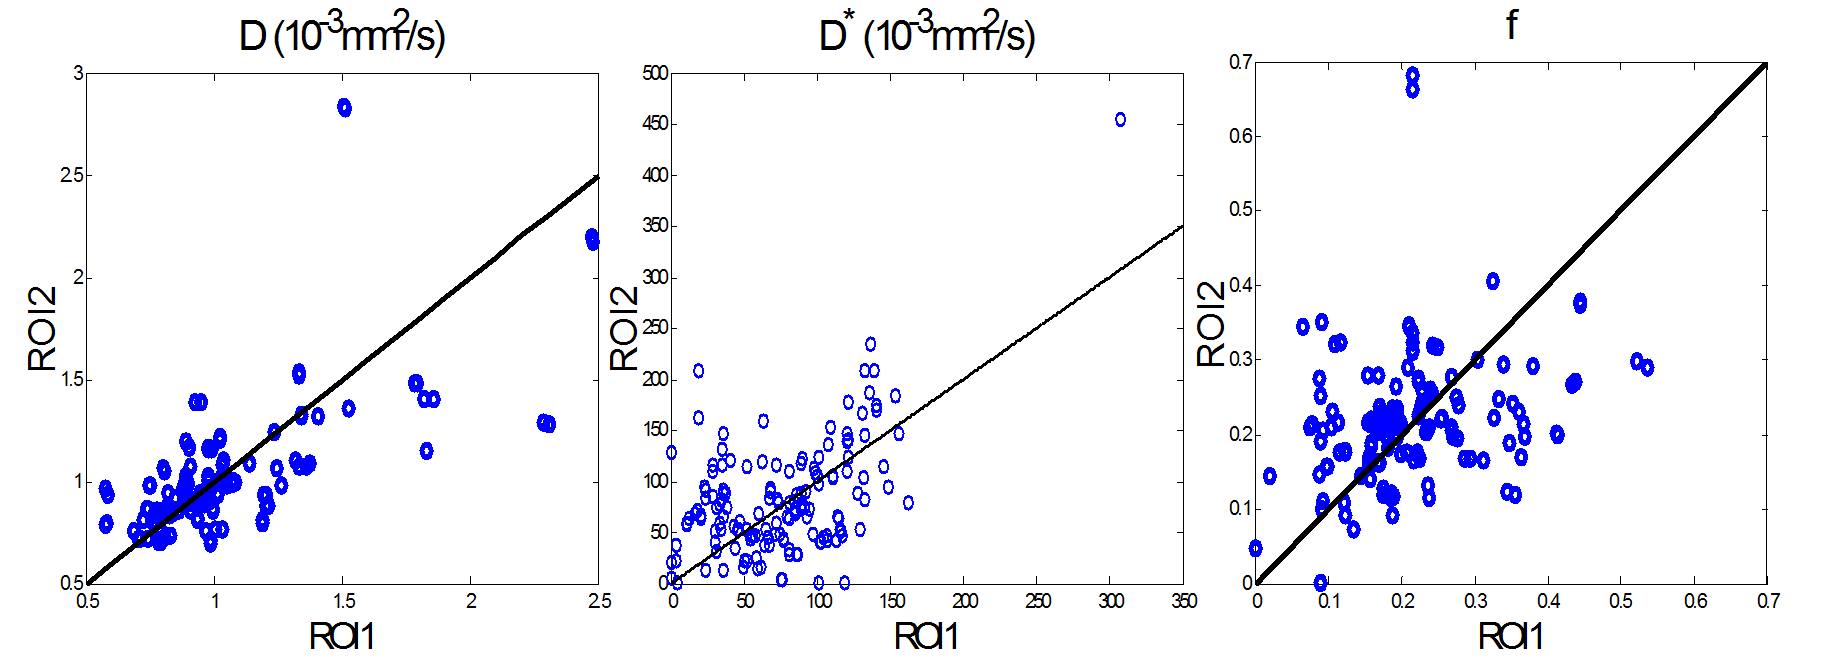
The bi-exponential IVIM model $$$\frac{{{S_b}}}{{{S_0}}} = \left( {1 - f} \right){e^{ - bD}} + f{e^{ - b\left( {D + {D^*}} \right)}}$$$ was employed where $$${{\rm{S}}_b}$$$ represents the signal intensity for each b value, $$$f$$$ the fraction of signal from the microcirculation, and $$$D$$$ and $$${D^*}$$$ ( $$${10^{ - 3}}m{m^2}/sec$$$ ) represent the diffusion from the pure molecular and microcirculation, respectively. Since pure molecular diffusion dominates at high b values, was fitted using only b value greater than 200 s/mm² using $$$\frac{{{S_b}}}{{{S_0}}} = {e^{ - bD}}$$$ at first (4). A geometry-based algorithm was used to approximate the value of $$$f$$$ (5) as initial value. Then, the least square fitting was used with this initial value to acquire the final results. To investigate the reproducibility of model parameter fitting, one reviewer drew regions of interest (ROIs) on the right and left lobes twice in a blinded and and independent manner. Intra-class correlation coefficient (ICC) was employed to evaluate the intra-observer reproducibility. The fitting results of two ROI selections were averaged and compared among different visits. One-way ANOVA was employed to see the difference among all the visits. Student’s t-test was employed to compare the differences between each pair of visits.
RESULTS
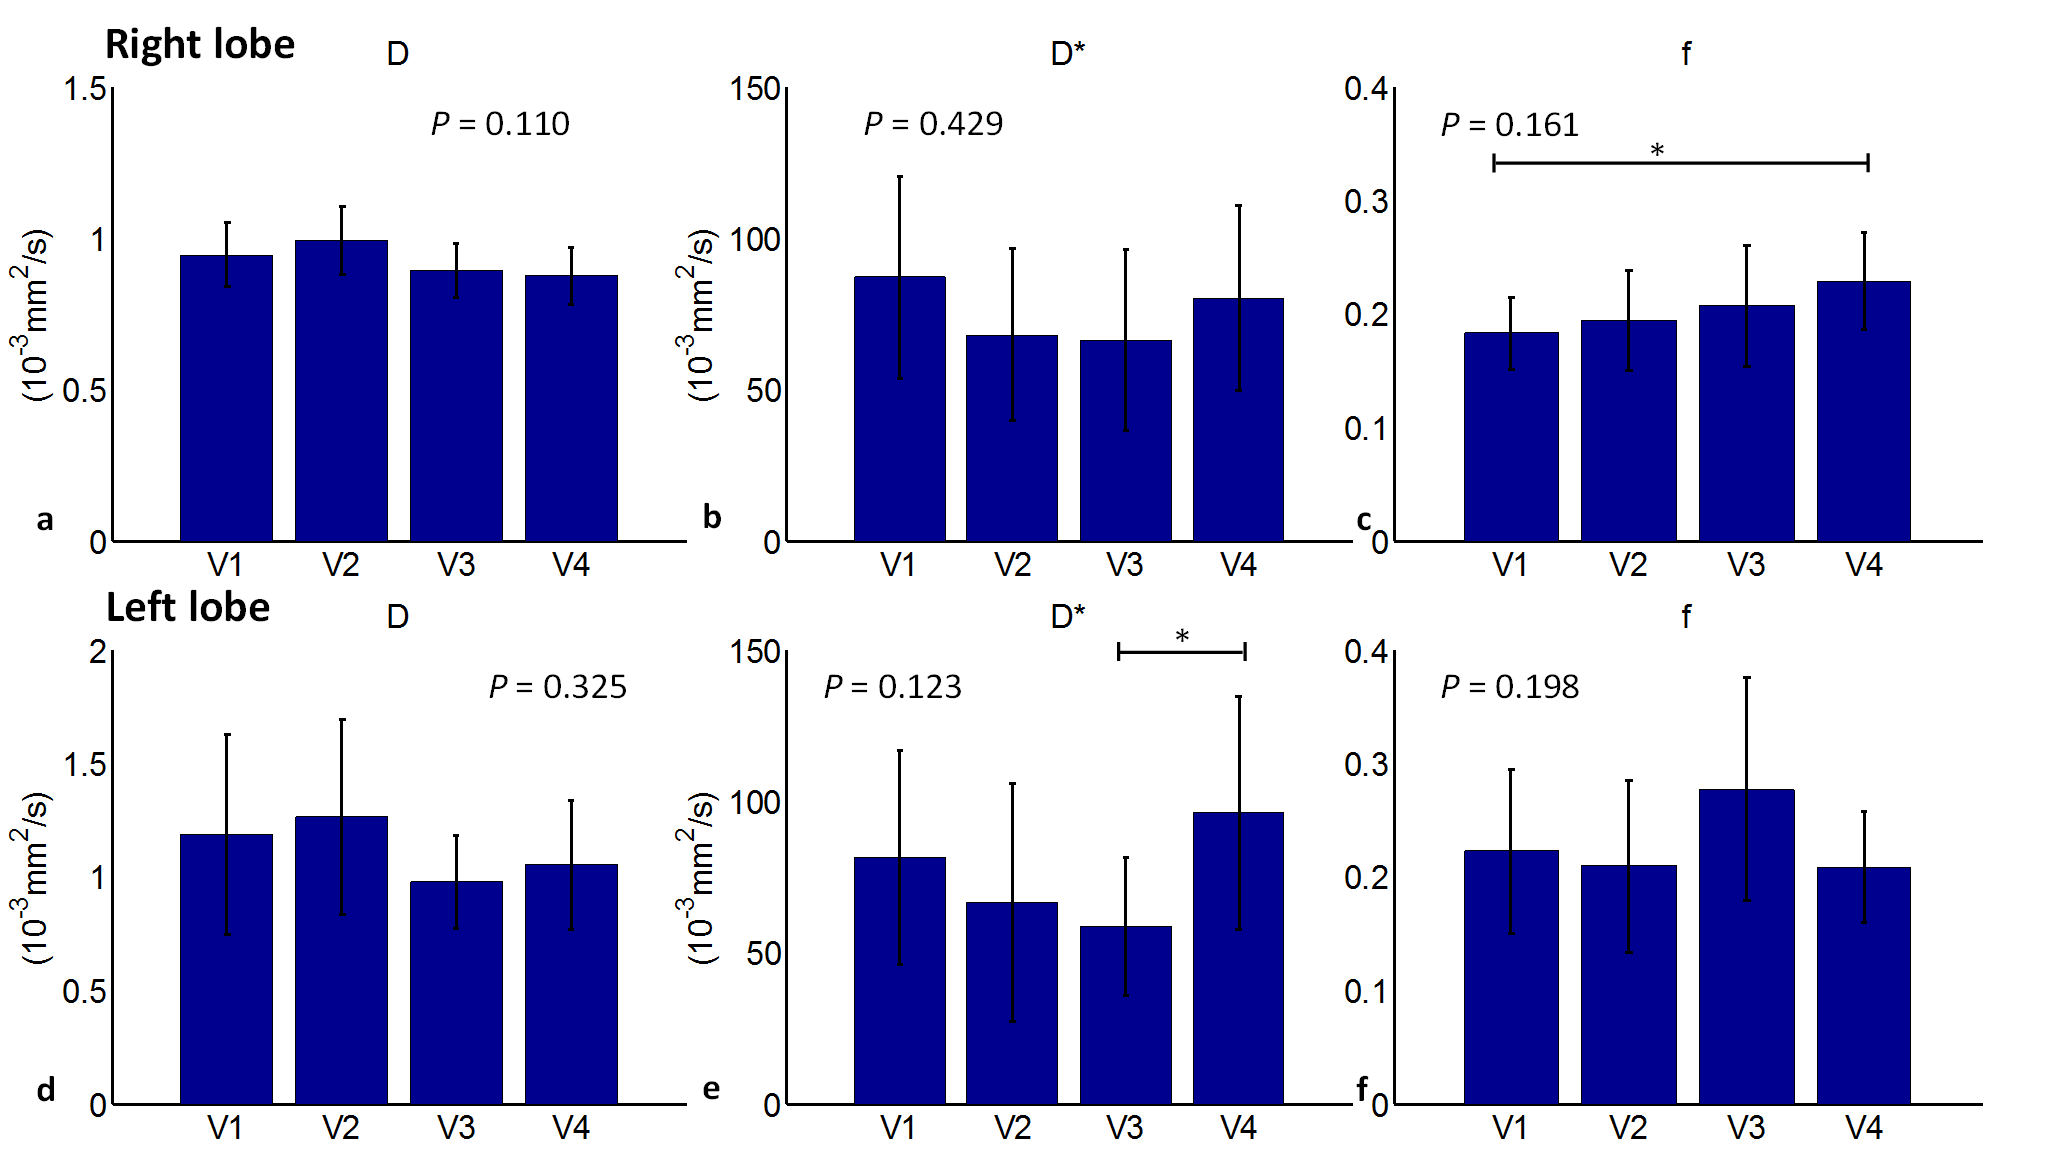
An example image of a b value = 100 and the corresponding ROI is shown in Figure 1(a), as well as the corresponding decay curve and the geometry estimated initial $$$f$$$ point was shown in Figure 1(b). Figure 2 showed the scatter plots between two independent ROI selections, The ICC for $$$D$$$, $$${D^*}$$$ and $$$f$$$ were 0.80, 0.68 and 0.42. Figure 3 showed the comparisons of IVIM parameters among different visits of right and left lobes. Although no significant difference was found using one-way ANOVA, a decrease of $$${D^*}$$$ after the surgery was observed in both the right and left lobes from 1st to 3rd visit. However, $$${D^*}$$$ was significantly increased (P = 0.021) in the last visit in left lobe, while in the right lobe this increase was only a trend. With regard to $$$f$$$, a trend of the gradual increase after the surgery was observed in the right lobe with values at the 4th visit being significant higher than at the 1st visit (P = 0.019). In left lobe, $$$f$$$ showed a decrease right after PVE, but slightly increased at the 3rd visit and then again decreased to a near baseline level. $$$D$$$ of both lobes showed a decreasing trend at the 3rd and 4th visit compared with 1st and 2nd visit.DISCUSSION AND CONCLUSION
This study evaluated IVIM parameters and their intra-observer repeatability after PVE. The results showed good intra-observer reproducibility of $$$D$$$, likely related to the use a single-exponential model. $$${D^*}$$$ and $$$f$$$have moderate intra-observer variability, which may be related to the complex bi-exponential fitting (6). The decrease of $$${D^*}$$$ indicates that perfusion is reduced (4) immediately after PVE (2nd and 3rd visit). The increase of $$${D^*}$$$ after 2 weeks demonstrates the recovery of liver perfusion. The increase of $$$f$$$ at the 3rd visit in the embolized lobe further suggests an increase in capillary volume at one week, but seems to decrease after two weeks. The consistent increase of $$$f$$$ in the non-embolized lobe indicates the compensatory increase of the capillary network. In conclusion, this study proved the feasibility of IVIM in liver perfusion quantification. Future work will validate the perfusion changes with a larger sample size.Acknowledgements
No acknowledgement found.References
1. Ribero D, Abdalla EK, Madoff DC, Donadon M, Loyer EM, Vauthey JN. Portal vein embolization before major hepatectomy and its effects on regeneration, resectability and outcome. British Journal of Surgery. 2007;94(11):1386-94.
2. Abdalla EK, Hicks ME, Vauthey JN. Portal vein embolization: rationale, technique and future prospects. British Journal of Surgery. 2001;88(2):165-75.
3. Le Bihan D, Breton E, Lallemand D, Aubin ML, Vignaud J, Laval-Jeantet M. Separation of diffusion and perfusion in intravoxel incoherent motion MR imaging. Radiology. 1988;168(2):497-505.
4. Luciani A, Vignaud A, Cavet M, et al. Liver Cirrhosis: Intravoxel Incoherent Motion MR Imaging—Pilot Study. Radiology. 2008;249(3):891-9.
5. Sasaki M, Sumi M, Eida S, Katayama I, Hotokezaka Y, Nakamura T. Simple and Reliable Determination of Intravoxel Incoherent Motion Parameters for the Differential Diagnosis of Head and Neck Tumors. PLoS ONE. 2014;9(11):e112866.
6. Shih-Han H, Meng-Chieh L, Cheng-Ping C, Wen-Chau W, Hsiao-Wen C. Liver IVIM MR imaging: improved reproducibility of pseudo-diffusion coefficient D* via proper signal modeling. ISMRM2016; p. 2947.
Figures