3166
Focus or Spread? An Investigation of the Effects of b-Value Acquisition Strategies on the Stability and Bias of Prostate Diffusion Imaging Results1MR R&D Collaborations, Siemens Healthcare, Atlanta, GA, United States, 2Department of Radiology and Imaging Sciences, Emory University, Atlanta, GA, United States, 3Department of Radiology, Mayo Clinic, Rochester, MN, United States, 4MR R&D Collaborations, Siemens Healthcare, Rochester, MN, United States, 5MR R&D Collaborations, Siemens Healthcare, Cary, NC, United States
Synopsis
In order to investigate the effects of b-value acquisition strategies on the stability and bias of the prostate DWI results, including calculated b-value images and ADC, a framework was developed. Using the DWI data from 8 prostate patients, this study revealed that acquiring many averages at a few b-values increases bias compared to acquiring few averages at many b-values, particularly when large numbers of averages have been removed. The framework and strategies proposed in this work may provide a useful tool to design b-value acquisition protocols to achieve the stability of prostate DWI results in clinic.
INTRODUCTION
Prostate cancer is the leading malignancy in males.1 Prostate diffusion weighted imaging (DWI) has been utilized for prostate cancer assessment.2-5 High b-value images are very important, but often suffer from low SNR. Multiple averages can be performed to compensate this, at the cost of scan time. Alternatively, high b-value images can be calculated after apparent diffusion coefficient (ADC) is calculated. Given a certain scan time, the best strategies to determine b-values and averages to achieve comparable results compared to an ideally long scan are not clear. Different strategies also influence the stability of ADC.
The purpose of this work was to develop a framework to explore this topic, and apply it in vivo to investigate the effects of b-value acquisition strategies on the stability and bias of the prostate DWI results, including calculated b-value images and ADC.
METHOD
A routine clinically-indicated multi-slice spin-echo (SE) echo planar imaging (EPI) diffusion sequence was performed on 8 clinical patients on a 3T scanner (Skyra, Siemens, Erlangen, Germany) using an 18-channel body array and a 32-channel spine array (both Siemens coils). Parameters included TR = 3500 ms, TE = 88 ms, pixel-size = 0.94×0.94 mm2, slices = 16, slice thickness = 4 mm, GRAPPA×2, b-value = 50/100/400/600/800/1200 s/mm2 with repetitions of 2/4/4/7/13/13, directions = 3, acquisition time = 464 s. Anonymized raw data was saved for offline processing.
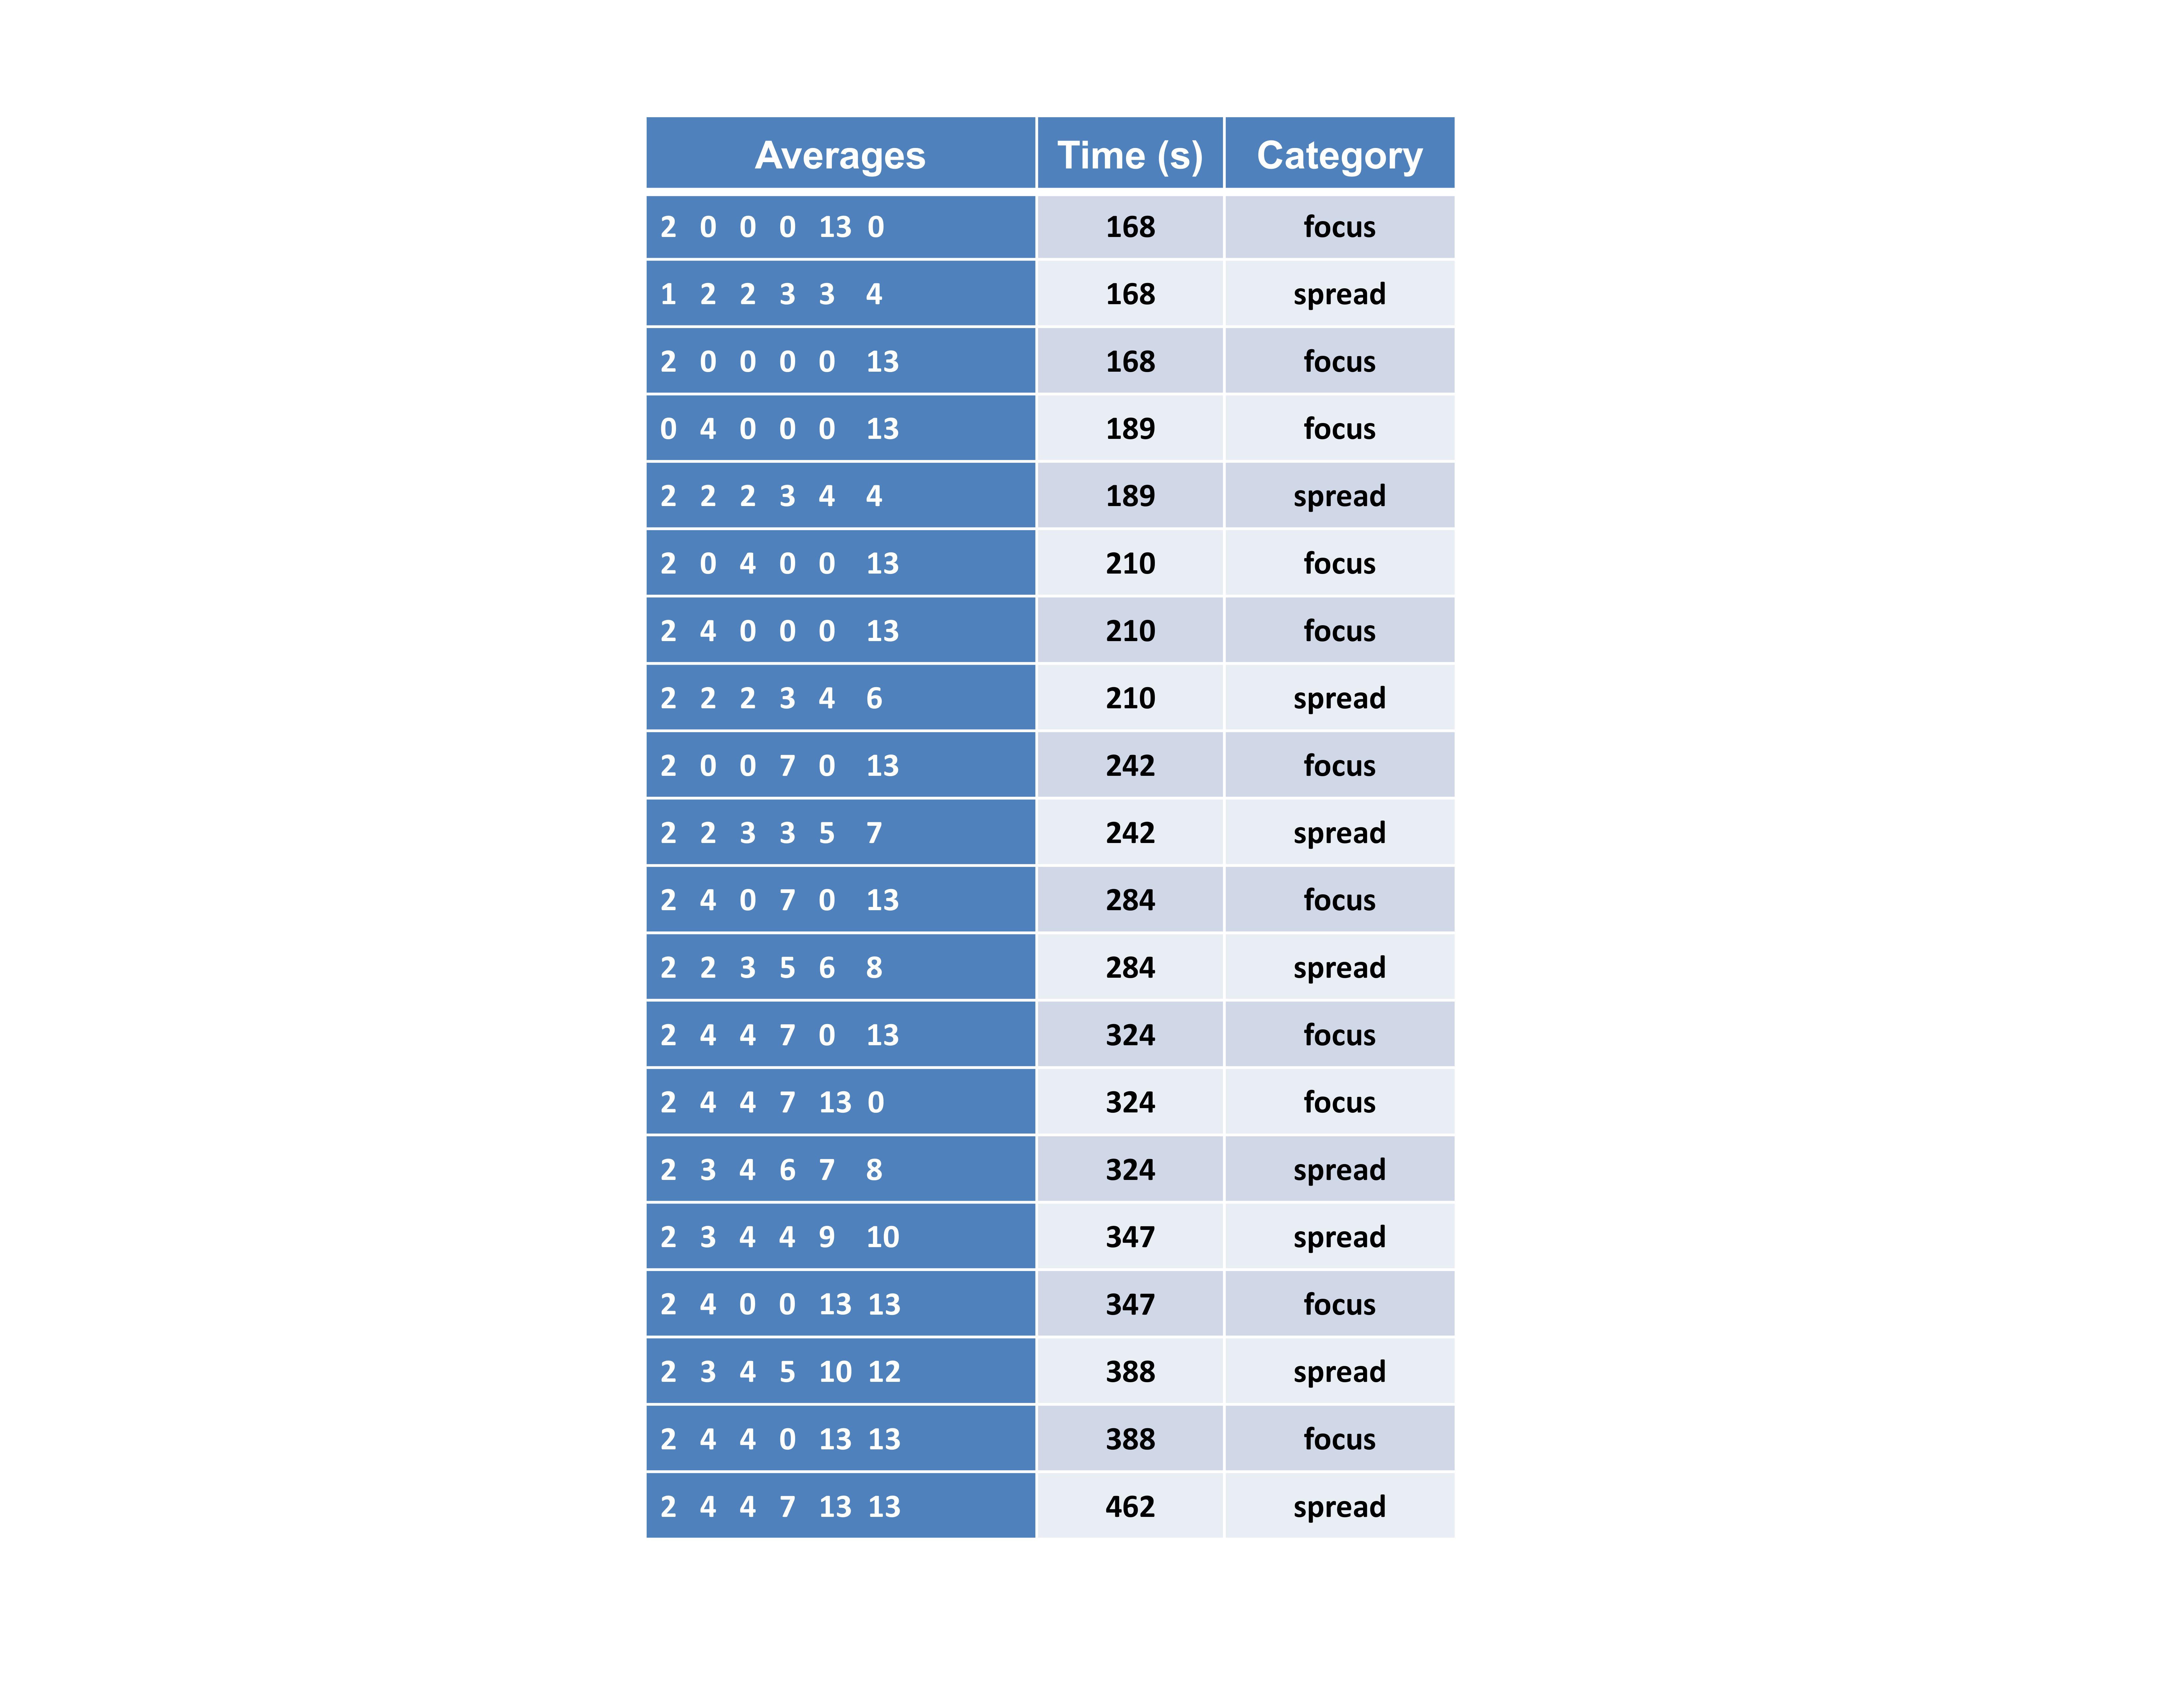
Acquired b-values/repetitions were sampled to form different subsets (Table 1). The strategies were based on two categories, namely “focus” and “spread”. Focus strategies involved saving time by removing some acquired b-values and acquiring many averages for remaining b-values, while spread strategies remove averages from each b-value relatively evenly.
Using a Matlab program (Mathworks, Natick, MA), S0 and ADC maps were calculated for each subset using a regular log-linear fitting method, and subsequently used to generate calculated b-value images of 50/100/400/600/800/1200, same as the acquired ones. The prostate peripheral and central regions were manually segmented on one representative slice, and their mean and standard deviation values on all images were exported.
Statistical analyses were performed using R (R Core Team, Vienna, Austria). To investigate stability, the coefficient of variation (CV) was calculated for each region. To investigate bias, the complete dataset was used as a surrogate for the ground truth, and the difference between the complete dataset and each subset was used as an estimate of the bias introduced by using the partial data. A bias-adjusted CV was calculated as $$$\sqrt{\sigma^{2}+\triangle^{2}}/\mu_{0}$$$, where σ was the standard deviation of the estimator, Δ was the bias in the estimator (µ - µ0), µ was the mean from the estimator and µ0 was the ground truth. This value provided a sum of squares combination of both bias and variation. A linear model was fitted to the bias-adjusted CV to determine the effects of strategy, time, region and diffusion weighting (main effects plus interaction between strategy and time, p<0.05 as significantly different).
RESULTS AND DISCUSSION
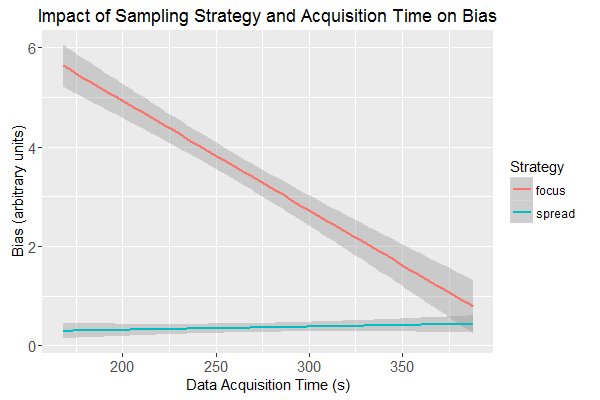
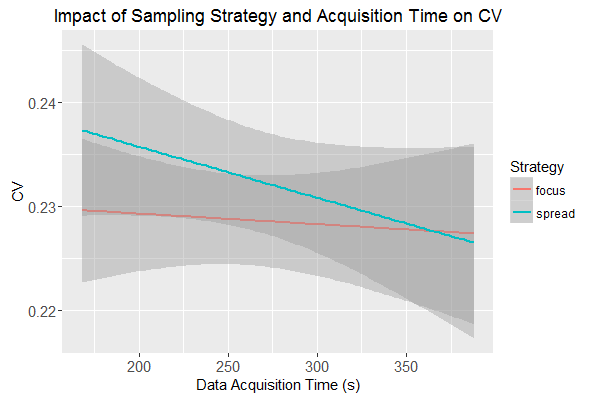
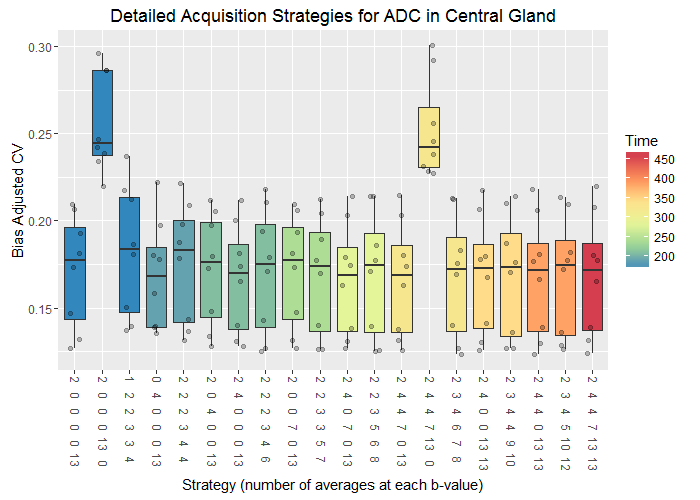
The overall linear model was highly significant (p<0.0001) with an adjusted R2=0.39. Tests of significance for the model parameters showed that the acquisition time was significant (p<0.0001), as was the acquisition strategy (p<0.0001) with the spread strategy having a bias-adjusted CV that was 0.03 smaller than the focus strategy (see Figure 1). Their interaction was also significant (p=0.012), but the uncorrected CV was not significantly dependent on time or strategy (see Figure 2).
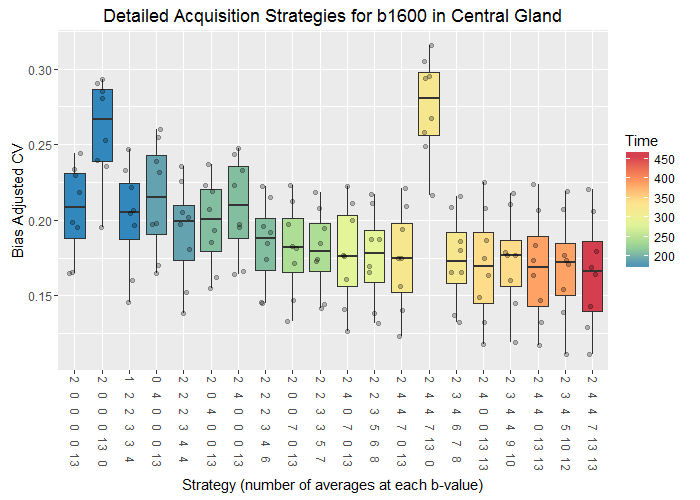
Bias-adjusted CV for the calculated b1600 images and ADC maps was highest when using any acquisition strategy which omitted either the highest b-values or the lowest b-values (see Figure 3 and 4). For the b1600 image the bias generally decreased as more data was sampled, and at any fixed sampling time the spread strategy resulted in the least absolute bias.
CONCLUSION
In this work, a framework was developed to explore the effects of b-value acquisition strategies on the stability and bias of the prostate DWI results including calculated b-value images and ADC. Using the DWI data from 8 prostate patients, this study revealed that the spread strategies outperform the focus strategies for the bias-adjusted CV, particularly when large numbers of averages have been removed. The framework and strategies proposed in this work may provide a useful tool to design b-value acquisition protocols to achieve the stability of the prostate DWI results in clinic.Acknowledgements
No acknowledgement found.References
1. Siegel RL, Miller KD, Jemal A. Cancer statistics, 2016. CA Cancer J Clin 2016;66:7-30.
2. Hosseinzadeh K, Schwarz SD. Endorectal diffusion-weighted imaging in prostate cancer to differentiate malignant and benign peripheral zone tissue. J Magn Reson Imaging. 2004;20:654-661.
3. Vargas HA, Akin O, Franiel T, Mazaheri Y, Zheng J, Moskowitz C, Udo K, Eastham J, Hricak H. Diffusion-weighted Endorectal MR Imaging at 3 T for Prostate Cancer: Tumor Detection and Assessment of Aggressiveness. Radiology 2011;259:775-784.
4. Kobus T, Vos PC, Hambrock T, De Rooij M, Hulsbergen-Van de Kaa CA, Barentsz JO, Heerschap A, Scheenen TW. Prostate cancer aggressiveness: in vivo assessment of MR spectroscopy and diffusion-weighted imaging at 3 T. Radiology 2012;265:457-467.
5. Jung SI, Donati OF, Vargas HA, Goldman D, Hricak H, Akin O. Transition zone prostate cancer: incremental value of diffusion-weighted endorectal MR imaging in tumor detection and assessment of aggressiveness. Radiology 2013;269:493-503.
Figures