3157
Regions of spared hypertrophy in pressure overloaded hearts promote severe systolic dysfunction as assessed by comprehensive cardiovascular magnetic resonance1Department of Cardiology, University Hospital Duesseldorf, Duesseldorf, Germany, 2Department of Molecular Cardiology, Heinrich-Heine University Duesseldorf, Duesseldorf, Germany, 3Heinrich-Heine University Duesseldorf, Department of Pharmacology and Clinical Pharmacology, Duesseldorf, Germany, 4Cardiovascular Research Institute, Heinrich-Heine University Duesseldorf, Duesseldorf, Germany
Synopsis
Regional heterogeneity of contractile function was described in patients with left ventricular (LV) hypertrophy, suggesting a predominant impairment of areas with distinct hypertrophy. Heterogeneity of myocardial hypertrophy therefore may contribute to global and regional abnormalities of LV function. Here, we systematically investigated the spatial and temporal patterning of myocardial hypertrophy in response to experimental pressure overload by cardiovascular MRI. Surprisingly, we identified a specific basolateral LV segment that is frequently spared from the development of myocardial hypertrophy and promotes systolic dysfunction. Moreover, the initial LV geometry and the vascular topology seemed to limit the extent of adaptation to pressure overload.
Purpose
Several studies have observed heterogeneity of regional function in patients with left ventricular (LV) hypertrophy and found a predominant impairment of areas with the most pronounced hypertrophy. Thus, heterogeneity of myocardial hypertrophy may contribute to global and regional abnormalities of LV function. Here, we systematically investigated the spatial and temporal patterning of myocardial hypertrophy in response to experimental pressure overload using comprehensive cardiovascular magnetic resonance (CMR).Methods
Eighteen wild-type 129/SvEv mice were subjected to transverse aortic constriction (TAC) and monitored by comprehensive CMR for 7 weeks. High resolution cine loops were recorded at 9.4T for functional analysis. Acquisition of T2 maps was carried out using an ECG and respiratory gated multi-echo sequence (16 echos, separated by a dTE of 3.36 ms; TR 500 ms, Tacq 6 min, ST 1 mm, FOV 30×30 mm2, MS 256×256 after zero filling, NS 4). Besides global cardiac function, we analysed regional alterations with an in-house developed software module, which divided the LV systematically into 200 equivalent sectors as previously described.1 The designated sectors were applied to all datasets to compare and correlate the measures in the anatomically corresponding areas. Fractional shortening (FS) as well as diastolic wall thickness (dWT), inner and outer ventricular radii (iVR & oVR) were calculated for each sector.Results
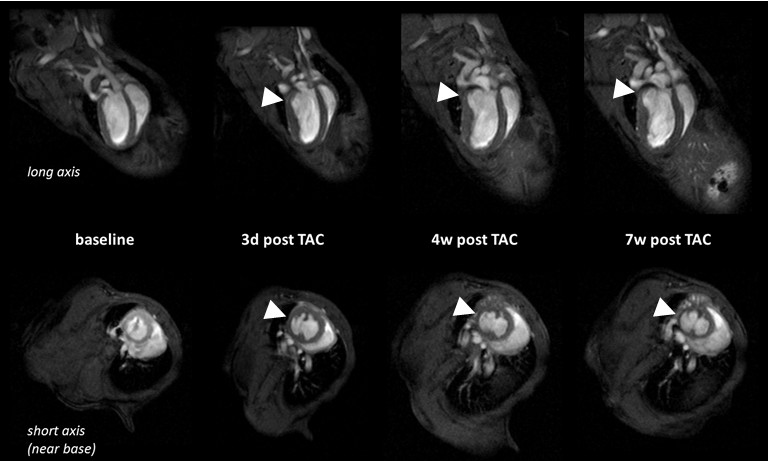
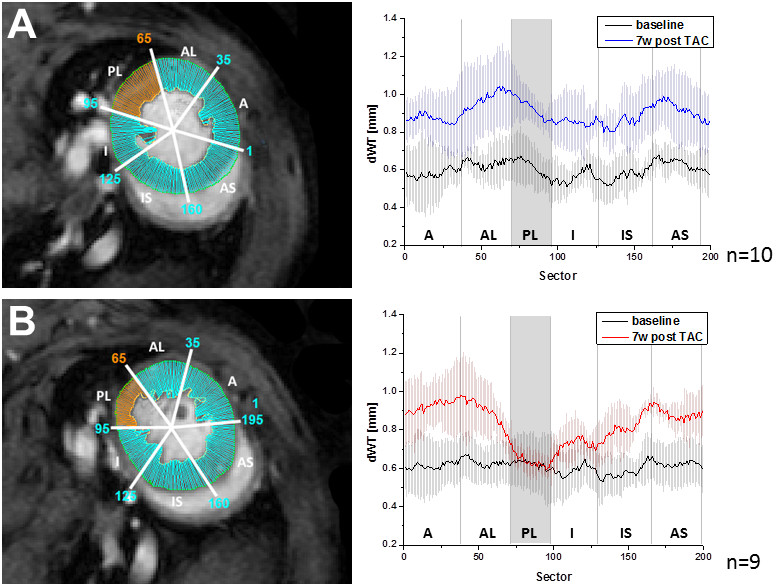
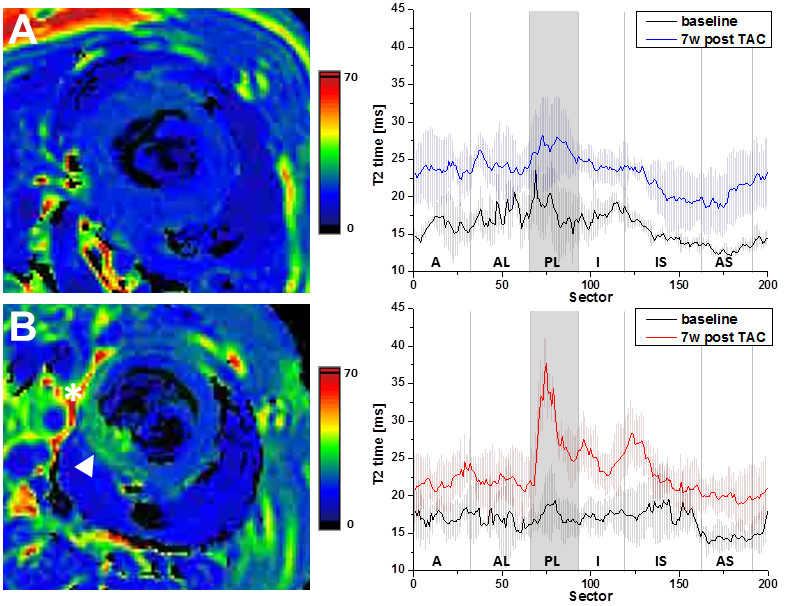
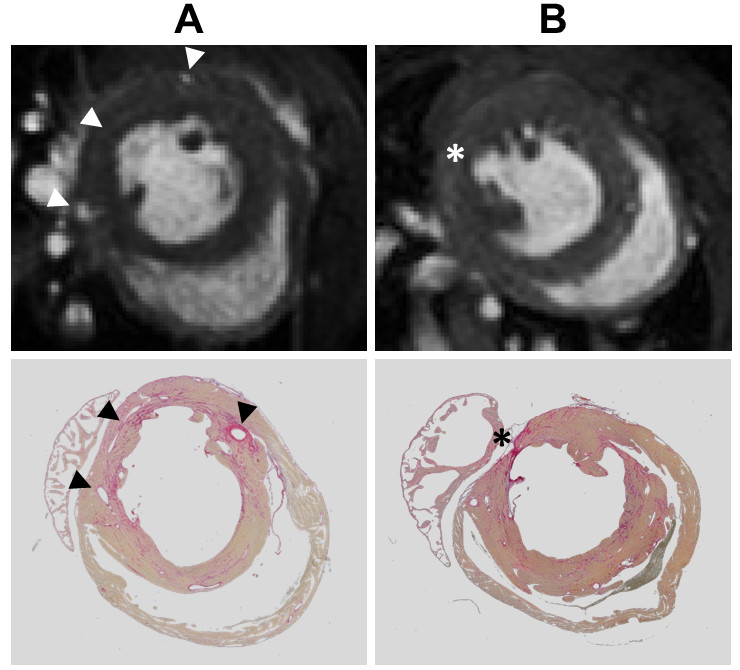
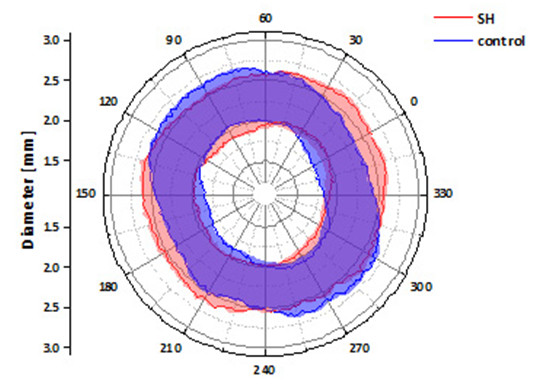
Longitudinal analysis after TAC confirmed the development of pronounced cardiac hypertrophy in all animals. In nine animals (=50%), however, we made the unexpected observation of a spared hypertrophy (SH) in the basolateral segment of the LV (Fig. 1). Quantitative analysis revealed an almost unchanged dWT at this location throughout the postoperative period of 7 weeks (Fig. 2, dWT 0.67±0.06 mm compared to mice without segments of SH (0.94±0.06 mm, p<0.01), indicating local failure of cardiomyocyte growth upon pressure overload in this segment. FS of these cardiac regions was significantly reduced (13.0±3.4%) as compared to mice without segments of SH (40.7±4.3%, p<0.001). In contrast, almost no differences were found in well hypertrophied sectors (SH anterior: 32.8±6.1 % vs control anterior: 35.7±7.5 %, p=0.381). Importantly, the occurrence of SH was also associated with an impaired global ejection fraction (34.3±6.7 vs. 48.4±5.6%, p<0.001) 7 weeks after TAC. Concomitantly with functional impairment in the posterolateral segment of the basal LV in mice with SH, we found substantial alterations of T2 relaxation times in these sectors. Only here, we saw a disproportionate increase in T2 7 weeks after surgery compared to other sectors of the LV (37.0±9.7 ms vs 26.0±3.0 ms, p=0.005), whereas T2 in the same sectors of control animals were indistinguishable from the surrounding tissue (21.8±0.8 ms vs 21.1±0.8 ms, n.s.). Of note, both groups exhibited a moderate overall increase in T2 as compared to baseline conditions (Fig. 3). Interestingly, especially in the posterolateral area the vessel density seems to decrease over time in SH mice as compared to the corresponding area in control mice (Fig. 4). Finally, retrospective analysis of our data showed that SH occurs in mice with a rather round than oval basal LV geometry prior to the induction of hypertrophy (Fig. 5).Discussion
Taken together, we identified the posterolateral segment at the base of the LV to omit the development of hypertrophy in 50% of 129/SvEv mice after TAC. Local contractile function of this region was significantly impaired in response to pressure overload, and affected hearts also exhibited a global systolic dysfunction. Furthermore, the massive rise in T2 relaxation in the posterolateral segment of SH mice most likely reflects interstitial edema that may result from myocardial maladaption to pressure overload. The slight overall increase in T2 observed for both groups after 7 weeks of pressure overload might be caused by an increased cellular water content in hypertrophic myocardium.2,3 Additionally, we identified a rather oval LV geometry at the heart’s base to be benificial for uniform development of hypertrophy and good contractile function upon chronic pressure overload. Interestingly, in humans the ventricular geometry has as well been found to be associated with different remodeling patterns under hypertension, with cavity shape most elliptic in patients with concentric remodeling and most spherical in those with eccentric hypertrophy.4 Besides, also a decreasing vessel density in areas with severe wall stress was described in patients with cardiac hypertrophy.5
Conclusion
We conclude that not only regions of exaggerated hypertrophy, but also and particularly regions of reduced hypertrophy may promote the functional decline of pressure overloaded LVs. Moreover, the initial LV geometry and vascularization prior to the induction of hypertrophy seems to limit the regional devolution of hypertrophy as an adaptation to the change of pressure gradients.Acknowledgements
This work was supported by the Sonderforschungsbereich 1116 of the Deutsche Forschungsgemeinschaft (DFG) and a GEROK scholar, as well as by the Forschungskommission of the Medical Faculty of the Heinrich Heine University.References
1. Bonner F, Jacoby C, Temme S, Borg N, Ding Z, Schrader J and Flogel U. Multifunctional MR monitoring of the healing process after myocardial infarction. Basic Res Cardiol. 2014;109:430.
2. Giri S, Chung YC, Merchant A, Mihai G, Rajagopalan S, Raman SV and Simonetti OP. T2 quantification for improved detection of myocardial edema. J Cardiovasc Magn Reson. 2009;11:56.
3. Nishii T, Kono AK, Shigeru M, Takamine S, Fujiwara S, Kyotani K, Aoyama N and Sugimura K. Cardiovascular magnetic resonance T2 mapping can detect myocardial edema in idiopathic dilated cardiomyopathy. Int J Cardiovasc Imaging. 2014;30 Suppl 1:65-72.
4. Ganau A, Devereux RB, Roman MJ, de Simone G, Pickering TG, Saba PS, Vargiu P, Simongini I and Laragh JH. Patterns of left ventricular hypertrophy and geometric remodeling in essential hypertension. J Am Coll Cardiol. 1992;19:1550-8.
5. Levy BI, Ambrosio G, Pries AR and Struijker-Boudier HA. Microcirculation in hypertension: a new target for treatment? Circulation. 2001;104:735-40.
Figures