3156
Four Chamber Endocardial Surface Reconstruction from Cardiac MRI Data1Auburn University MRI Research Center, Auburn University, Auburn, AL, United States, 2Electrical and Computer Engineering, Auburn University, Auburn, AL, United States, 3Division of Cardiovascular Disease, University of Alabama at Birmingham, Birmingham, AL, United States, 4Birmingham Veterans Affairs Medical Center, Birmingham, AL, United States, 5MR R&D, Siemens Healthcare, Malvern, PA, United States
Synopsis
Shape analysis of cardiac chambers has important implications for cardiac diseases, most extensively studied in mitral regurgitation (MR). Here we present a novel algorithm for fitting surfaces to the endocardium of all four chambers through the entire cardiac cycle and demonstrate its use in patients with MR. This algorithm, which is based on standard CMR acquisitions, demonstrates improved visualization of the chambers and their function, which can help cardiologists and surgeons in treatment planning in conditions such as mitral regurgitation.
PURPOSE
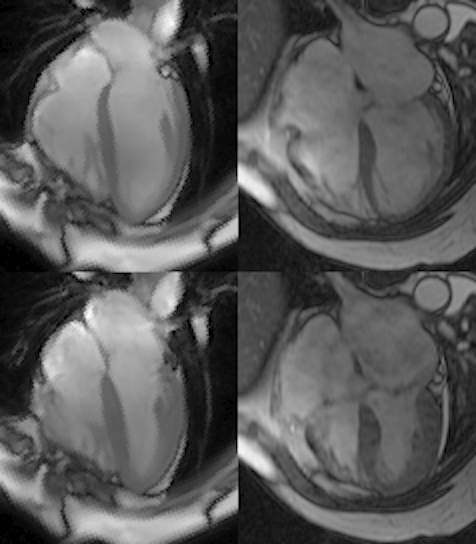
Shape analysis of cardiac chambers has important implications for cardiac diseases, most extensively studied in mitral regurgitation (MR), where degeneration of the mitral valve (MV) results in left ventricular (LV) blood ejected into the left atrium (LA)1. Most shape analysis in MR has focused on dilation of the LV, but changes in left atrial (LA) shape and function as well as the right ventricle (RV) and right atrium (RA) (Fig. 1) can potentially provide guidance on the timing of MV surgery. Here we present a novel algorithm for fitting surfaces to the endocardium of all four chambers through the entire cardiac cycle and demonstrate its use in patients with MR.METHODS
Population/Imaging protocol: MRI was acquired from 6 normal volunteers and 6 patients with isolated MR. Both groups were imaged with standard cardiac cine slices in 2 chamber and 4 chamber view, and a short-axis (SA) view covering whole ventricles and atria. Parameters were set as follows: FOV: 360-400mm, 8mm slice thickness, no gap, 256*128 matrix.
Contouring: Endocardial contours were manually drawn at ventricular ED and ES continuously from the LV apex to LA apex, and RV apex to RA apex. Intersections of the mitral valve (MV) and tricuspid valve (TV) leaflets with the LV and RV wall were manually placed in 2 and 4 chamber views at end diastole (ED) and end systole (ES). All intersections and endocardial contours were propagated to the remaining time frames using automated algorithm2. Circles were fit to the mitral and tricuspid annuli based on the MV and TV intersections and used to determine which contour points were part of the LV/RV and which contour points were part of the LA/RA.
Surface Fitting: Closed surfaces were fit to each of the four chambers using the following procedure. First a sphere with uniformly sampled points3 and Delaunay triangulated mesh4 was constructed that contained the chamber at ED and was centered at the contour point centroid. A rough surface was constructed by moving each mesh vertex along a line between the vertex and the sphere center until the number of contour points in a window were maximized. This surface was then smoothed by adjusting the vertex points to minimize a cost function containing two terms: the sum of squared distances between contour points and the surface and the sum of absolute surface curvature at each point. This smoothed surface was then transferred to an adjacent time frame and used to construct a rough surface at that time frame, which was then smoothed. This procedure was repeated in both forward and backward in time until all time frames were processed.
Shape and Deformation Analysis: Average curvature and displacement from LVED was computed in each segment of standard segmental models5 for the LV and RV. For the LA and RA, a model with 4 segments in each of three levels was used.
Validation: Surface fits were validated by comparing volumes enclosed by the surface of each chamber compared to volumes computed via summing the volumes defined by each contour with a paired t-test.
RESULTS
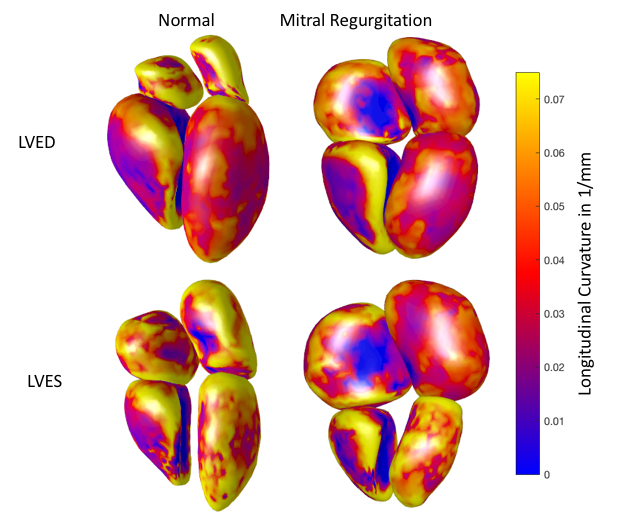
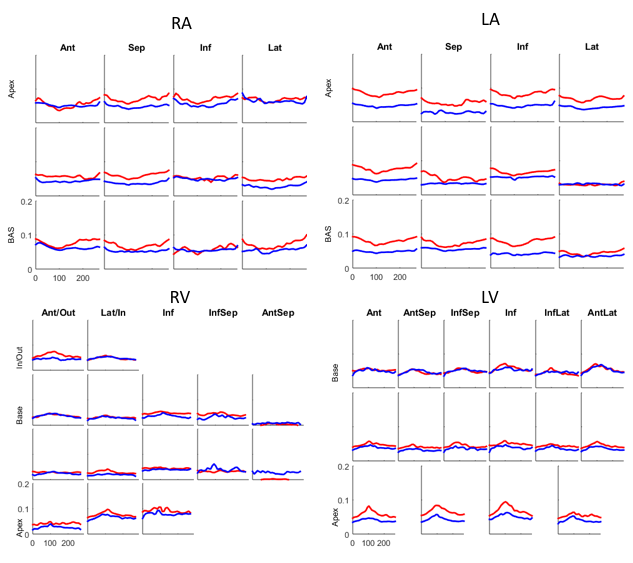
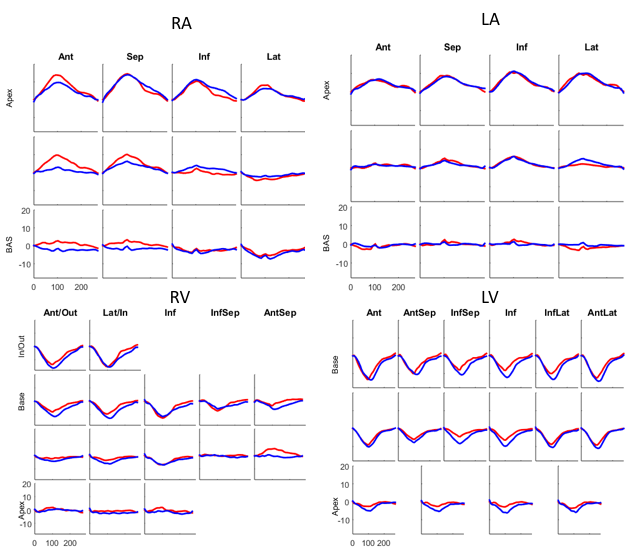
The root-mean-square (RMS) distance between contour points and the resulting surface averaged over all time frames and all participants was LV:0.22 ±0.09mm, LA:0.54 ±0.10mm, RV:1.08±0.32mm, and RA: 1.21±0.22mm, which are on the order of the image pixel spacing. Volumes enclosed by the surface of each chamber were not statistically different from volumes computed via contour volume summation. Fig. 2 shows four chamber endocardial surfaces for a representative MR patient and normal volunteer at LVED and LVES mapped with longitudinal curvature in 1/mm. Figs. 3 and 4 show longitudinal curvature and displacement respectively in each segment over time.DISCUSSION
The LV curvatures in Fig 3 show that remodeling in MR patients mainly occurs in the apex, which is consistent with previous work1. LA curvatures in MR are smaller compared to normal, but radial displacements are similar to normal. Smaller changes were observed in the RV and RA. These relationships between atrio-ventricular remodeling and mechanical function may be useful in determining the severity and chronicity of valvular regurgitation.CONCLUSION
The analytic tools shown here when coupled with standard CMR acquisitions demonstrate the feasibility of the method and the improved visualization of the chambers, which can help cardiologists and surgeons in treatment planning in conditions such as mitral regurgitation.Acknowledgements
No acknowledgement found.References
1. Schiros CG, Dell'Italia LJ, Gladden JD, et al. Magnetic resonance imaging with 3-dimensional analysis of left ventricular remodeling in isolated mitral regurgitation: implications beyond dimensions. Circulation. 2012 May 15;125(19):2334-42.
2. Feng W, Nagaraj H, Gupta H, et al. A dual propagation contours technique for semi-automated assessment of systolic and diastolic cardiac function by CMR. J Cardiovasc Magn Reson. 2009 Aug 13;11:30.
3. T. Erber and G. Hockney, Equilibrium configurations of N equal charges on a sphere, Journal of Physics A: Mathematical and General, vol. 24, p. L1369, 1991.
4. D. T. Lee,and B. J. Schachter, Two Algorithm for Constructing a Delaunay Triangulation,International Jornal of Computer&Information Sciences, Jun 1980, Volume 9, Issue 3, pp 219-242.
5. Zhong L, Gobeawan L, Su Y, et al., Kassab G. Right ventricular regional wall curvedness and area strain in patients with repaired tetralogy of Fallot. Am J Physiol Heart Circ Physiol. 2012 Mar 15;302(6):H1306-16.
Figures