3149
Does Right Ventricular Myocardial Kinetic Energy Correlate With Pressure Overload in Repaired Tetralogy of Fallot Patients?1Department of Biomedical Engineering and Environmental Sciences, National Tsing Hua University, Hsinchu, Taiwan, 2Department of Radiology, Kaohsiung Veterans General Hospital, Kaohsiung, Taiwan, 3Department of Pediatrics, Kaohsiung Veterans General Hospital, Kaohsiung, Taiwan, 4Department of Medical Imaging, National Taiwan University Hospital, Taipei, Taiwan, 5Medical Physics, Department of Radiology, University Hospital Freiburg, Freiburg, Germany
Synopsis
The association of right ventricular (RV) myocardium adapted to pressure overload of repaired tetralogy of Fallot (rTOF) patient is still unclear. We evaluated three-directional myocardial kinetic energy (KE) and correlated it with RV-related pressure. The recruited rTOF patients presented decreased peak KERV both in systole and diastole. However, patient group exhibited increased percentage of radial KERV, accompanying with highly positive correlation with RV systolic pressure. In conclusion, the investigation of the correlation between myocardial kinetic energy and RV pressure overload may helpful to comprehend compensatory mechanism and myocardial remodeling in patients with rTOF.
Introduction
After the repaired surgery for patients with tetralogy of Fallot (rTOF), pulmonary regurgitation (PR) may lead to right ventricle (RV) pressure overload and heart failure.1-3 Previous studies discussed the impact of pressure overload on the wall stress and ventricular dimension.4,5 However, these parameters provided limited insight into the complex mechanisms of myocardial adaptation to pressure overload. In this study, we analyzed three-directional myocardial motion kinetic energy (KE). The purpose was to investigate the relationships between RV myocardial KE and pressure, thereby to comprehend potential RV myocardial remodeling mechanism in rTOF patients.Method
The study population comprised 15 rTOF patients and 15 age-matched normal volunteers.
Images were acquired at a 3-T MR scanner (Tim Trio or Skyra, Siemens, Germany) by using 2D dark-blood tissue phase mapping acquisitions. The basal slice for the calculation of myocardial wall motion velocity was prescribed 1-cm beneath the tricuspid valve level. Velocity encoding was set to 15 cm/s and 25 cm/s for in-plane and through-plane motions, respectively. The protocol parameters were as follows: TR/TE = 6.5/4.2 ms, pixel size = 1.17 x 1.17 mm2, slice thickness = 6 mm, and temporal resolution = 26 ms. The total scanning time was approximately 2 minutes.
Longitudinal (Vz), radial (Vr), and circumferential (VØ) velocities in RV were computed. The time frame was normalized to the individual period of systolic time and is presented as the percentage of the end-systole (%ES).
The myocardial kinetic energy was calculated as:
$$KE=\frac{1}{2}\times\rho\times V\times v^{2}$$
where ρ was myocardial density with a value of 1050 kg/m3, V denoted voxel volume, and v represented the voxel velocity. We computed three-directional components of KE (KERV,r, KERV,Ø, and KERV,z) and the summation of the three components KE (total KERV). The relative percentage of each component to the total KERV were presented as %KERV,r, %KERV,Ø, and %KERV,z. The statistical difference between the normal and rTOF groups was assessed using two-tailed Student t test. A P value < 0.05 was considered statistically significant.
Results
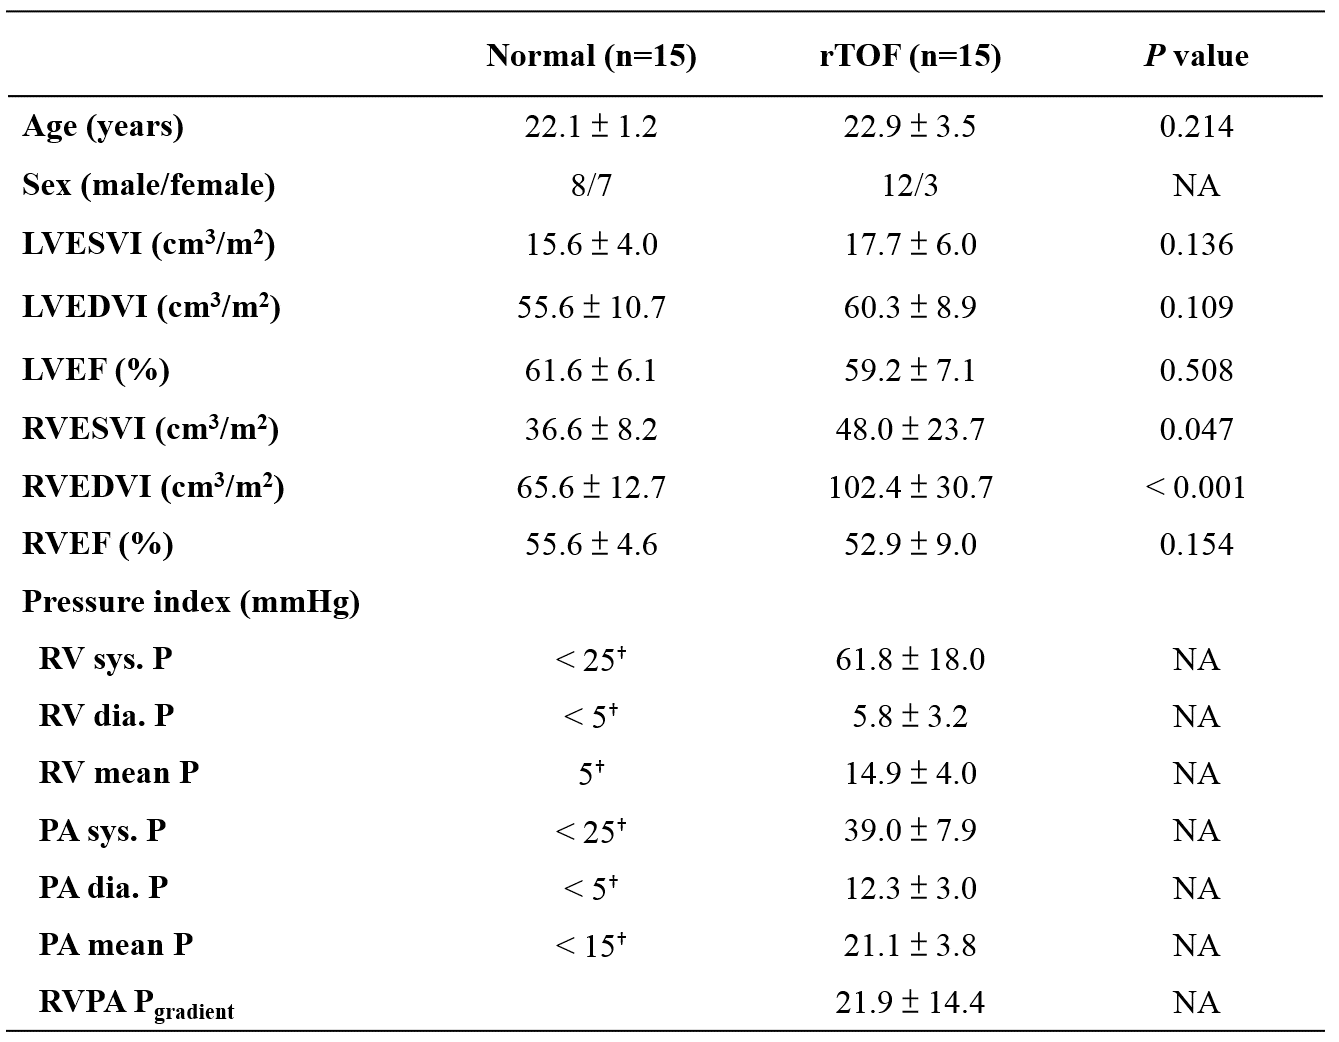
In Table 1, patients with rTOF presented higher RV end-systolic/end-diastolic volume index (both P<0.01), indicating that the patients were with the presence of dilated RV. The pressure of RV and pulmonary artery (PA) in rTOF were significantly higher than the normal standards reported by AHA, suggesting the symptom of pressure overload.
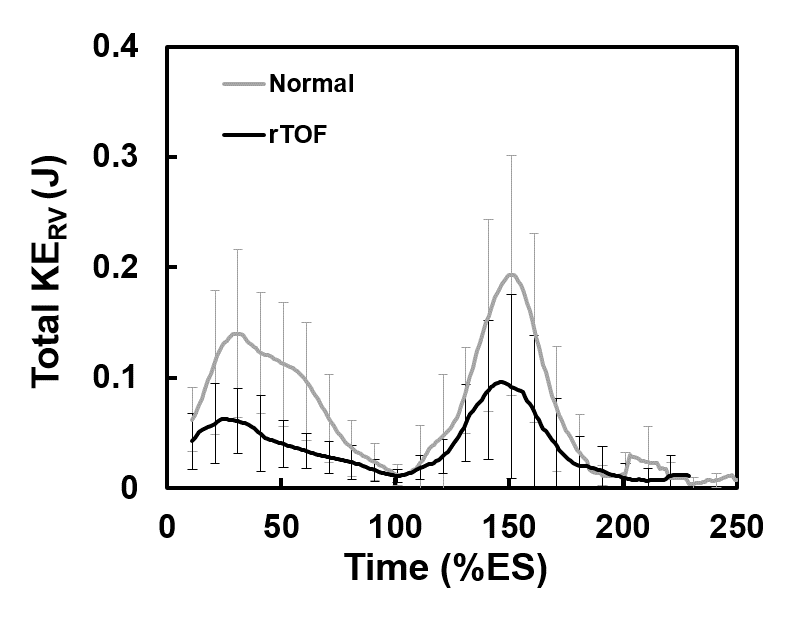
The time courses of total KERV was shown in Figure 1, the rTOF group displayed lower peak systolic KERV (at 30 %ES, P<0.001) and lower peak diastolic (at 150 %ES, P<0.01).
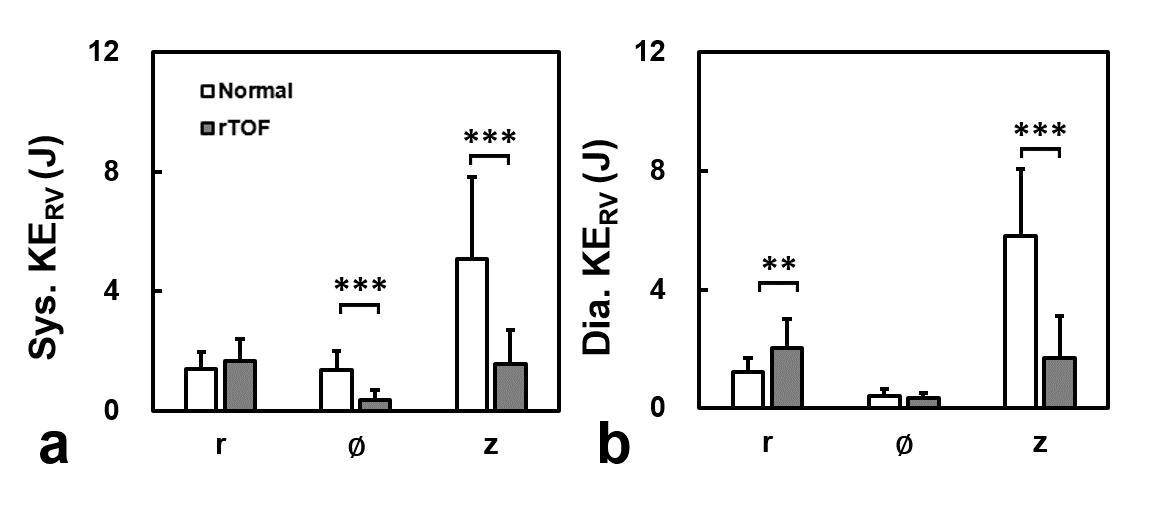
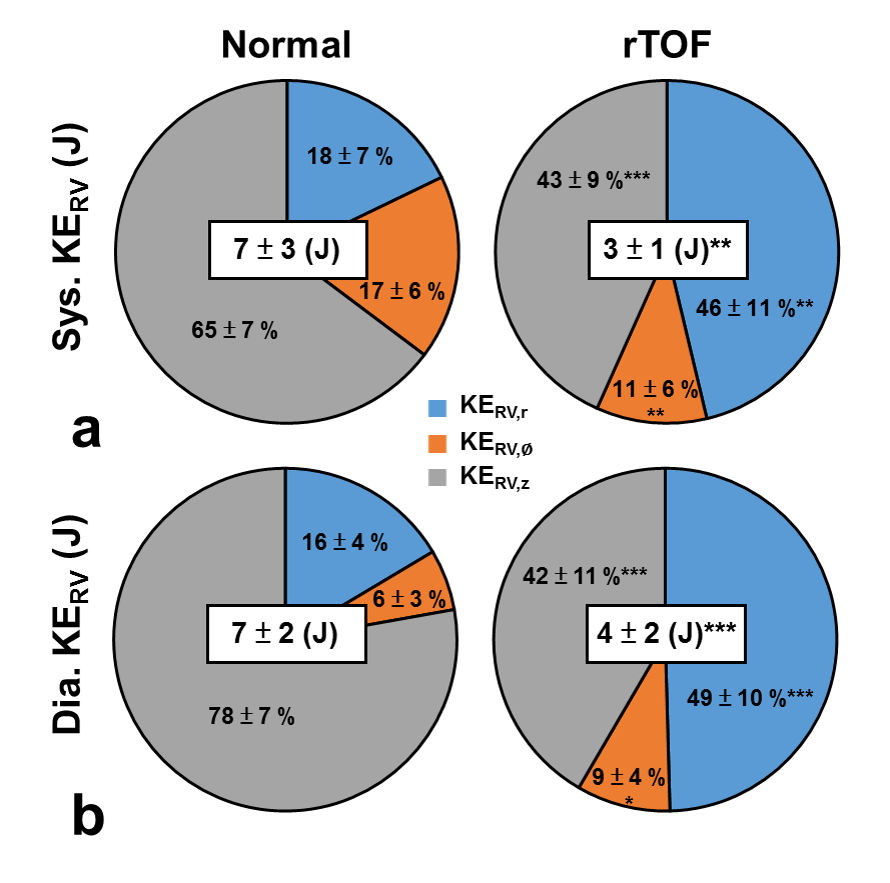
Figure 2 displays three-directional components of KE in systole and diastole. Patients exhibited significantly lower systolic KERV,Ø and KERV,z than normal subjects (both P<0.001). In diastole, rTOF group presented higher KERV,r (P<0.01) and lower KERV,z (P<0.001) than normal group. Moreover, the rTOF group was with lower total KERV than normal group during both systolic (P<0.01) and diastolic periods (P<0.001), as illustrated in Figure 3.
The rTOF group exhibited substantially altered proportions of %KE for three-directional components (Figure 3). The %KERV,z of normal group occupied a substantially larger proportion than the other two components in both of systole and diastole. However, rTOF group presented comparable proportions of %KERV,z and %KERV,r.
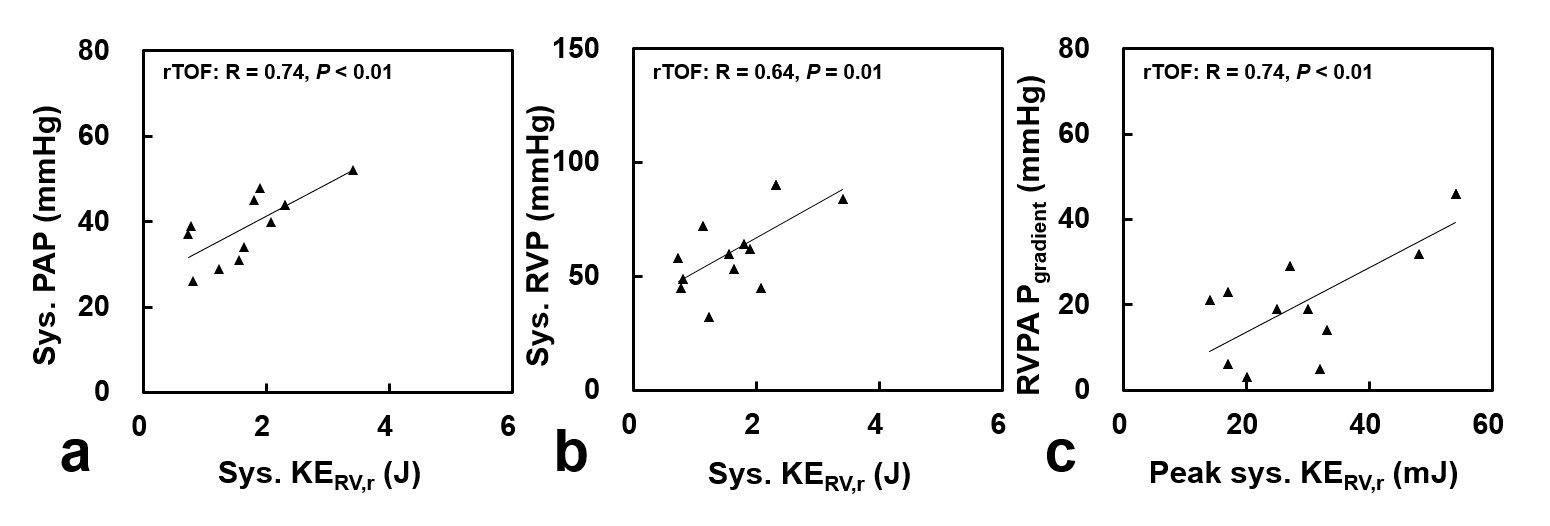
For the rTOF group, systolic KERV,r correlated with both systolic PA and RV pressure, as illustrated in Figures 4a and 4b. In Figure 4c, peak systolic KERV,r showed significant positive correlation with RVPA pressure gradient.
Discussion
In this study, we quantified three-directional RV myocardial KE and RV/PA pressure in rTOF patients. The major findings in the rTOF group included: 1) decreased systolic and diastolic KERV, 2) increased %KERV,r and reduced %KERV,z, 3) systolic KERV,r correlate with pressured data.
In the current work, rTOF patients presented significant reduced %KERV,z, which is consistent with the previous studies using speckle-tracking echocardiography and claiming that the longitudinal myocardial function is more sensitive to the cardiac pathologies than radial function.6,7 In regard to increased %KERV,r, it can be attributed to a compensatory mechanism for impaired longitudinal function. We further observed a strong correlation between systolic KERV,r and systolic RV/PA pressure in the rTOF group, implying that the cardiac pressure can impact on myocardial function. To the best of our knowledge, this is the first study to evaluate the relationship between myocardial KE and pressure indices in patients with rTOF.
In conclusion, the altered KERV in three-directional myocardial motion may reflect the myocardial remodeling in rTOF patients. The high correlation between systolic KERV,r and pressure indices in right heart revealed the association of energy and pressure and it may have a potential to be an adjunct diagnostic index to evaluate the myocardial remodeling.
Acknowledgements
No acknowledgement found.References
1. Geva T. Indications and timing of pulmonary valve replacement after tetralogy of Fallot repair. Seminars in Thoracic and Cardiovascular Surgery: Pediatric Cardiac Surgery Annual: Elsevier, 2006:11-22.
2. Oosterhof T, Tulevski II, Vliegen HW, Spijkerboer AM, Mulder BJ. Effects of volume and/or pressure overload secondary to congenital heart disease (tetralogy of Fallot or pulmonary stenosis) on right ventricular function using cardiovascular magnetic resonance and B-type natriuretic peptide levels. The American journal of cardiology 2006;97:1051-1055.
3. Helbing WA, Niezen RA, Le Cessie S, Van Der Geest RJ, Ottenkamp J, De Roos A. Right ventricular diastolic function in children with pulmonary regurgitation after repair of tetralogy of Fallot: volumetric evaluation by magnetic resonance velocity mapping. Journal of the American College of Cardiology 1996;28:1827-1835.
4. Yoo BW, Kim JO, Kim YJ et al. Impact of pressure load caused by right ventricular outflow tract obstruction on right ventricular volume overload in patients with repaired tetralogy of Fallot. The Journal of thoracic and cardiovascular surgery 2012;143:1299-1304.
5. Sheehan FH, Ge S, Vick GW et al. Three-dimensional shape analysis of right ventricular remodeling in repaired tetralogy of Fallot. The American journal of cardiology 2008;101:107-113.
6. Donal E, Bergerot C, Thibault H et al. Influence of afterload on left ventricular radial and longitudinal systolic functions: a two-dimensional strain imaging study. European Heart Journal-Cardiovascular Imaging 2009:jep095.
7. Bansal M, Sengupta PP. Longitudinal and circumferential strain in patients with regional LV dysfunction. Current cardiology reports 2013;15:1-14.
Figures