3148
MOTION-RESOLVED 5D IMAGING OF THE HEART: TIME TO GET RID OF THE ECG?1Department of Radiology, University Hospital (CHUV) and University of Lausanne (UNIL), Lausanne, Switzerland, 2Advanced Clinical Imaging Technology, Siemens Healthcare AG, Lausanne, Switzerland, 3Department of Radiology, Case Western Reserve University, Cleveland, OH, 4Center for Biomedical Imaging (CIBM), Lausanne, Switzerland
Synopsis
The performance of motion-resolved whole-heart MR imaging strongly depends on the quality of cardiac- and respiratory-gating signals. While navigators or self-navigation can be used to account for respiratory motion, ECG is a mainstay for synchronizing data acquisition with the cardiac cycle. We tested whether physiological motion information, directly extracted from k-space-center, can replace respiratory navigators and ECG signals. The proposed solution was applied in 9 healthy volunteers and results were compared to those obtained with the ECG-signal. Correlation between R-wave time-stamps from the ECG and the cardiac self-gating signal was excellent, while image quality and coronary artery conspicuity remained unchanged.
INTRODUCTION
Cardiac and respiratory motion-resolved whole-heart MR imaging techniques have recently been introduced and enable simultaneous anatomical and functional assessment of the heart from one single free-breathing scan1,2. However, these techniques still require the use of external ECG devices to synchronize data acquisition1,3 with the cardiac cycle. Unfortunately, this adds to the patient setup time on the one hand and sometimes leads to artifactual trigger points because of the magneto hydrodynamic effect on the other. In this study, we aim to address these limitations by investigating self-gating strategies that directly extract information about physiological motion from the center of k-space. More specifically, we compare the timing of the ECG and the cardiac self-gating signal and the quality of 5D whole-heart images independently reconstructed using these two synchronization signals.METHODS
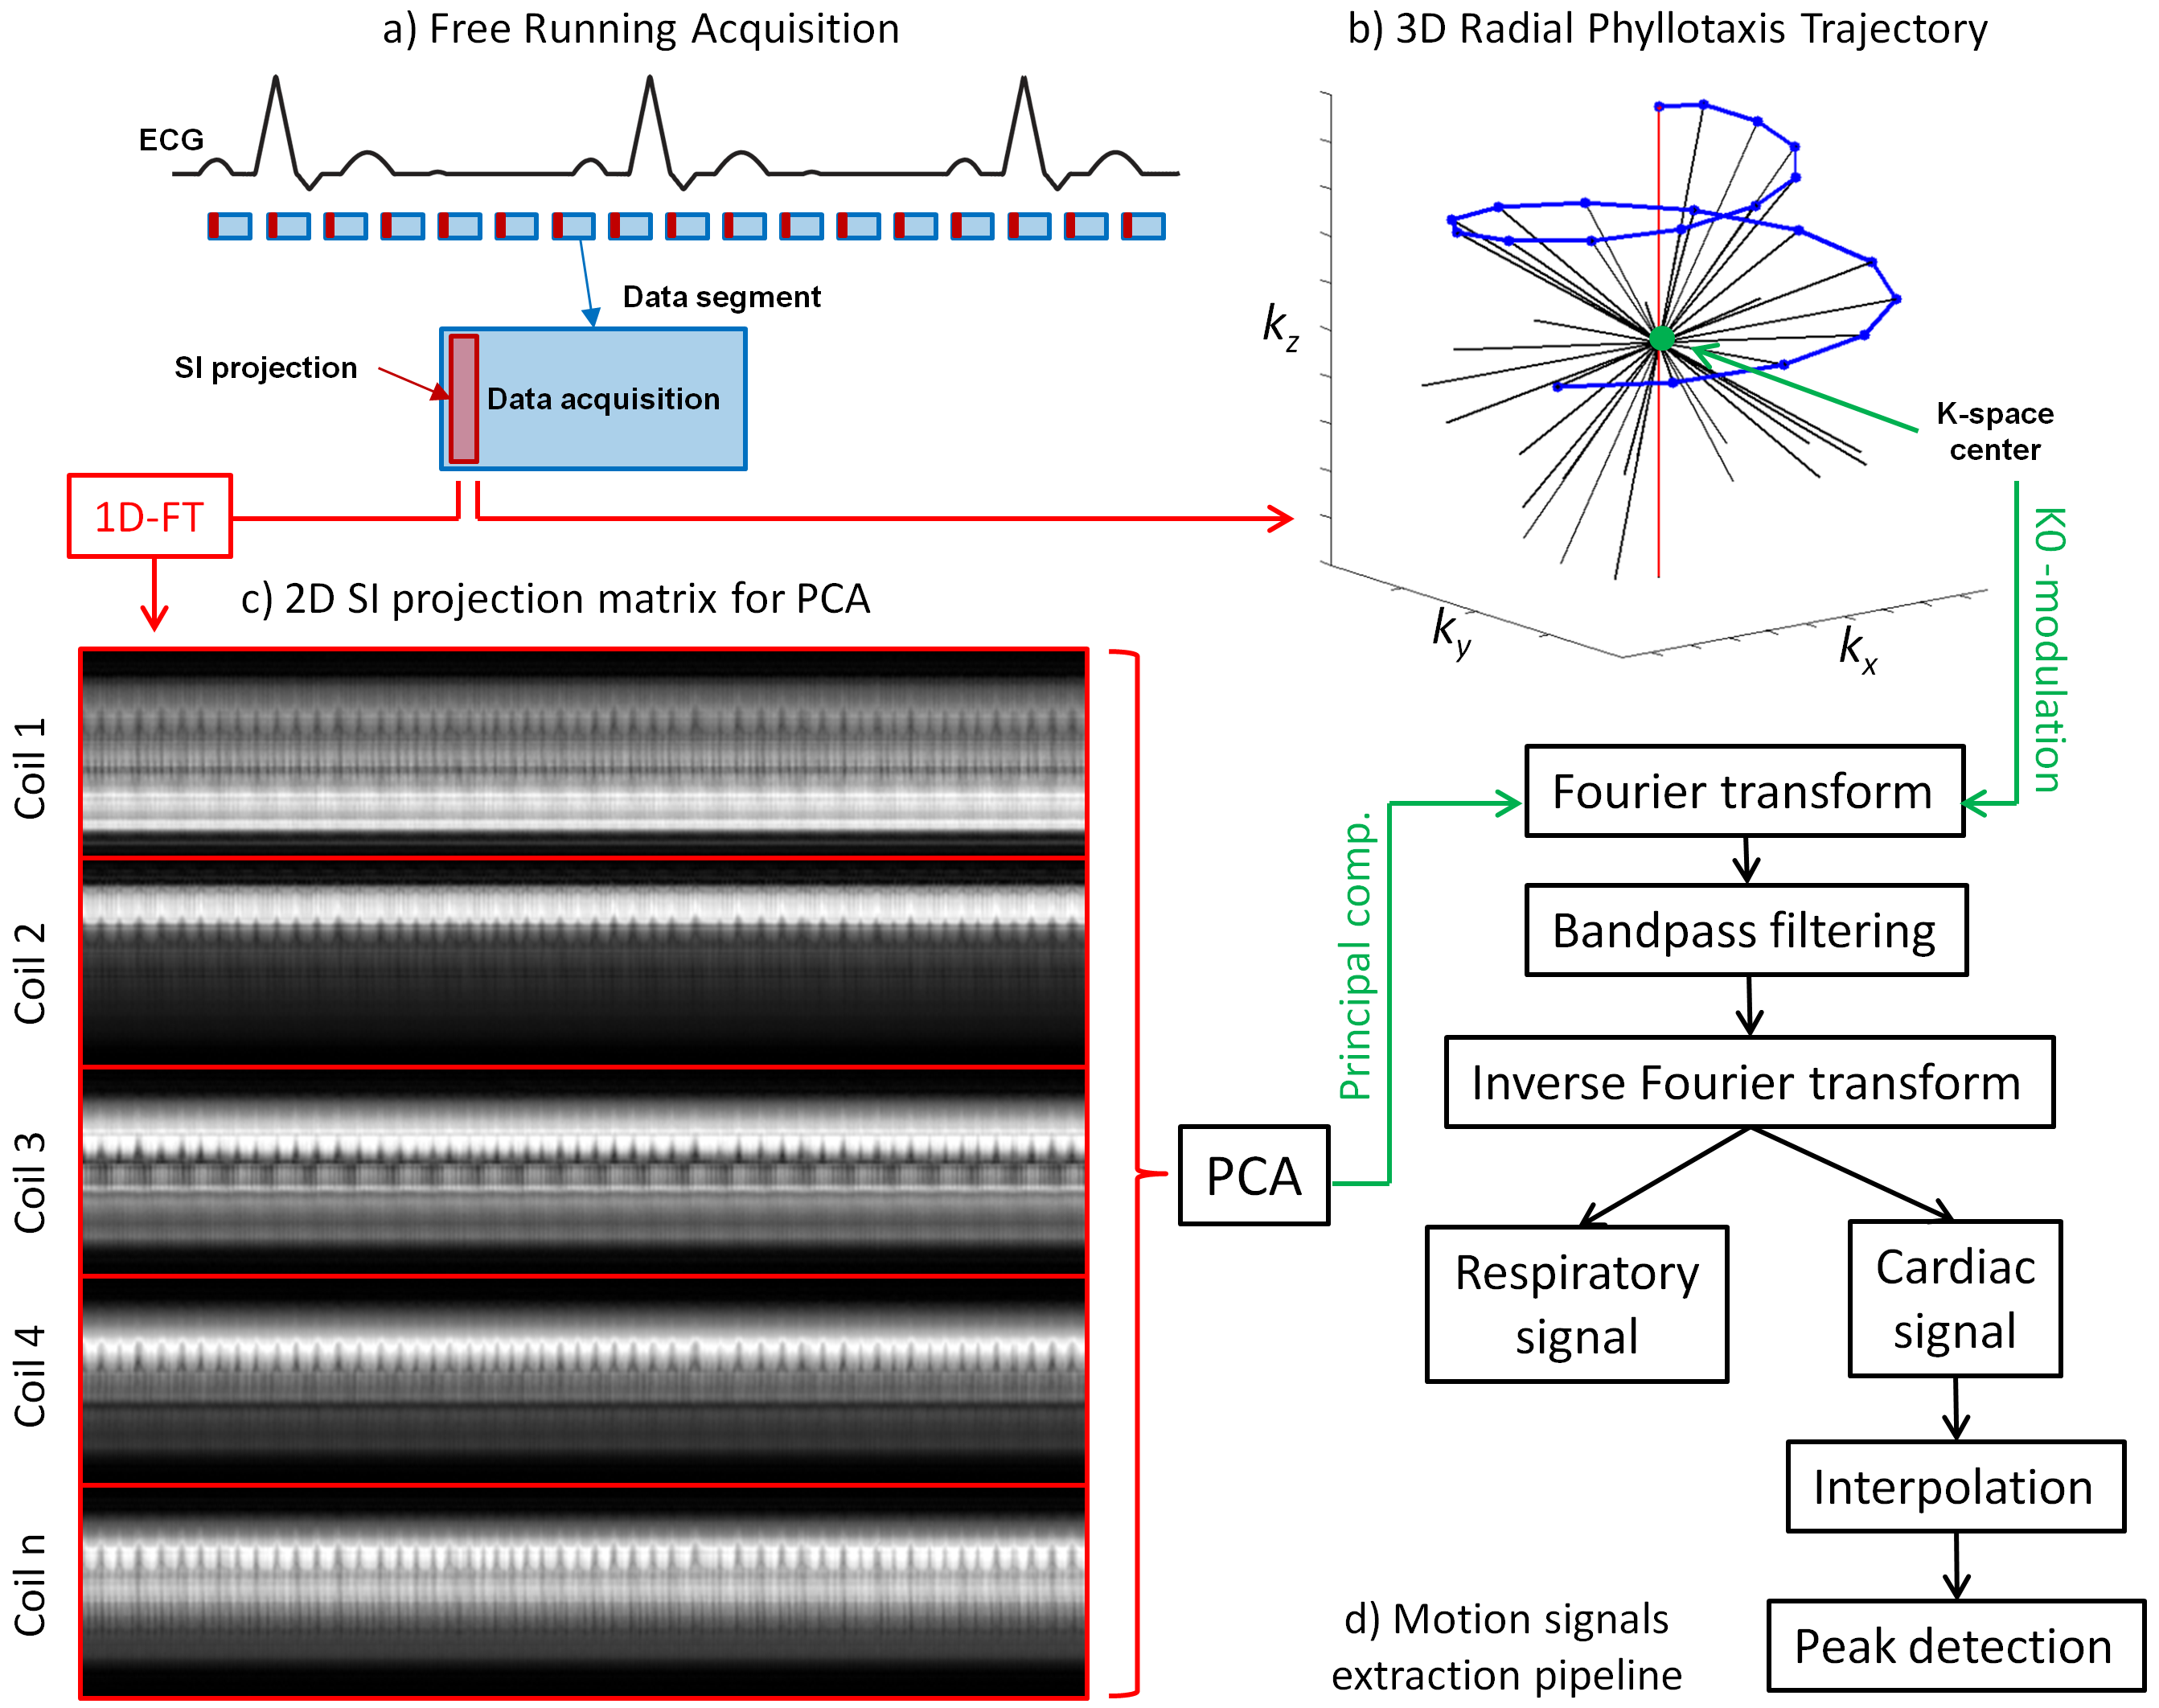
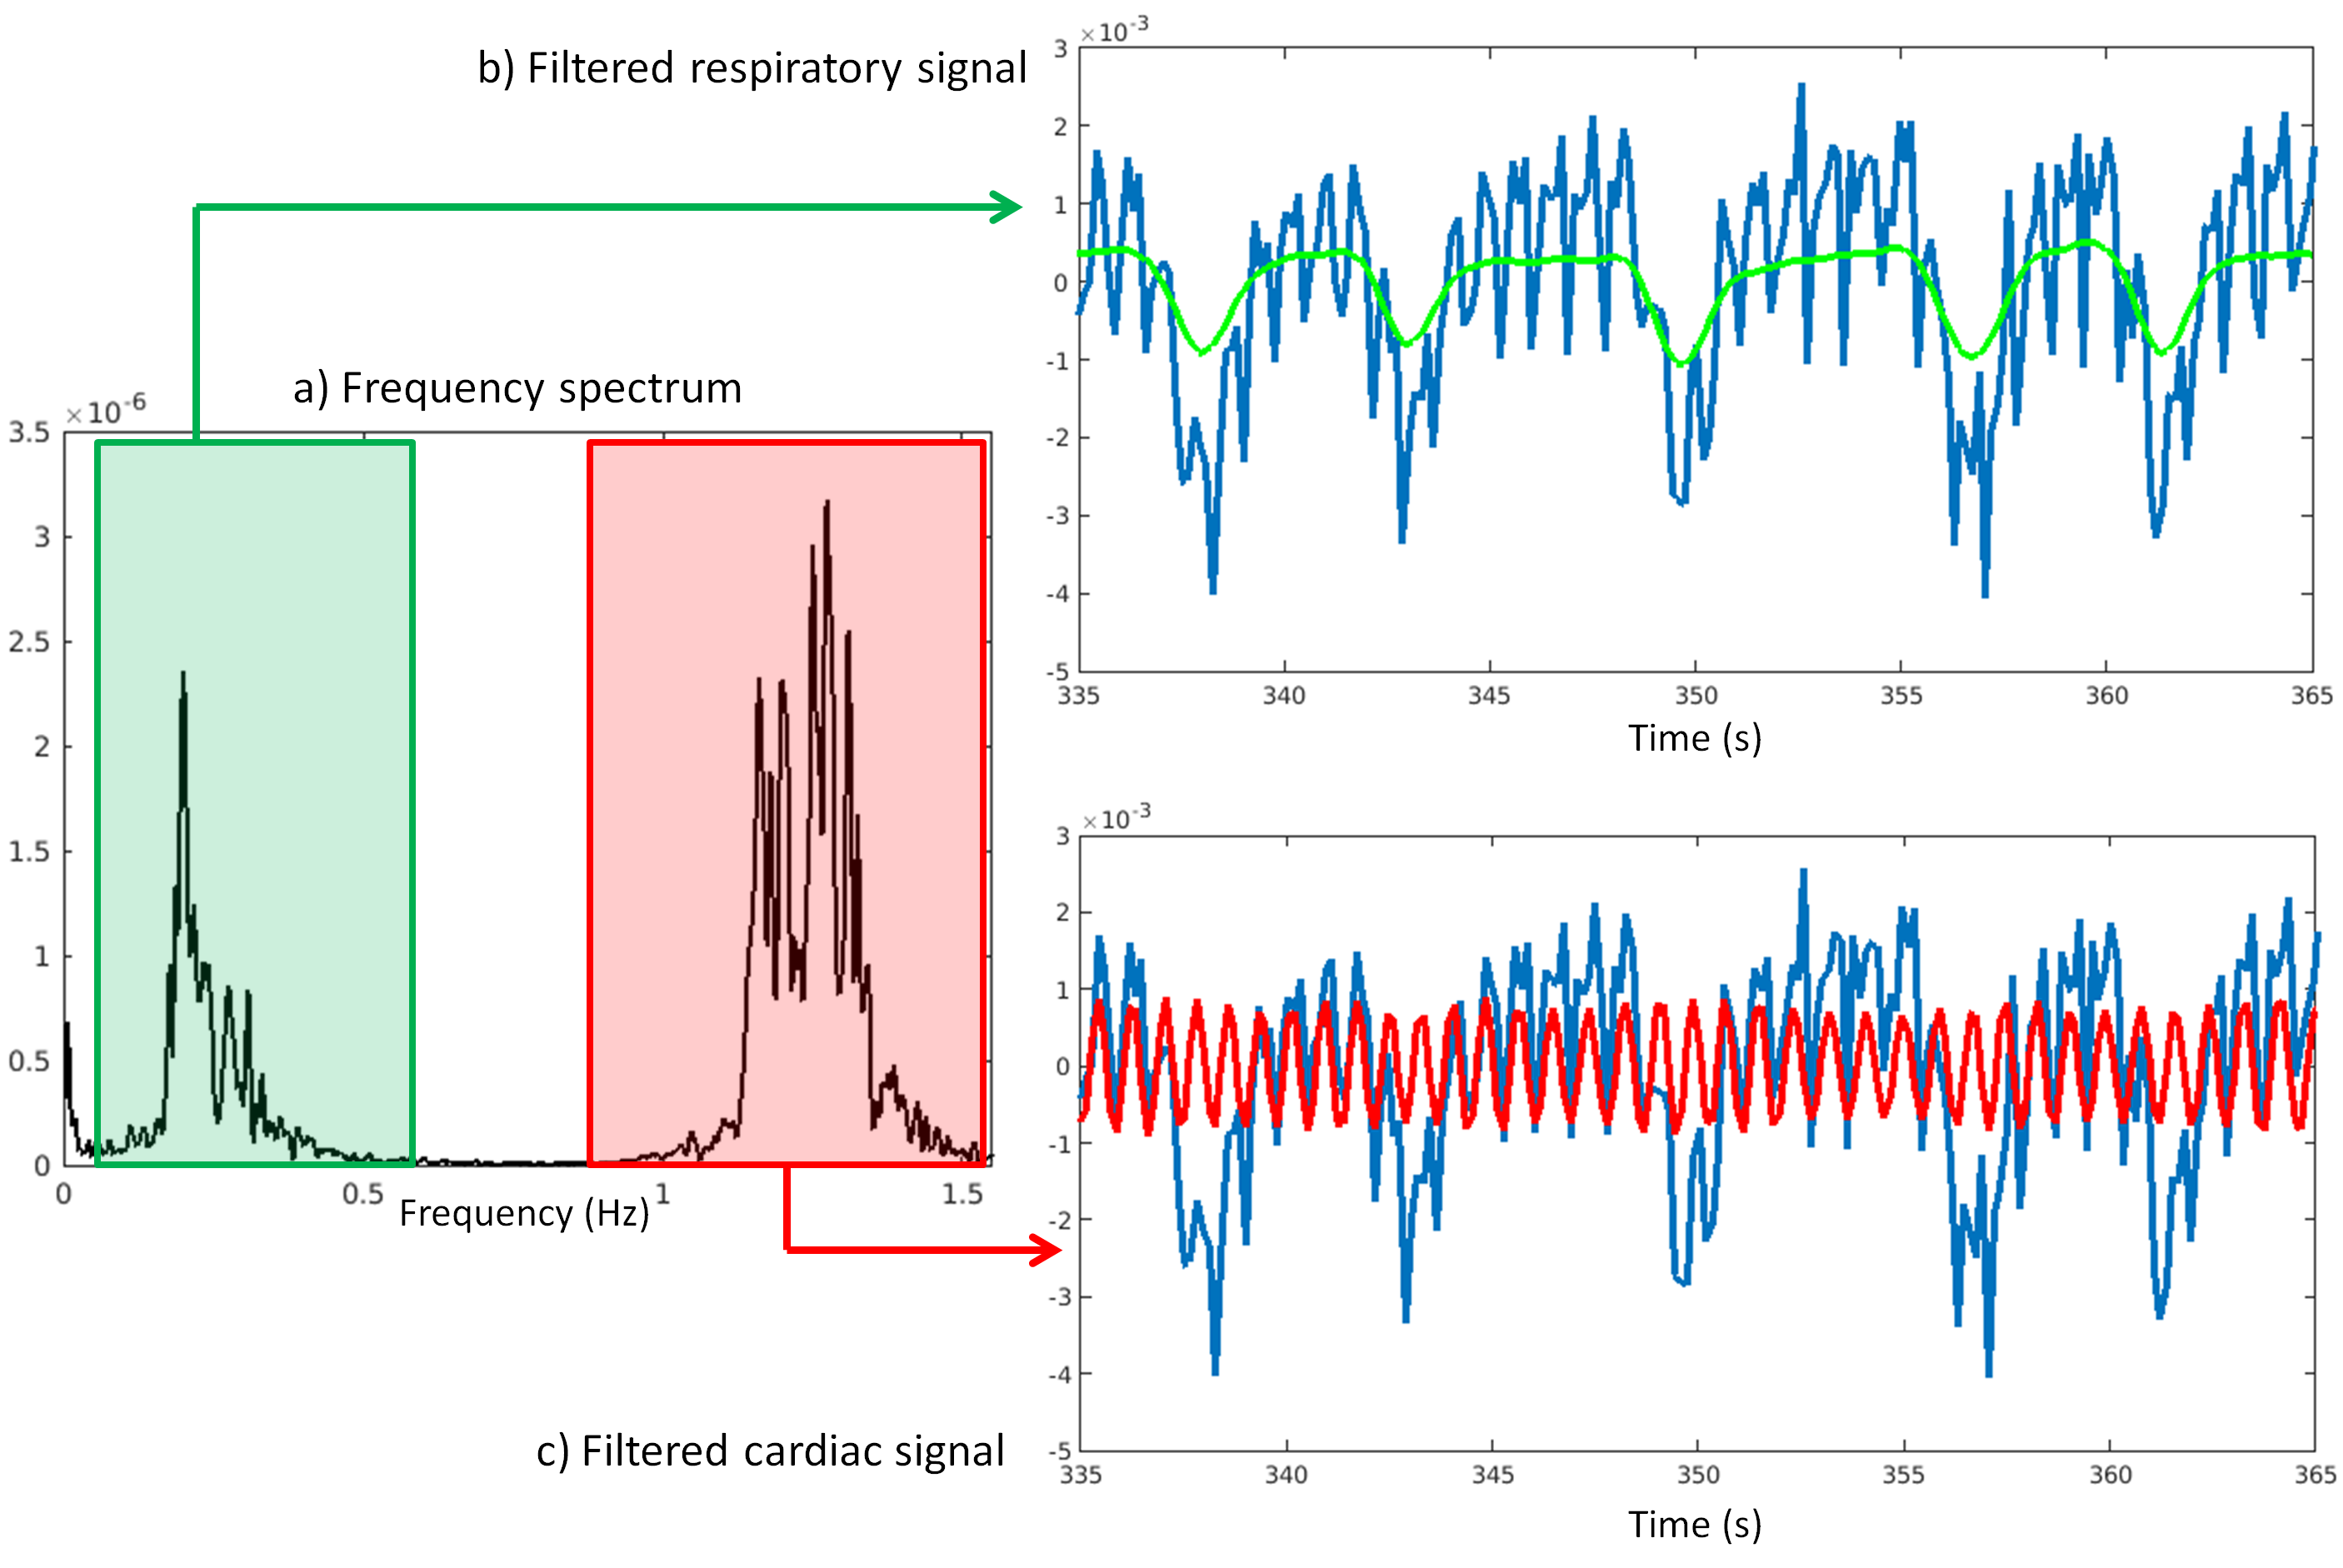
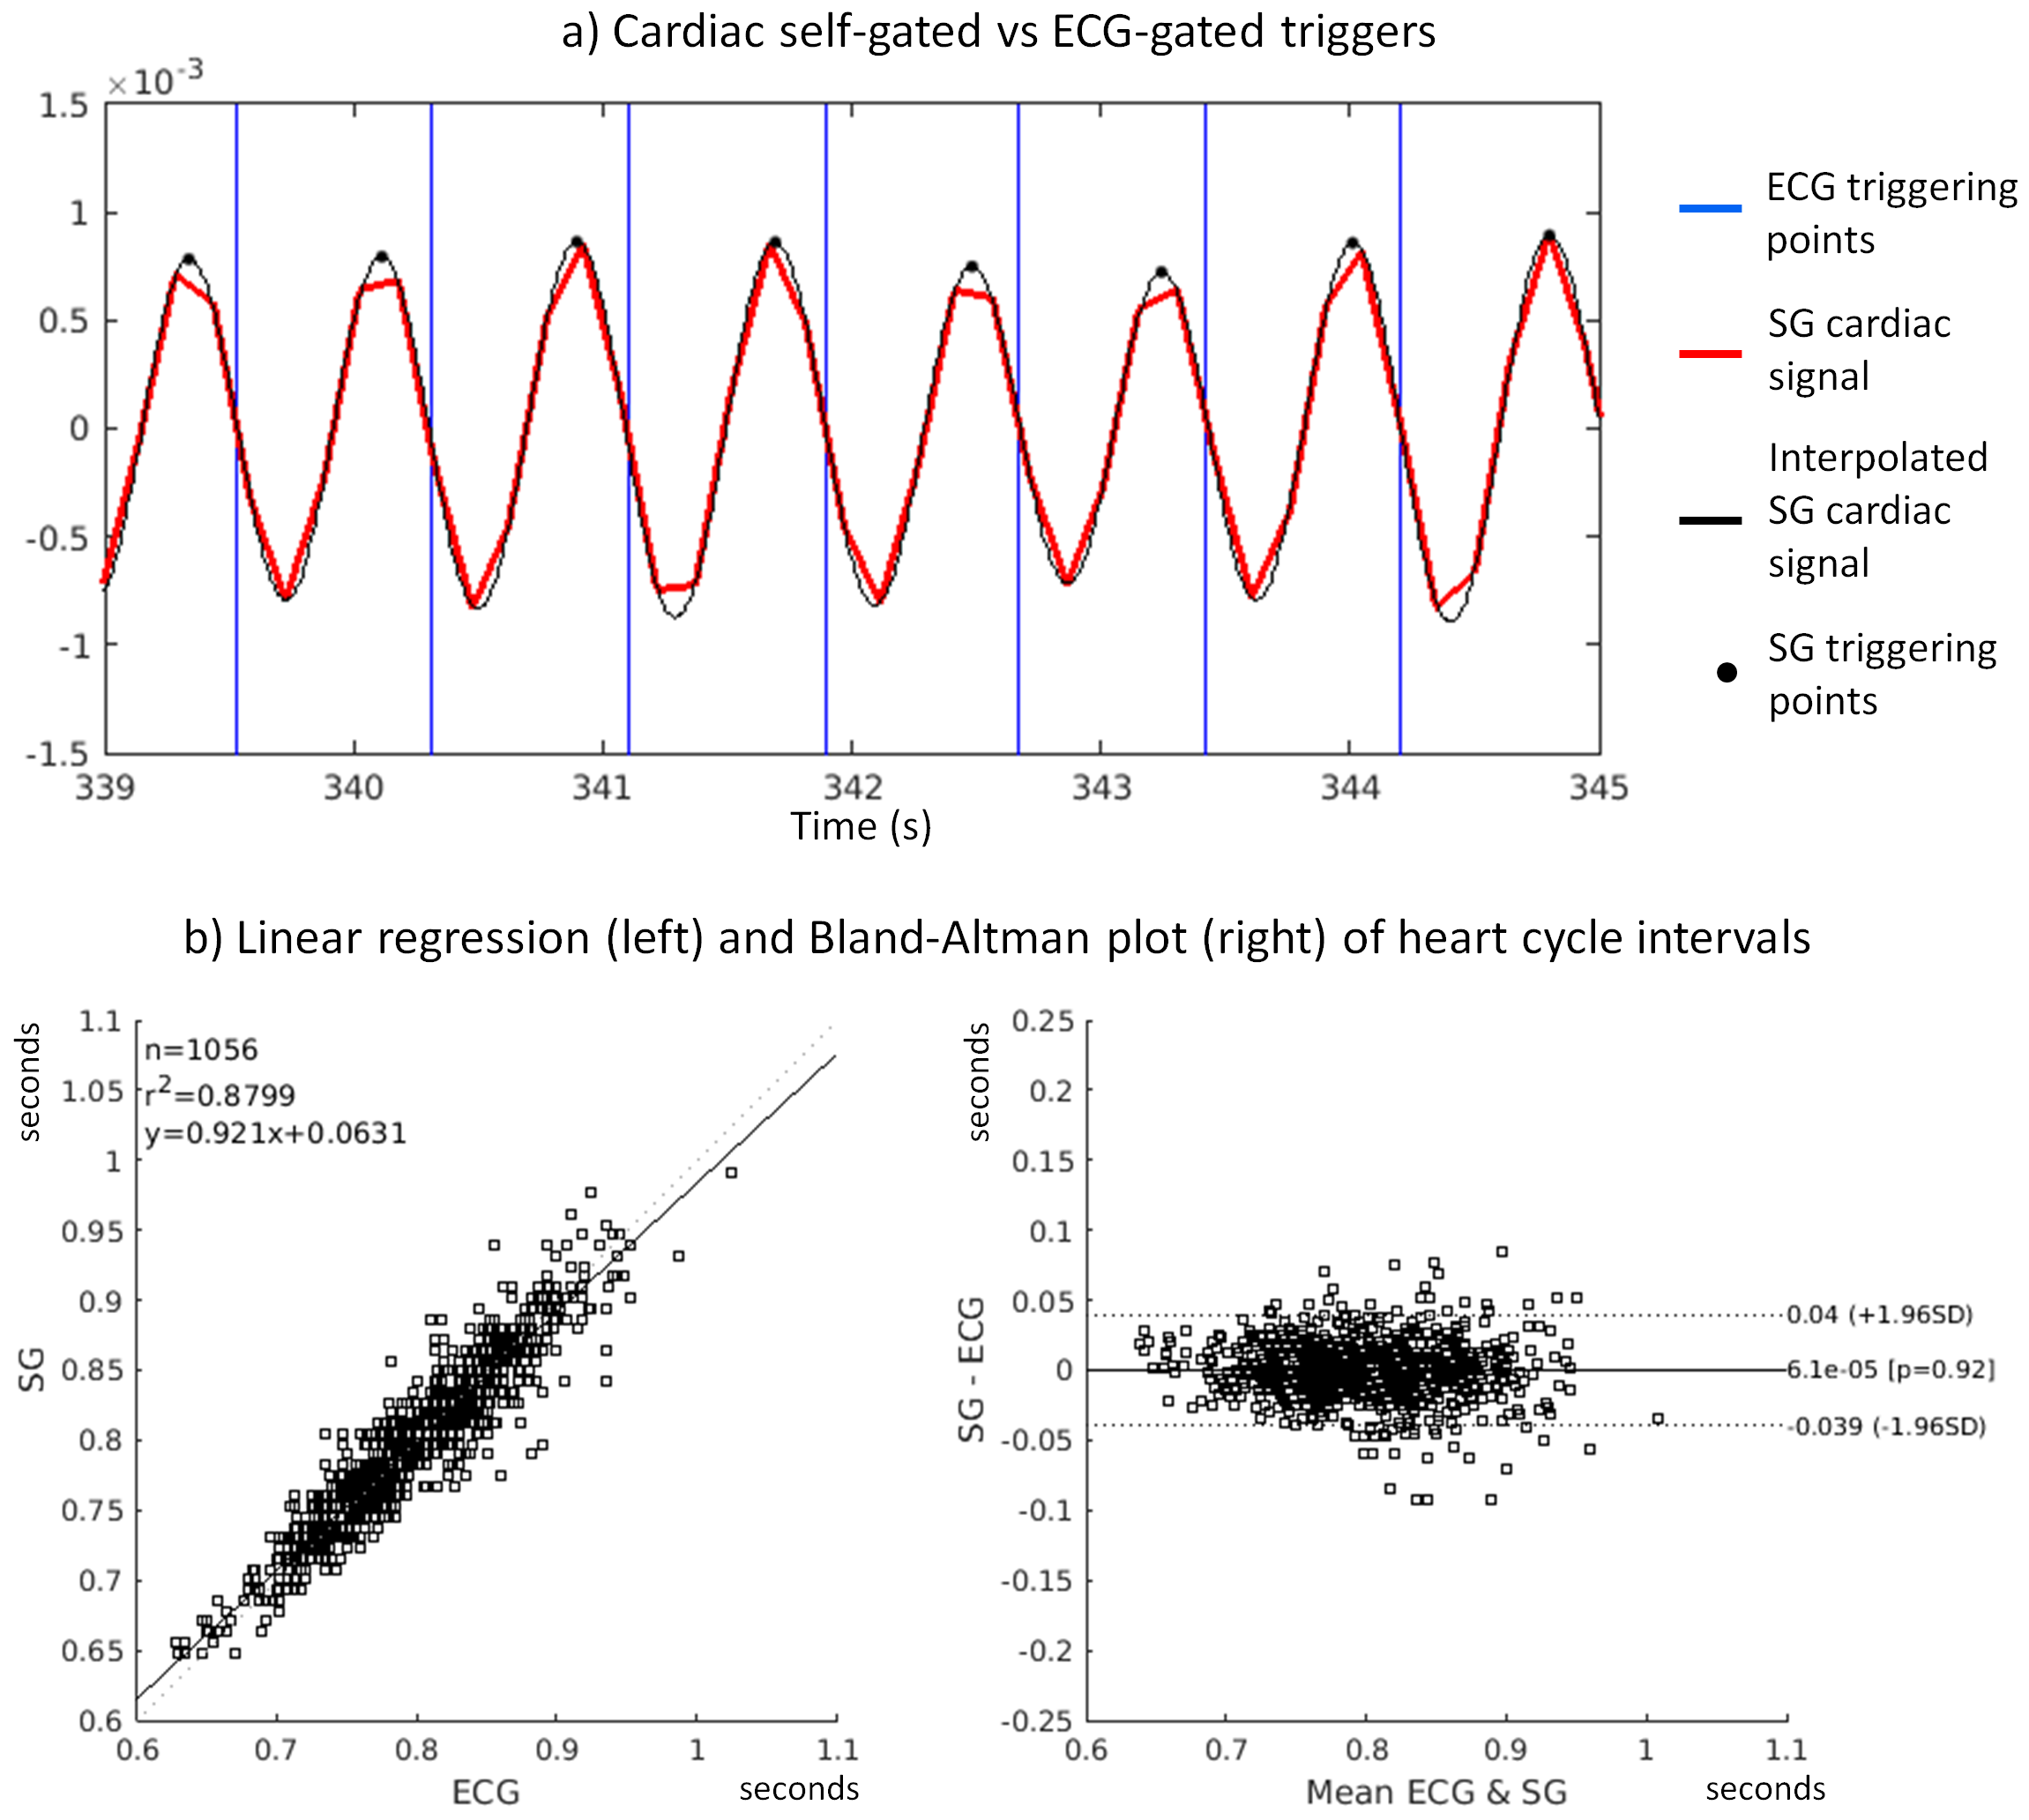
Data were acquired in N=9 healthy volunteers on a 1.5T clinical MRI scanner (MAGNETOM Aera, Siemens Healthcare) using a prototype non-ECG-triggered 3D golden angle radial bSSFP sequence4. The segmented acquisition used a Phyllotaxis radial sampling pattern5, where each segment was preceded by a chemically selective radiofrequency pulse for fat suppression, 10 linearly increasing RF preparation pulses, and one readout always oriented along the superior-inferior (SI) direction (Fig.1a,b). Two automated algorithms were compared for the extraction of cardiac and respiratory self-gating (SG) signals. The first method consists of Fourier transforming (FT) all SI readouts and applying principal component analysis (PCA) to the corresponding image space projections2 (Fig.1c). The second method directly extracts the SG signals from the modulation of the central coefficient of the k-space SI readouts6 (K0-modulation)(Fig.1b). The principal components and the modulated K0-signals were bandpass filtered (Fig.1d) to isolate the cardiac and respiratory motion signals by automatically detecting the subject’s specific frequency components (Fig.2). The principal component (for the PCA) or the coil element (for the K0-modulation) yielding the highest energy within the subject’s specific frequency bands were automatically selected. The filtered cardiac signal was then interpolated for finer detection of the signal peaks (Fig.3a). These peaks were considered as SG triggers points and compared with the R-wave time stamps from the ECG, which was recorded for reference during data acquisition. The number of skipped ECG triggering points was also recorded and reported for each dataset. The time intervals between two consecutive SG cardiac triggers were compared to their ECG counterparts using linear regression analysis and Bland-Altman plots. Of the two SG algorithms, only the most precise (i.e., smallest deviation from the ECG triggering points intervals) was considered for the final SG reconstruction. Cardiac SG and R-wave time stamps derived from the ECG were separately used to sort the acquired data into cardiac phases of 50 ms duration, while the SG respiratory signal, extracted from the K0-modulation, was used to resolve the data into 4 respiratory motion states in both cases. A k-t sparse SENSE algorithm allowed the reconstruction of undersampled 5D datasets7 (x-y-z-cardiac-respiratory dimensions). The reconstructed images were first compared by measuring vessel length and sharpness8 of the right coronary artery (RCA) and left anterior descending artery (LAD), then they were visually evaluated.RESULTS
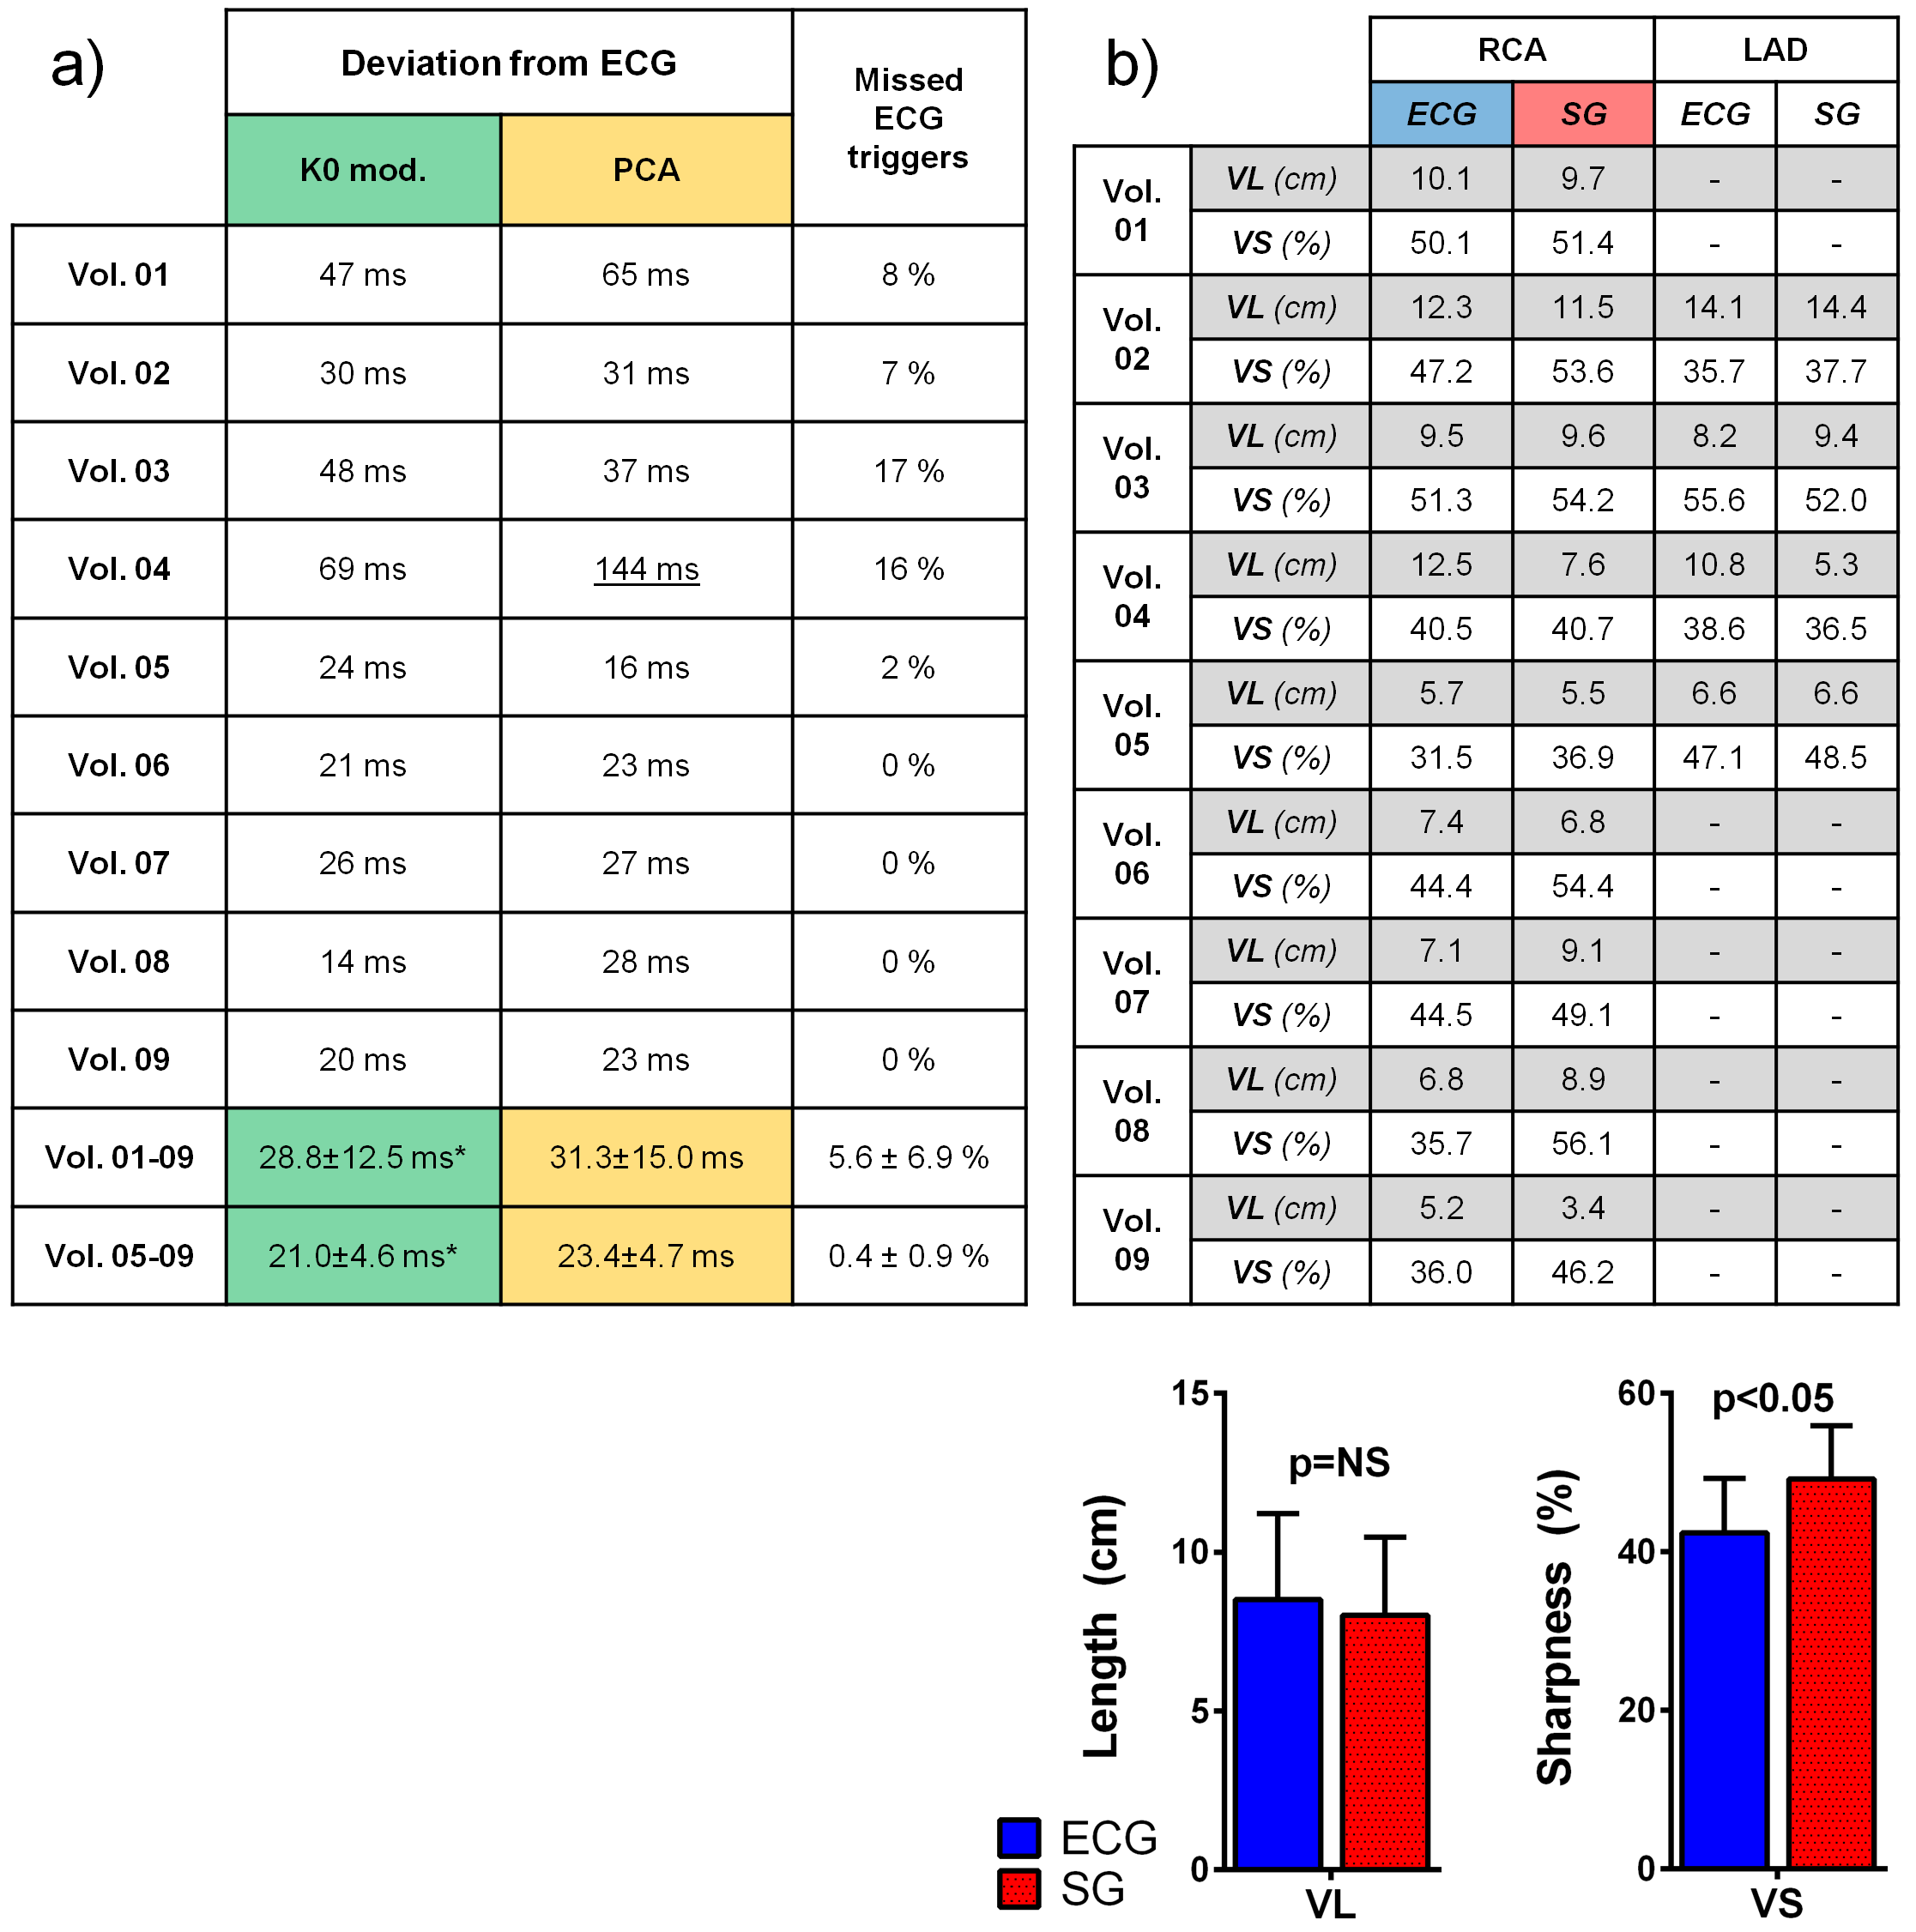
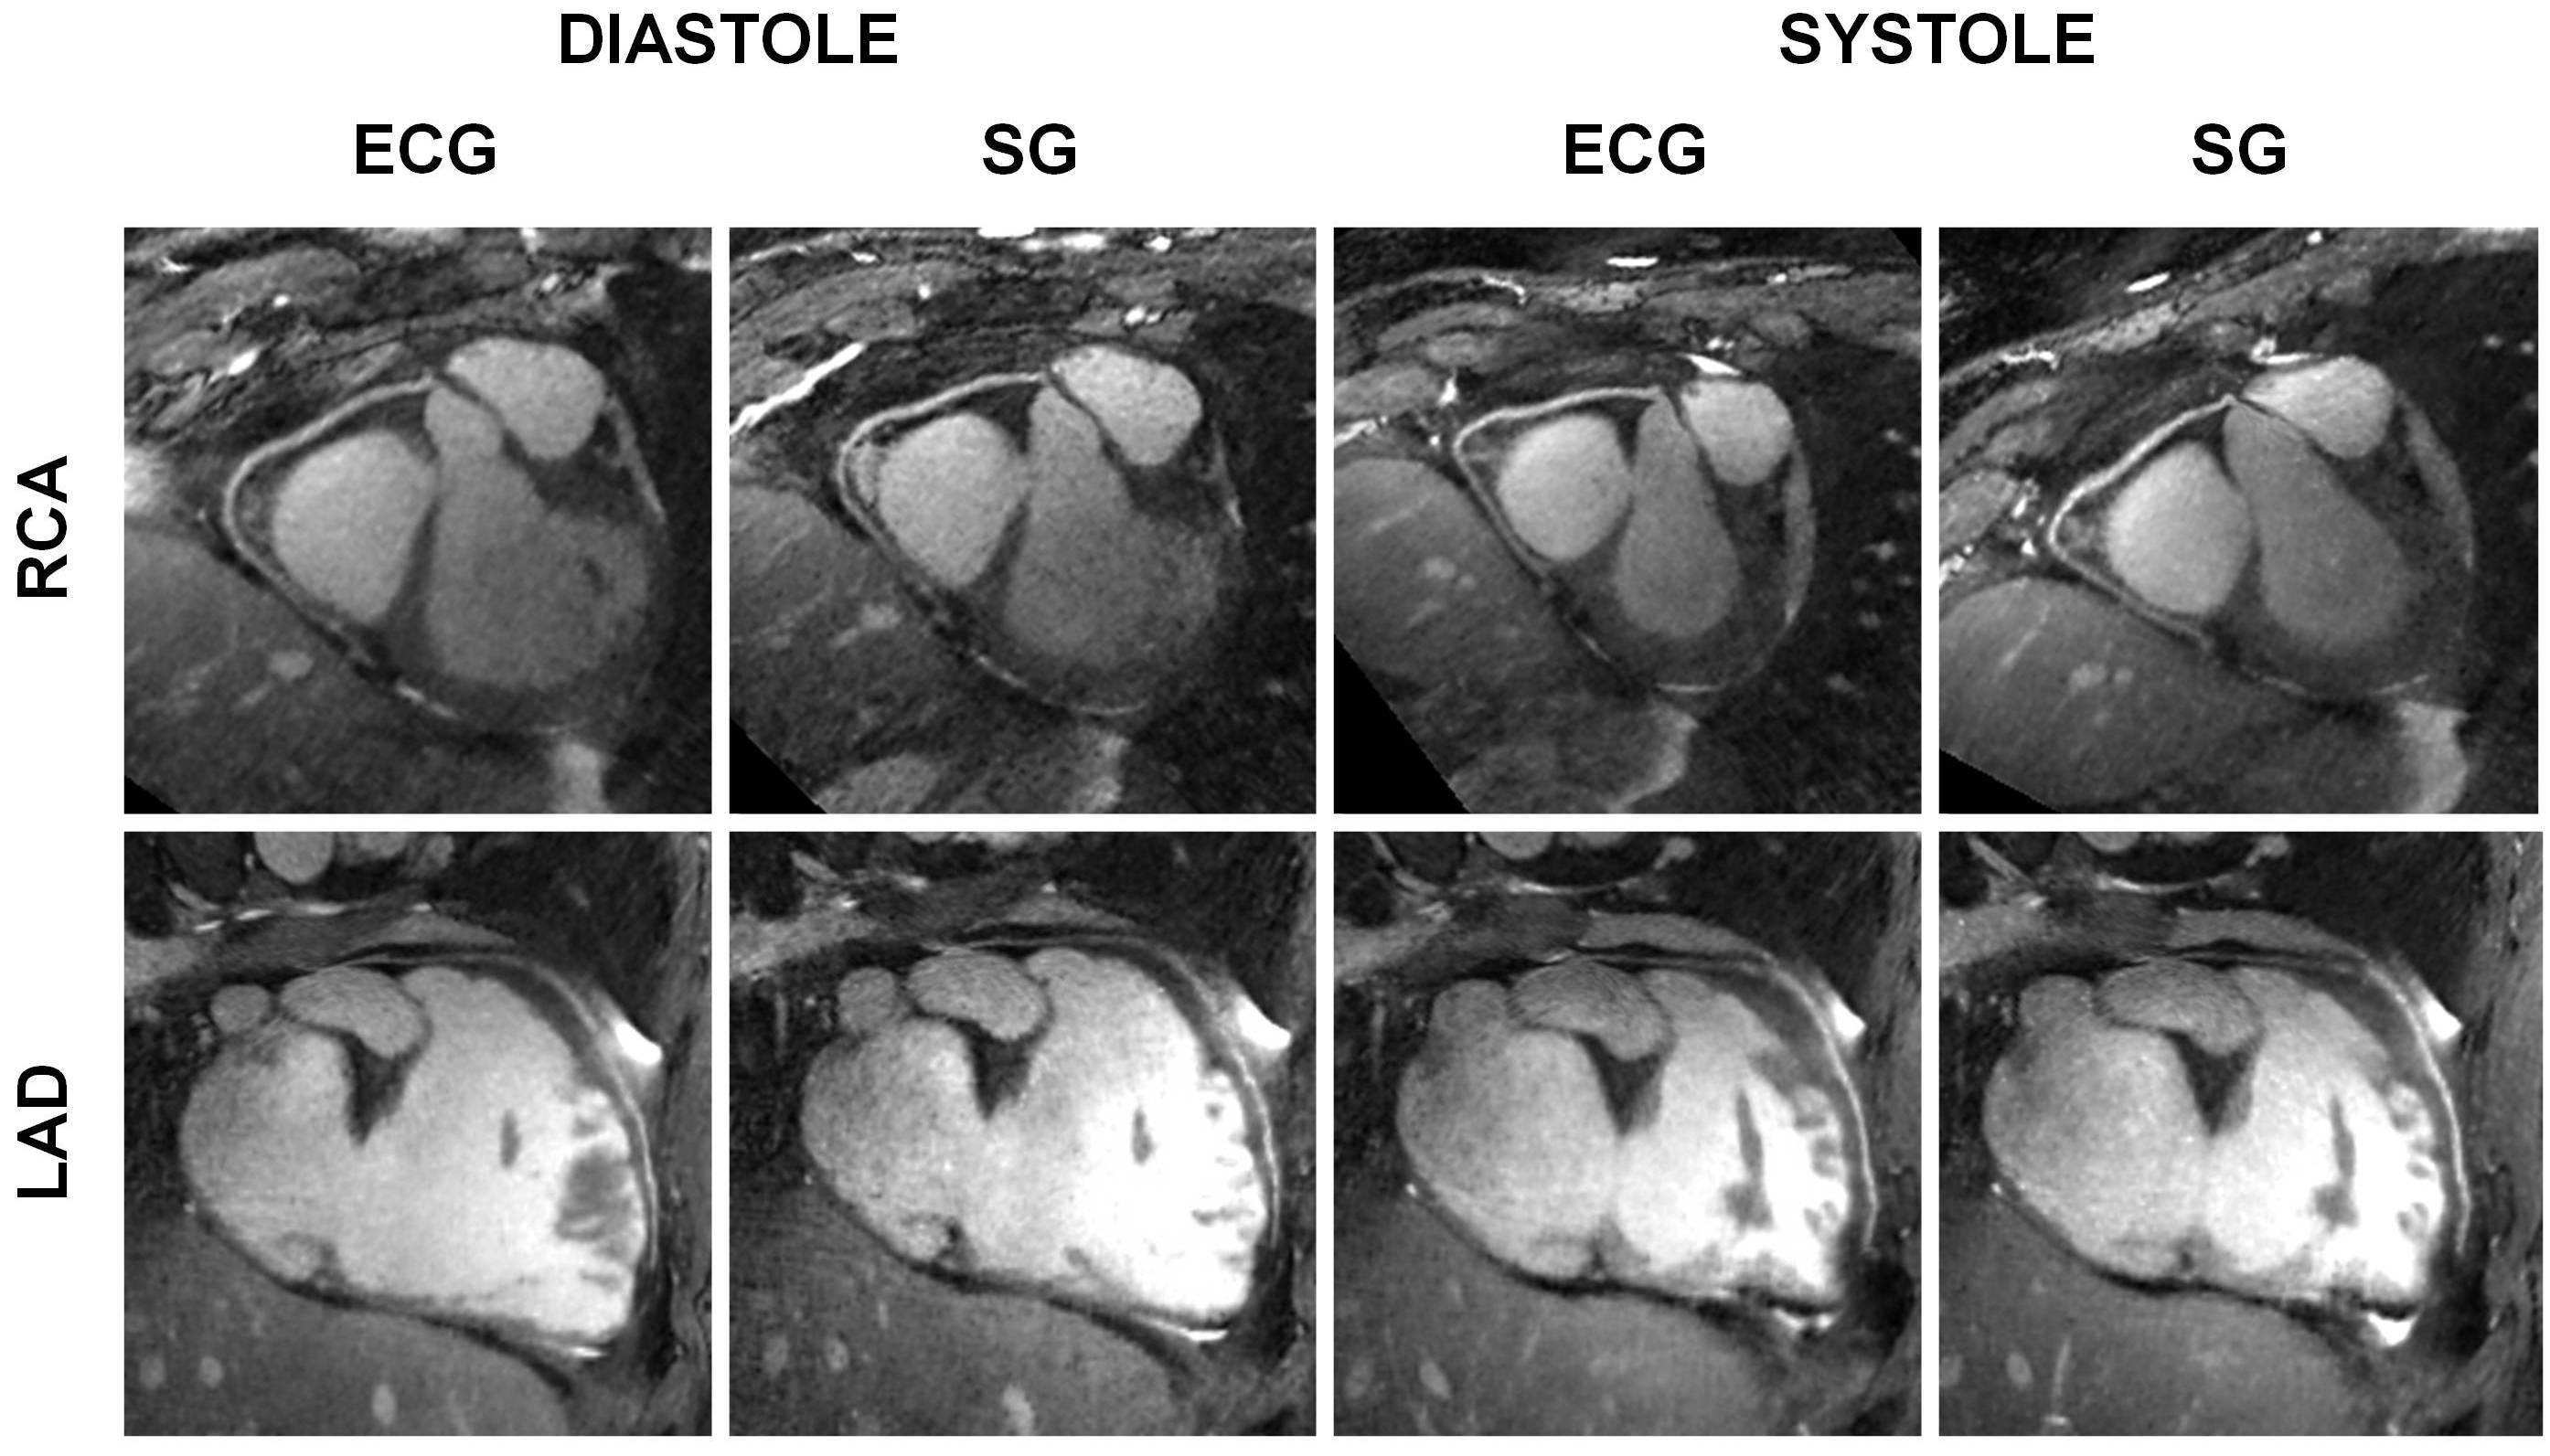
SG cardiac and respiratory motion signals were successfully extracted in all 9 volunteers with both algorithms (Fig.4a). Some ECG triggering points were missed in 5/9 volunteers (volunteers 1-5, Fig.4a). The SG cardiac intervals deviated from the reference ECG RR-intervals by an average of 28.8±12.5 ms and 31.3±15.0 ms for the K0-modulation and PCA algorithms, respectively (p=0.49). However, if only datasets with a maximum 2% of missing points are considered (volunteers 5-9), these values decrease to 21.0±4.6 ms and 23.4±4.7 ms (p=0.53), respectively (Fig.3b-4a). Because of the slightly better precision, the K0-modulation algorithm was chosen for the final SG reconstruction. The measurements of vessel length and sharpness (Fig.4b) and visual comparison of the overall image quality (Fig.5) showed good agreement between SG and the ECG-gated approach.DISCUSSION AND CONCLUSION
In the proposed framework for automated signal extraction, the SG cardiac triggers proved to be highly correlated with the reference ECG signal, especially with the K0-modulation approach. Unlike the ECG signal that is susceptible to skipped triggering points, the SG strategy is immune to magnetic perturbations. These preliminary results suggest that external ECG devices may no longer be necessary for gating of simultaneous functional and anatomical 3D scans of the heart. This would have positive implications on the ease-of-use and patient setup times, while the frequent need for repositioning of the electrodes is avoided altogether. However, further quantitative validations are now mandatory and the performance of this approach in patients with arrhythmias or frequent ectopic beats remains to be determined.Acknowledgements
The authors would like to acknowledge Dr. Florian Knoll from NYU School of Medicine for support with the GPU implementation of the 3D NUFFT. This work was partly supported by the Swiss National Science Foundation grants 320030_143923 and 326030_150828.References
1. Feng, L., Coppo, S., Piccini, D., Lim, R. P., Stuber, M., Sodickson, D. K. and Otazo, R. (2015), Five-Dimensional Cardiac and Respiratory Motion-Resolved Whole-Heart MRI. Presented to ISMRM 23rd Annual Meeting & Exhibition, 01 June 2015, Toronto, Ontario, Canada
2. Pang, J., Sharif, B., Fan, Z., Bi, X., Arsanjani, R., Berman, D. S. and Li, D. (2014), ECG and navigator-free four-dimensional whole-heart coronary MRA for simultaneous visualization of cardiac anatomy and function. Magn. Reson. Med., 72: 1208–1217. doi:10.1002/mrm.25450
3. Coppo, S., Feng, L., Piccini, D., Chaptinel, J., Bonanno, G., Vincenti, G., Schwitter, J., Otazo, R., Sodickson, D. K. and Stuber, M. (2015), Improved free-running self-navigated 4D whole-heart MRI through combination of compressed sensing and parallel imaging. Presented to ISMRM 23rd Annual Meeting & Exhibition, 01 June 2015, Toronto, Ontario, Canada
4. Coppo, S., Piccini, D., Bonanno, G., Chaptinel, J., Vincenti, G., Feliciano, H., van Heeswijk, R. B., Schwitter, J. and Stuber, M. (2015), Free-running 4D whole-heart self-navigated golden angle MRI: Initial results. Magn. Reson. Med., 74: 1306–1316. doi:10.1002/mrm.25523
5. Piccini, D., Littmann, A., Nielles-Vallespin, S. and Zenge, M. O. (2011), Spiral phyllotaxis: The natural way to construct a 3D radial trajectory in MRI. Magn. Reson. Med., 66: 1049–1056. doi:10.1002/mrm.22898
6. Larson, A. C., White, R. D., Laub, G., McVeigh, E. R., Li, D. and Simonetti, O. P. (2004), Self-gated cardiac cine MRI. Magn. Reson. Med., 51: 93–102. doi:10.1002/mrm.10664
7. Feng, L., Axel, L., Chandarana, H., Block, K. T., Sodickson, D. K. and Otazo, R. (2016), XD-GRASP: Golden-angle radial MRI with reconstruction of extra motion-state dimensions using compressed sensing. Magn. Reson. Med., 75: 775–788. doi:10.1002/mrm.25665
8. Etienne, A., Botnar, R. M., van Muiswinkel, A. M.C., Boesiger, P., Manning, W. J. and Stuber, M. (2002), “Soap-Bubble” visualization and quantitative analysis of 3D coronary magnetic resonance angiograms. Magn. Reson. Med., 48: 658–666. doi:10.1002/mrm.10253
Figures