3145
Cardiac function relation to preload variation based on free breathing motion1Radiology, New York University School of Medicine, New York, NY, United States, 2Nuclear Medicine Ward, Pitié Salpétrière Hospital, Paris, Paris, France, 3Fraunhofer MEVIS, Germany
Synopsis
Free-breathing cardiac cine MRI provides novel information on cardiac dynamics. In this work, we investigate the relation between cardiac function and
Purpose
Recently developed multi-dimensional MRI techniques enable the assessment of cardiac function under free breathing, as well as the independent analysis of cardiac and respiratory motion. Breathing induces changes in thoracic pressure, with associated variations in venous return, which cause small modulations in the interventricular septum position, including changes in the diameter of the left ventricle (LV). These changes cause normal preload variations for corresponding heart beats. In this study, we tracked the relative septum displacement during the cardiac cycle for multiple respiratory phases, to measure preload variation and cardiac function response in a small series of normal subjects, patients with reduced ejection fraction (EF), with volume-loaded right ventricle (RV), and with asymmetric septal hypertrophy or diffuse hypertrophy.Methods
We previously acquired single-slice images with the XD-GRASP1 (eXtra-Dimension-Golden-Angle-Radial-Sparse-Parallel) technique 2D radial golden-angle SSFP (TR/TE=2.8/1.4ms, spatial resolution=2×2×8mm) at 1.5T (Avanto, Siemens), in a series of routine cardiac MRI examinations. The images were acquired in short-axis mid-ventricle position under free-breathing for an acquisition time=23s.
Breathing and cardiac motion-related signals were separately extracted from the image data post-acquisition. The acquired data were sorted into 9 cardiac and 9 respiratory phases, which were jointly reconstructed as two extra dimensions for the 4D image space (Figure 1). We analyzed a subset of these patient data: 11 normal subjects (N), 9 with reduced EF (reducedEF) without left bundle branch block or infarction, 8 with volume-loaded RV from pulmonary or tricuspid valve regurgitation (RVvl), 5 with asymmetric hypertrophic septum (aHyp), and 3 with diffuse hypertrophy (dHyp).
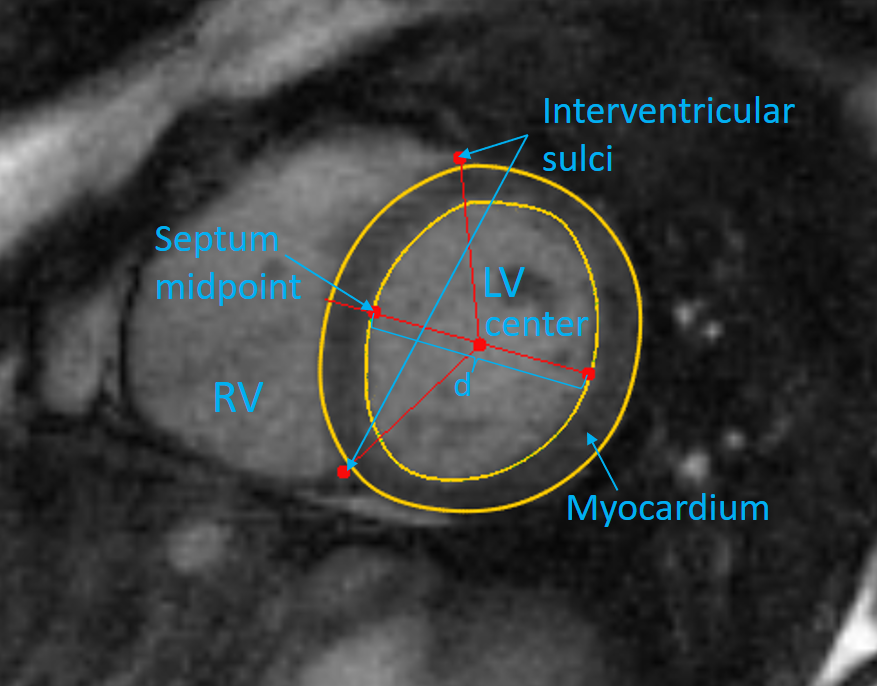
We analyzed the variation of cardiac function by measuring the LV diameter through the septum midpoint over the cardiac and respiratory cycles. To ensure correspondence of the diameter position throughout the cardiac-respiratory variations, the LV myocardium was automatically segmented2 and manually corrected, and the RV was automatically detected, based on which the midpoint$$$~S~$$$of the septum was located (Figure 2).
The LV diameter through $$$S$$$,$$$~d_{c,r}$$$, was calculated for each cardiac $$$c$$$ and respiratory $$$r$$$ frame. The end-diastolic diameter $$$d_{ED,r}$$$ represents a measure of LV preload, with the relative end-systolic (ES) shortening measuring the ejection. As a 1D measure of cardiac function, the normalized relative change in diameter $$$cd_r=(d_{ED,r}–d_{ES,r})/d_{ED,r}$$$ was computed for each respiratory phase.
Results
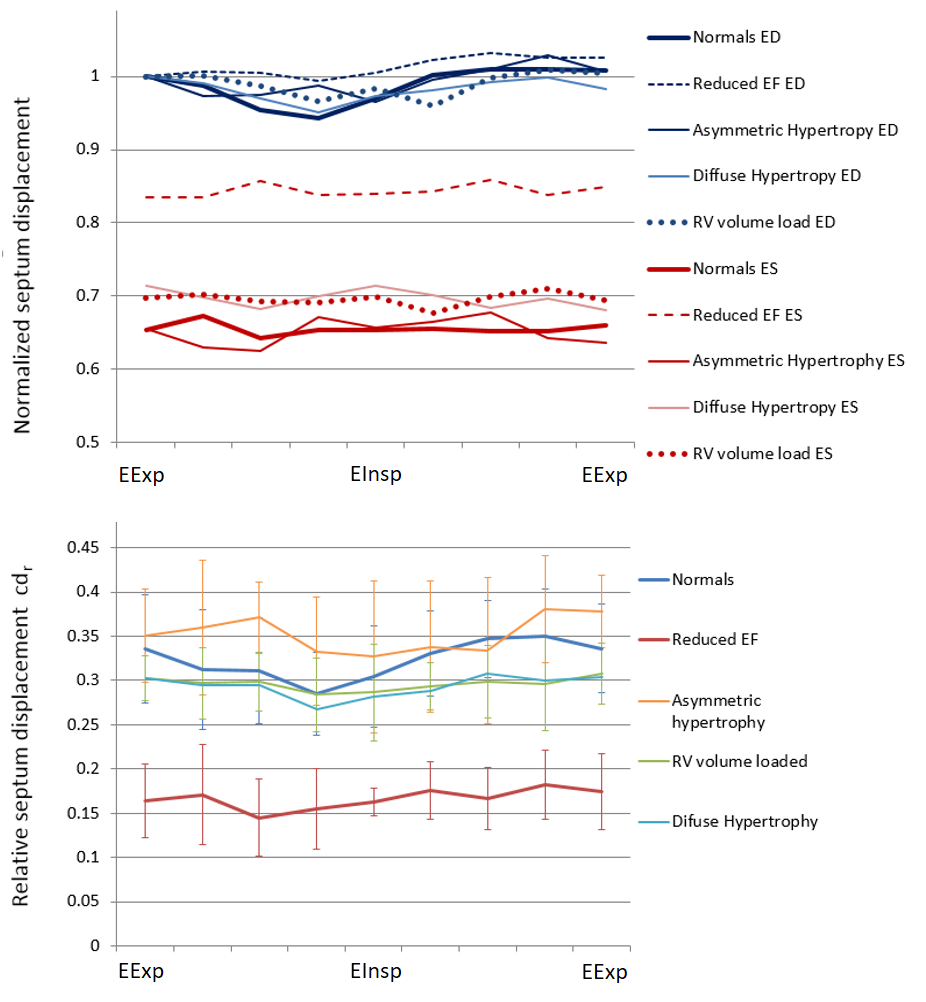
The LV diameters at ED and ES, as well as the relative change in diameter$$$~cd_{r}$$$, were plotted for all respiratory phases for all subject groups (Figure 3). The change in diameter between end-expiration and end-inspiration respiratory phases was significantly larger for N compared to the other patients (5.8±3.6% vs. 2.5±3.4%, p=0.035).
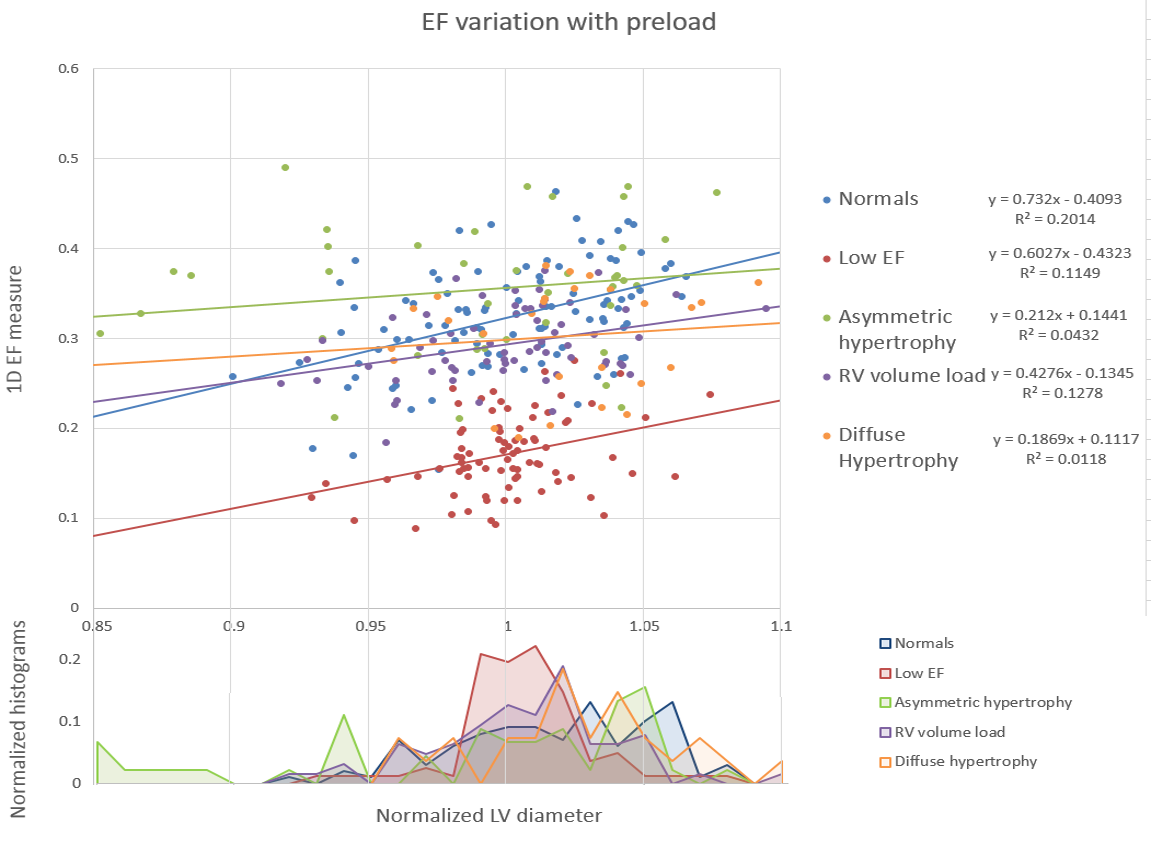
$$$cd_{r}~$$$was plotted against$$$~d_{ED,r}~$$$normalized to the average diameter for all respiratory phases (Figure 4). Patients have less relative variation in the diameter than normals, as shown in the histogram. The average correlation factor between $$$cd_{r}~$$$and$$$~d_{ED,r}$$$ was 0.45 for N (p<0.001), but a lower 0.35 for reducedEF, 0.35 for RVvl, 0.16 for aHyp, and 0.10 for dHyp. The average slope of the linear regression was 0.73 for N, higher than 0.60 for reducedEF, 0.43 for RVvl, 0.21 for aHyp, and 0.19 for dHyp patients.
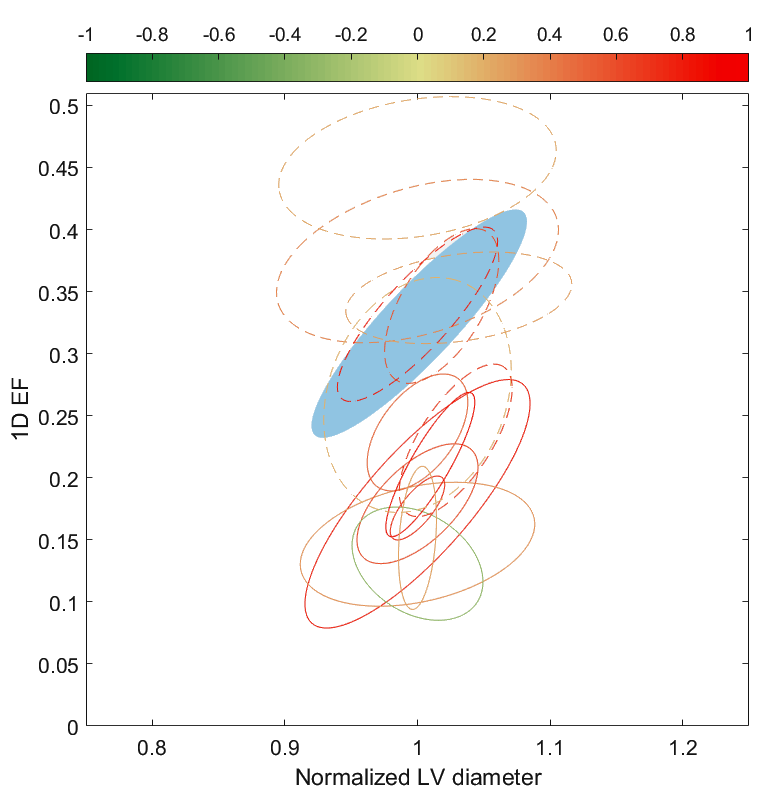
To visualize the relation between cardiac function and preload we used elliptic glyphs (Figure 5). The ellipses are defined using principal component analysis of the $$$cd_{r}~$$$by$$$~d_{ED,r}$$$ datapoints for each subject. The first principal component (major axis) shows the direction of highest cross-correlation, while the second principal component (minor axis) shows the variability across this direction. An average ellipse was computed for all N, for reference.
Discussion and Conclusion
Free-breathing cardiac cine MRI provides novel information on cardiac dynamics. The relative position of the septum is modulated during respiration by the normally varying preload due to changes in thoracic pressure. The LV diameter at end-diastole varies significantly with respiration for normals, but less so for reducedEF, for volume-loaded RV, and hypertrophy patients, while end-systolic diameter remains relatively constant during breathing.
The relative change in diameter$$$~cd_r~$$$decreases during inspiration and increases during expiration for normal subjects, with a significant correlation between LV diameter and preload. However, this mechanism is decreased for patients with reduced contractility, for patients with a hypertrophic myocardium, and for patients with volume loaded RV. The modulation was less affected for aHyp patients compared to dHyp, which have more extensive myocardium alterations.
The relation between (1D) EF and preload for individual patients compared to a normal reference can be assessed using elliptic glyphs. Some patients show a reduced correlation (circular ellipse), presumably due to a stiffer myocardium, while for others the correlation between EF and preload is partially preserved despite a lower EF, possibly indicating an earlier stage of disease; this will be further investigated in future work.
Acknowledgements
We thank NIH for the funding for this project (Grant numbers: NIH R21-EB109595-01).References
1. Feng L, Axel L, Chandarana H, Block KT, Sodickson DK, Otazo R. XD-GRASP: Golden-angle radial MRI with reconstruction of extra motion-state dimensions using compressed sensing. Magnetic resonance in medicine. 2016 Feb 1;75(2):775-88.
2. Chitiboi T, Hennemuth A, Tautz L, Huellebrand M, Frahm J, Linsen L, Hahn H. Context-based segmentation and analysis of multi-cycle real-time cardiac MRI. In2014 IEEE 11th International Symposium on Biomedical Imaging (ISBI) 2014 Apr 29 (pp. 943-946). IEEE.
Figures