3144
Left ventricular-arterial coupling and mechanical efficiency assessed by pressure-volume loop in pulmonary artery hypertension patients1National Heart Centre Singapore, Singapore, Singapore, 2West China Medical Centre of Sichuan University, People's Republic of China, 3Wuhan Union Hospital, Tongji Medical College, Huazhong University of Science and Technology, Wuhan, People's Republic of China, 4Department of Cardiology, Second Clinical College of Wuhan University, WuHan, People's Republic of China, 5WuHan Asia Heart Hospital, People's Republic of China, 6Duke-NUS Medical School Singapore, Singapore, Singapore
Synopsis
Left ventricular end-systolic elastance (Ees), arterial elastance (Ea) and ventricular arterial coupling (VAC) (ratio of Ea/Ees) has been considered “gold” standard to assess ventricular contractility and performance. Ventricular arterial uncoupling due to impaired Ees or augmented Ea impaired ventricular mechanical efficiency (ME) and cardiac output. Ventricular contractility and arterial loading and the degree of their mismatching have yet been studied in pulmonary hypertension (PH). A total of 42 PH subjects who underwent both cardiac magnetic resonance (CMR) and right heart catheterization (RHC) were categorized into three groups – preserved LV ejection fraction (LVEF > 50%) and VAC < 0.8 (group 1); preserved LVEF and VAC > 0.8 (group 2); reduced LVEF (< 50%) (group 3). The results showed that VAC was correlated negatively with ME, which indicated arterial-ventricular uncoupling impaired mechanical efficiency. Importantly, the group 2 with ventricular arterial uncoupling had impaired mechanical efficiency despite its preserved ejection fraction.
Background and Purpose
Pulmonary hypertension (PH) is defined by a mean pulmonary artery pressure mPAP ≥ 25 mmHg at rest and invasive right heart catheterization (RHC) is considered as gold standard for PH diagnosis1. Cardiac magnetic resonance (CMR) imaging had emerged as golden standard for quantitative assessment of ventricular volume and function due to its superior imaging contrast and quality. Left ventricular-arterial coupling (ratio of arterial elastance to end-systolic elastance) by combining standard RHC and CMR (single-beat pressure-volume analysis) has less been studied for this cohort. In particular, for PH patients with preserved EF, its ventricular-arterial coupling and mechanical efficiency are still unknown.Methods
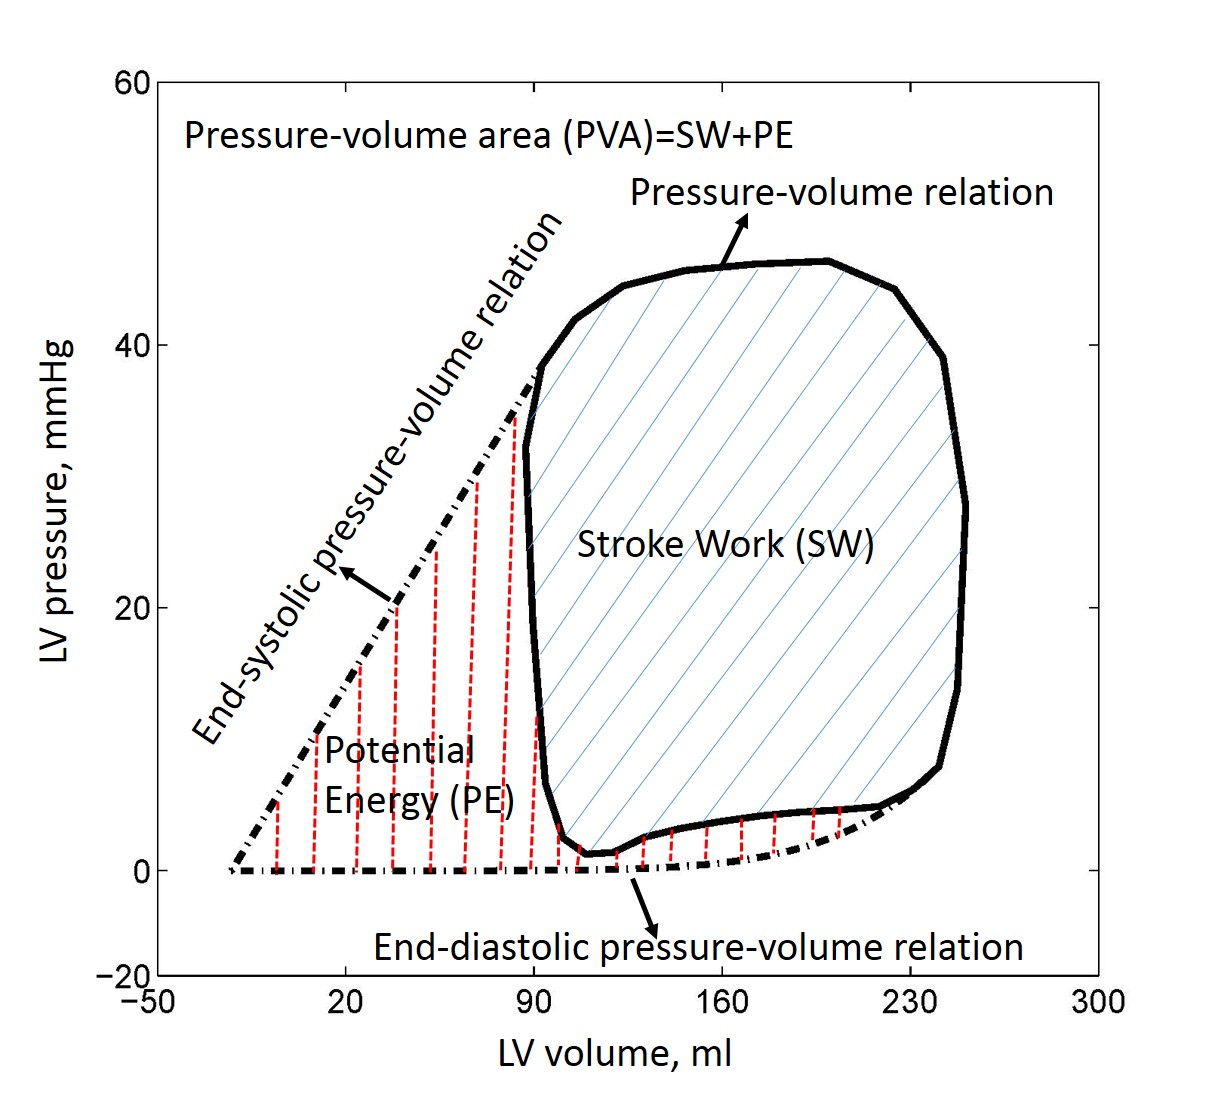
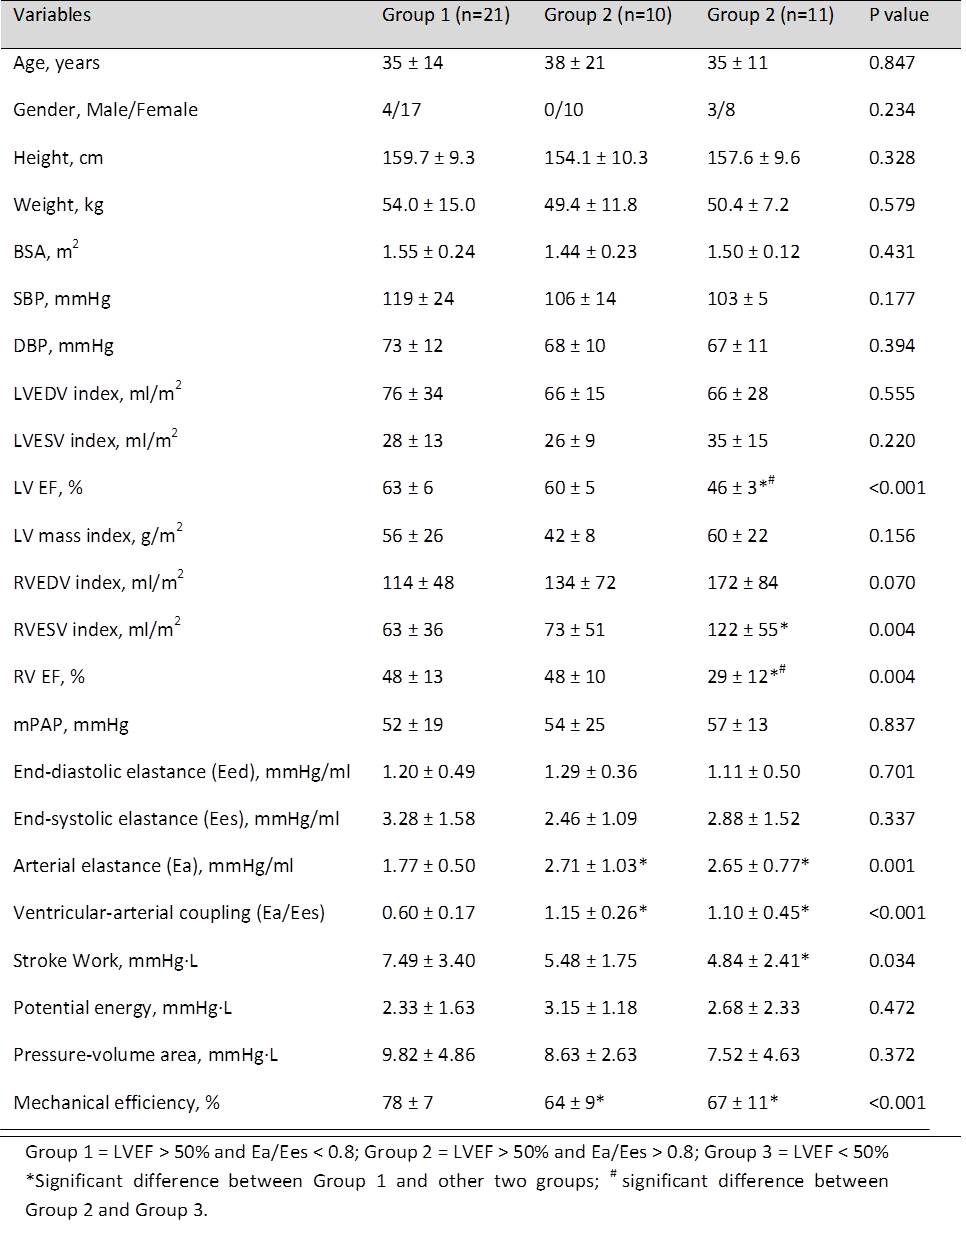
CMR scans and RHC were performed in 42 pulmonary hypertension patients. Left ventricular (LV) volume curve during cardiac cycle was calculated using stacks of short axis and long axis images in CMRTools. To compensate the beat-to-beat variations, the calculated LV pressures were averaged over three consecutive stable heart beats. The pressure-volume relation (PVR) can be generated as shown in Fig. 1. The slope of end-systolic pressure-volume relation (ESPVR) - end-systolic elastance (Ees), was evaluated using single-beat method proposed by Shishido, which only required pressure values, systolic time interval and stroke volume (SV)2. Arterial elastance (Ea) – arterial load and stiffness index, was equal to the ratio of ventricular systolic pressure divided by SV3. Ventricular-arterial coupling (VAC) then was calculated as: VAC=Ea/Ees. End-diastolic elastance (Eed) was computed following the procedure in Nature Protocol by single beat4. Stroke work (SW) was determined as the area of the pressure-volume loop, which represents the external work performed by the ventricle (covered by blue solid lines in Fig. 1). Pressure-volume area (PVA), a measure of total mechanical work, was calculated as the sum of stroke work and potential energy, which is quantified by the area (covered by red dash lines in Fig. 1) enclosed by PVR, ESPVR, and end-diastolic pressure-volume relation (EDPVR)5. Mechanical efficiency (ME) was calculated as the ratio of SW and PVA: ME=SW/PVA6 (see Fig. 2). We divided all subjects into three groups based on the LVEF and Ea/Ees ratio of 0.87: Group 1 = LVEF > 50% and Ea/Ees < 0.8 [n = 21]; Group 2 = LVEF > 50% and Ea/Ees > 0.8 [n =10]; Group 3 = LVEF < 50% [n = 11]. Data was analysed using SPSS (version 17.0, Chicago, IL, USA). One-way ANOVA with post hoc Games Howell test was used to examine the significance between each group. A P value < 0.05 was considered statistically significant.Results
The demographics for all patients were tabulated in Table 1. The right ventricular (RV) EF in Group 3 was signifcantly smaller than Group 1 and Group 2 (29 ± 12% vs. 48 ± 13% and 48 ± 10%, P < 0.05). Compared with Group 1 (Ea/Ees = 0.60 ± 0.17), Group 2 (1.15 ± 0.26) and Group 3 (1.10 ± 0.45) had significantly larger VAC and lower ME (Group 1: 78 ± 7% vs. Group 2: 64 ± 9% and Group 3: 67 ± 11%). Fig. 3 showed an excellent negative correlation between ventricular-arterial coupling and mechanical efficiency (r = -0.88, P < 0.001).Conclusions
The study suggests that ventricular arterial coupling (Ea/Ees ratio) is negatively correlated with mechanical efficiency in pulmonary hypertension patients. In patient with preserved ejection fraction and ventricular-arterial uncoupling, the mechanical efficiency is most impaired.Acknowledgements
No acknowledgement found.References
1. Hoeper MM, Bogaard HJ, Condliffe R, Frantz R, Khanna D, Kurzyna M, Langleben D, Manes A, Satoh T, Torres F, Wilkins MR, Badesch DB. Definitions and diagnosis of pulmonary hypertension. J Am Coll Cardiol. 2013 Dec 24;62(25 Suppl):D42-50.
2. Shishido T, Hayashi K, Shigemi K, Sato T, Sugimachi M, Sunagawa K. Single-beat estimation of end-systolic elastance using bilinearly approximated time-varying elastance curve. Circulation. 2000 Oct 17;102(16):1983-9.
3. Kelly RP, Ting CT, Yang TM, Liu CP, Maughan WL, Chang MS, Kass DA. Effective arterial elastance as index of arterial vascular load in humans. Circulation. 1992 Aug;86(2):513-21.
4. Klotz S, Dickstein ML, Burkhoff D. A computational method of prediction of the end-diastolic pressure-volume relationship by single beat. Nat Protoc. 2007;2(9):2152-8.
5. Suga H, Yasumura Y, Nozawa T, Futaki S, Igarashi Y, Goto Y. Prospective prediction of O2 consumption from pressure-volume area in dog hearts. Am J Physiol. 1987 Jun;252(6 Pt 2):H1258-64.
6. Nozawa T, Yasumura Y, Futaki S, Tanaka N, Uenishi M, Suga H. Efficiency of energy transfer from pressure-volume area to external mechanical work increases with contractile state and decreases with afterload in the left ventricle of the anesthetized closed-chest dog. Circulation. 1988 May;77(5):1116-24.
7. Asanoi H, Sasayama S, Kameyama T. Ventriculoarterial coupling in normal and failing heart in humans. Circ Res. 1989 Aug;65(2):483-93.
Figures