3139
Automated Coronary Artery Ostia Detection in Magnetic Resonance Angiography1Pattern Recognition Lab, Department of Computer Science, Friedrich-Alexander-Universität Erlangen-Nürnberg, Erlangen, Germany, 2Magnetic Resonance, Siemens Healthcare GmbH, Erlangen, Germany, 3Erlangen Graduate School in Advanced Optical Technologies (SAOT), Friedrich-Alexander-Universität Erlangen-Nürnberg, Erlangen, Germany
Synopsis
Anomalies of the coronary ostia can have severe consequences. To provide a screening solution, automated ostia detection based on single breath-hold coronary MRA scans is presented. The aorta is segmented in the data sets to serve as an orientation point and vesselness enhancing filters are applied. Searching the aorta surface for high vessel responses by a ray-tracing procedure yields information about the position of the coronary ostia. The proposed approach was successfully validated in 10 volunteers with an average deviation of $$$7.6 \pm 1.0$$$° in angular and $$$1.2 \pm 0.58$$$ mm in superior-inferior direction.
Introduction
Among all cardiovascular diseases, coronary artery anomalies are the major risk factor that may lead to sudden cardiac death1. Because the high-take-off anomaly2 is asymptomatic, screening would constitute a great asset. Conventional screening methods, like ECG or echocardiography, are blind to this important risk factor, while the gold standard for diagnostic imaging in this context is computed tomography3. The excellent soft-tissue contrast without the need for radiation or contrast agent makes coronary magnetic resonance imaging (CMRA) a great alternative for screening purposes. However, free-breathing 3-D whole-heart acquisitions require long acquisition times. To overcome this limitation, we propose a highly accelerated protocol covering the proximal part of the coronary arteries with a single-breath-hold acquisition4 and added a fully automated coronary ostia detection to further improve the screening efficiency. In-vivo experiments were performed in $$$10$$$ healthy volunteers, and the automated segmentation was compared to manual gold standard segmentation.Methods
Highly accelerated single-breath-hold 3-D imaging was performed with a prototype sequence and reconstruction in $$$10$$$ healthy volunteers ($$$6$$$ female, $$$42 ± 13$$$ years) on a 1.5T clinical MR scanner (MAGNETOM Aera, Siemens Healthcare, Erlangen, Germany). Imaging was performed with a FOV in axial slice orientation covering the proximal part of the coronary arteries. For data acquisition, a prototype sequence was used for 3-D volume-selective, T2-prepared, ECG-triggered, fat-saturated bSSFP imaging with the following parameters: TR $$$4.0$$$ ms, TE $$$2.0$$$ ms, FOV $$$310$$$x$$$225$$$x$$$(79$$$-$$$105)$$$ mm3, acquired voxel size $$$1.2$$$x$$$1.5$$$x$$$1.4$$$ mm3 interpolated to $$$1.2$$$x$$$1.2$$$x$$$1.1$$$ mm3. Accelerated data acquisition was performed as described by Forman et al.4 with an acceleration factor of $$$10.6$$$, and images were reconstructed using compressed sensing with $$$20$$$ iterations and a regularization factor of $$$0.008$$$.
After compressed sensing
reconstruction, the coronary ostia were automatically detected in the resulting
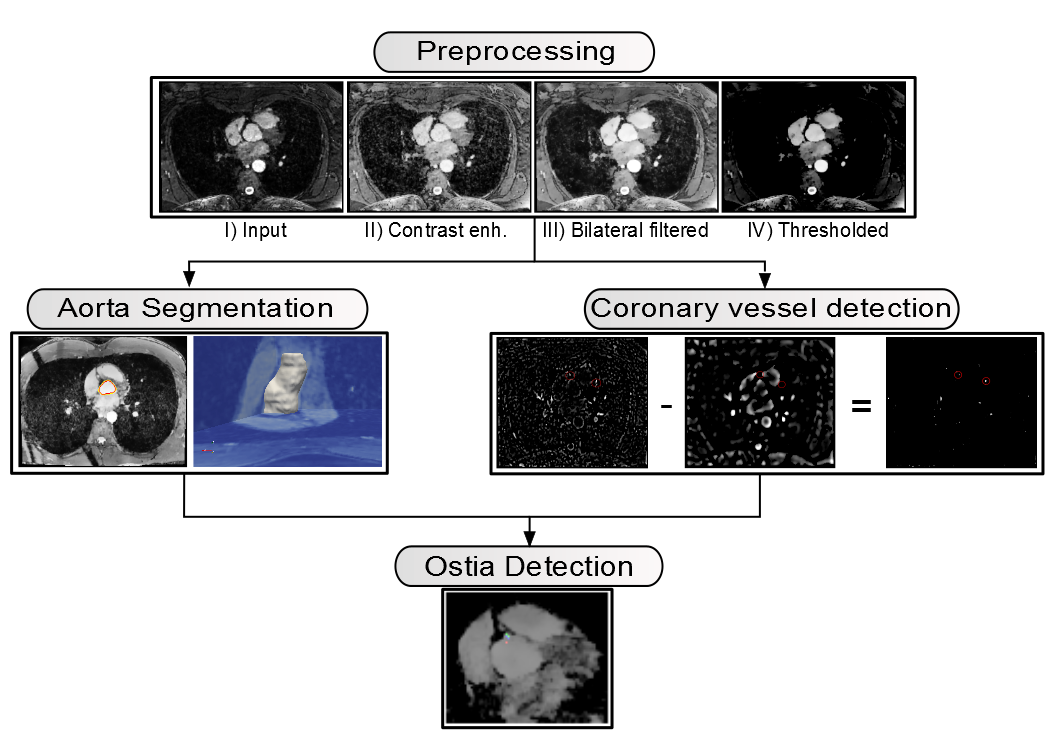
3D volumes with a multi-step procedure (see Figure 1):
In the preprocessing step,
similar image characteristics among all data sets were ensured by intensity
normalization and thresholding.
Aorta segmentation was
performed to obtain the contour of the aorta that later served as
initialization for the ostia detection. Starting with an automatically detected
landmark point in the aorta from a preceding localizer scan5, the
aorta was segmented using an active contour algorithm driven by a level set
method6. Oversegmentation in superior-inferior direction was avoided
by bi-directional, slice-wise segmentation and termination of the process if
the perimeter between consecutive slices exceeded a certain threshold.
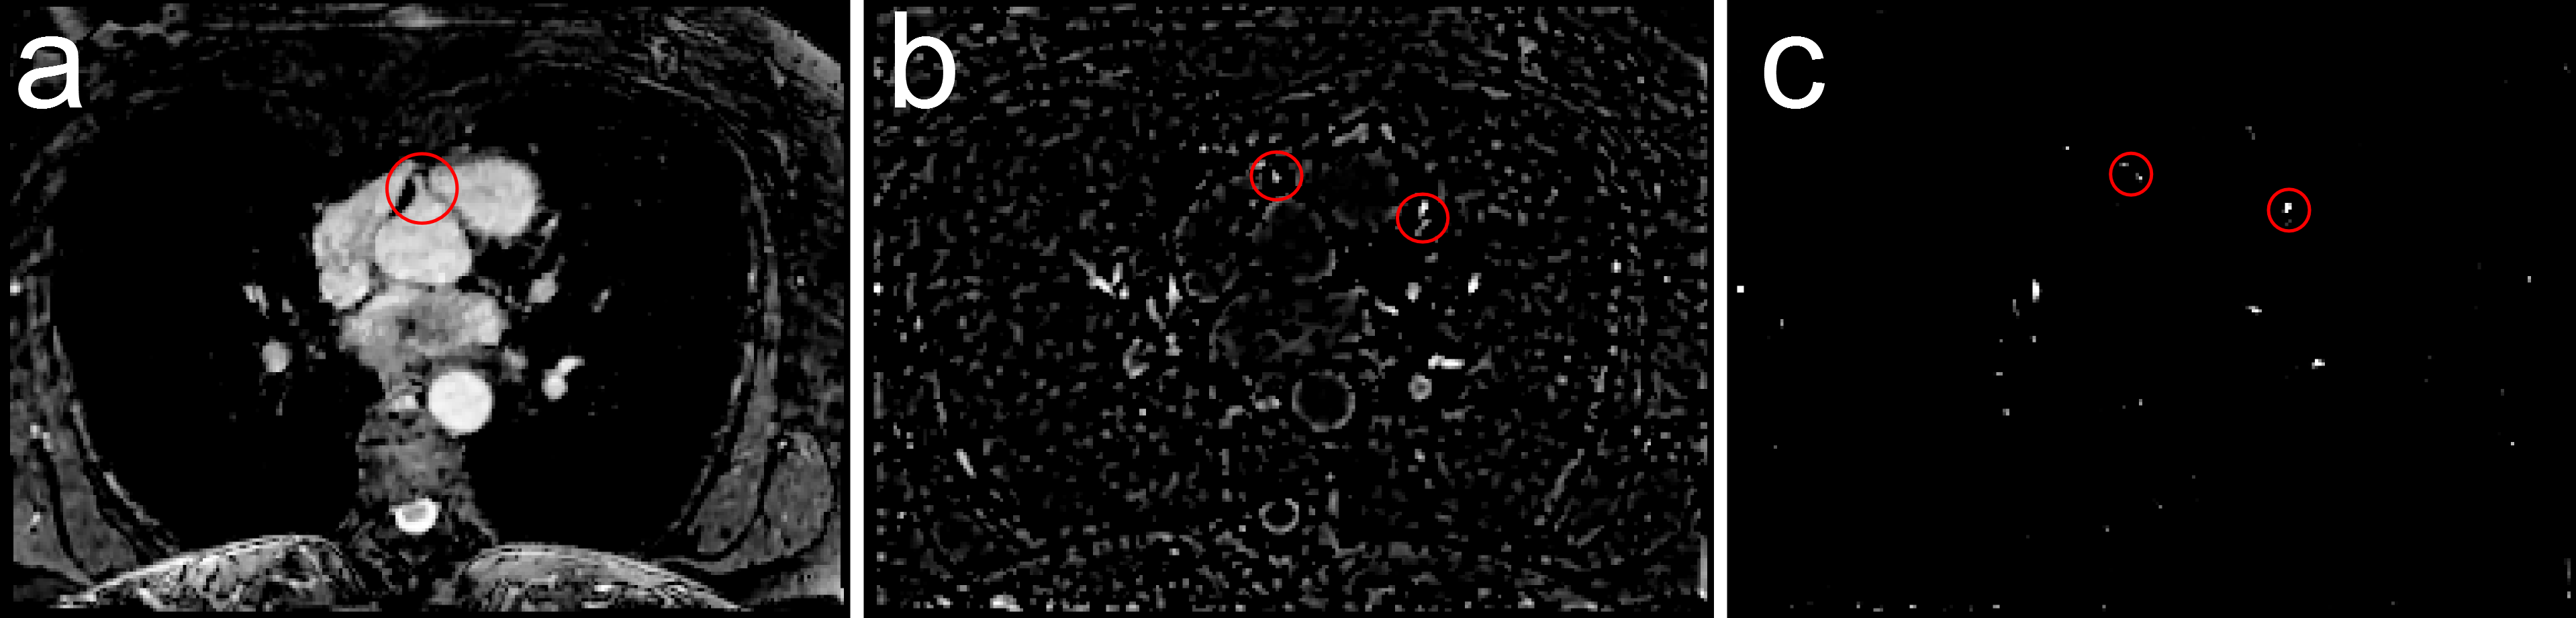
In coronary vessel detection, a vesselness mask Tσ was generated using the methods described in 7,8,
while the vessel size σ corresponds
to the diameter of the coronaries. For the final vesselness mask, the responses
from larger size structures were removed by subtracting T3σ from Tσ
(see Figure 2).
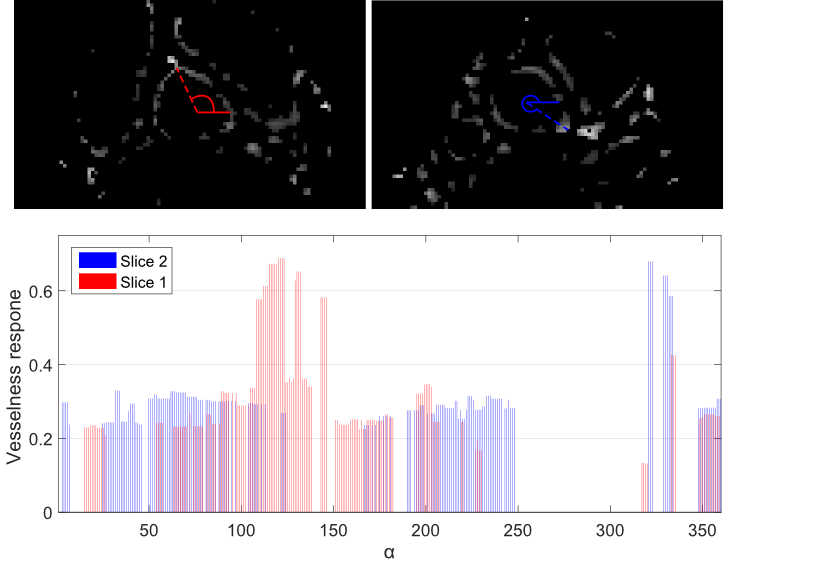
Finally, ostia detection was
performed based on the results of both previous steps and a ray-tracing
procedure. Starting from the slice-wise segmented aorta boundary, rays were
cast in radial directions. For each ray, we accumulated the filter response
from the vesselness mask estimated in the coronary vessel detection step (see
Figure 3). The coronary ostia were then selected as the two aorta boundary
points with the largest accumulated response assigned to it (see Figure
4).
The automated segmentation was compared to the ground truth segmentation of five experts and the angular deviations, and Euclidean distances in superior-inferior direction between the mean of the annotated positions and the automatically detected ostia were computed.
Results and Discussion
The acquisition time was on average $$$24 ± 5$$$ sec. Fully automated ostia detection was successful in all cases. The average angular deviation between the automatically detected and manually annotated ostia positions was $$$6.6 ± 5.7$$$° for the left and $$$8.7 ± 5.2$$$° for the right coronary ostia and the displacement in superior-inferior direction $$$2.5 ± 1.6$$$ and $$$0.6 ± 0.3$$$ mm. The mean standard deviation of the annotated ostia was $$$3.6 ± 1.1$$$° in angular and $$$1.2 ± 0.58$$$ mm in superior-inferior direction. The increased standard deviations for the left ostium may be caused by lacking visibility, e.g. due to gaps in the coronary arteries. This is also in accordance with an increased standard deviation of the manually annotated ostia positions.
Conclusion
We have presented a fully automated approach for the coronary ostia detection based on highly accelerated 3D MR angiography. The procedure required no additional user interaction and was successful in all volunteer scans. An improved accuracy of the segmentation could be achieved with high-resolution free-breathing MRA acquisitions at the cost of prolonged scan times. As future work, the detected ostia locations could be used as starting point for an automated segmentation of the coronary arteries.Acknowledgements
No acknowledgement found.References
1. K. Bille et al., „Sudden cardiac death in athletes: the Lausanne Recommendations“, Eur J Cardiovasc Prev Rehabil, 13.6 (2006): 859-875
2. W. Heo et al. “The ''High Take-Off'' Left Main Coronary Artery in a Patient With Acute Type A Aortic Dissection”. Circulation. Vol. 130, no. 12, 2014.
3. H. Scheffel et al. “Accuracy of dual-source CT coronary angiography: first experience in a high pre-test probability population without heart rate control”. European Radiology. Vol.16, no. 12, 2006.
4. C. Forman et al. “High-resolution 3D whole-heart coronary MRA: a study on the combination of data acquisition in multiple breath-holds and 1D residual respiratory motion compensation”. Magn. Reson. Med. Vol. 27, no.5, 2014.
5. X. Lu et al. “Automatic view planning for cardiac MRI acquisition”. MICCAI 2011. Vol. 3893 LNCS, 2011.
6. T. S. Yoo. “Insight into Images: Principles and Practice for Segmentation, Registration, and Image Analysis”. AK Peters Ltd., 2004.
7. M. Unberath et al. “Mitigating Medialness Responses from Non-tubular Structures Using Entropy”. Proc. CARS 2016.
8. Y. Sato et al. “Three-dimensional multi-scale line filter for segmentation and visualization of curvilinear structures in medical images”. Medical image analysis. Vol. 2, no. 2, 1998.
Figures
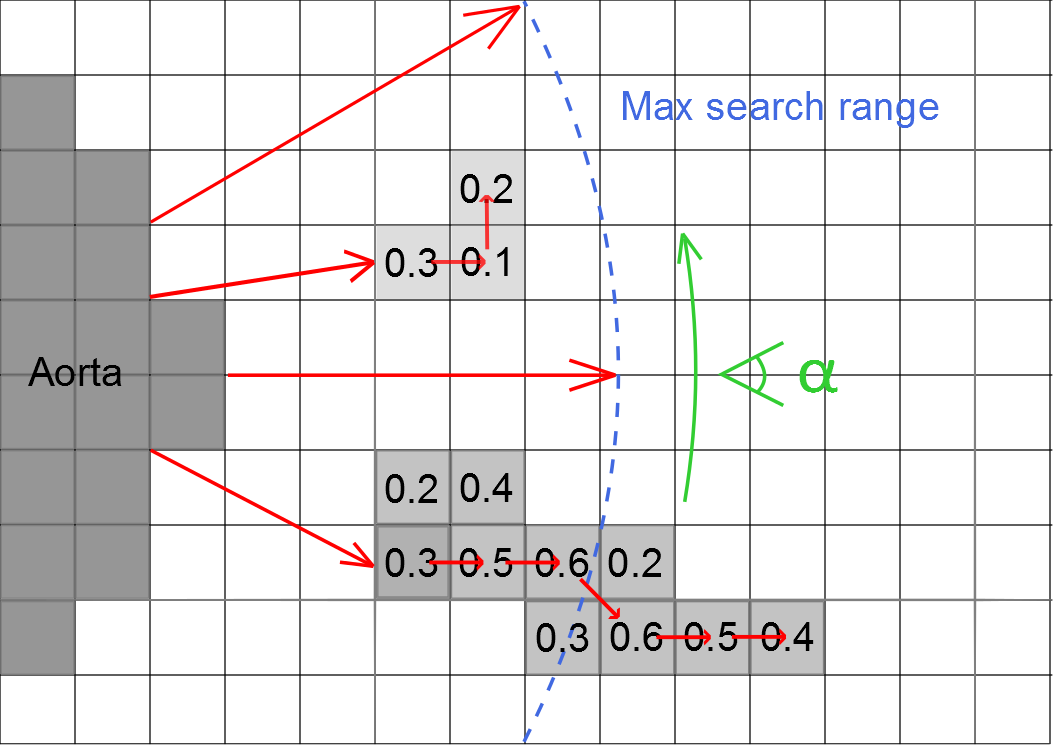
If a ray hits a filter response of at least $$$40\%$$$ of the maximum value, the response value $$$\rho(\alpha)$$$ is saved and the corresponding point is treated as seed point. Subsequently, the voxel that exhibits the highest response among all neighboring points is determined and selected as successor.