3126
Evaluation of Four Injection Strategies for High Spatial Resolution Gadobenate Dimeglumine-Enhanced MR Angiography1Radiology, University of Washington, Seattle, WA, United States
Synopsis
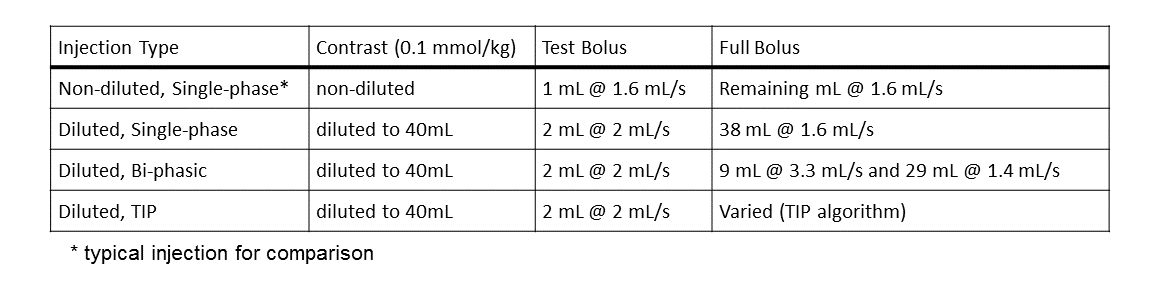
Four injection profiles were evaluated in 40 subjects (10 each). The profiles were designed to provide a signal intensity plateau for a 20 second contrast-enhanced MR angiography scan, using gadobenate dimeglumine. The injection profiles were: 1) standard, non-diluted, 1.6 mL/sec; 2) diluted, 1.6 mL/sec; 3) diluted, bi-phasic, and 4) diluted, patient-tailored. All subjects received a total dose of 0.1 mmol/kg, divided between a test bolus and a full bolus. The “diluted” protocols included dilution of the total dose to 40 mL with normal saline. Signal intensity profiles were measured and analyzed for width of plateau (FW80M) and peak signal intensity.
Introduction
Contrast-enhanced MR angiography (CE-MRA) utilizes arterial water T1 shortening during passage of intravenously injected gadolinium based contrast agent. Circulation of the contrast agent (i.e., first-pass and subsequent dilution during recirculation) causes arterial signal intensity (SI) to vary throughout the acquisition. This signal modulation can cause image artifacts and blurring, such that the true image resolution may be limited by the bolus profile. Higher image resolution could be obtained by creating a signal intensity profile that is constant throughout the acquisition. Such a signal intensity plateau can be created by tailoring the injection profile to a patient’s individual hemodynamics using a test bolus and linear system theory.1 Alternatively, one could utilize a one-size-fits-all, standardized injection that prolongs the signal enhancement. In any case, a steep signal enhancement upslope is desired to reduce ringing artifacts and venous enhancement. This study evaluates signal intensity profiles from tailored injection profiles (TIPs) and 3 standardized injections.Methods
In the TIP algorithm, the test bolus SI is converted to contrast agent concentration [CA] to give the impulse response function (IRF). This IRF is then convolved with arbitrary “full” injection profiles (injection rate vs. time) to predict the full bolus concentration profile, which is then converted to predicted SI for the specific CE-MRA scan parameters.1-3 The user specifies a desired plateau duration (eg, equal to the CE-MRA scan duration) and the automated tool calculates the desired, multi-phasic injection protocol.
To-date, 34 (of 40) subjects have been enrolled in this IRB-approved study. Each subject received a test bolus and one of four randomized full-bolus injections, with total dose of 0.1 mmol/kg gadobenate dimeglumine (Bracco Diagnostics, Milan). Injections were controlled with a multi-phasic power injector (Spectris Solaris, Bayer). Injection parameters (Table 1) were selected to provide 20 sec of signal enhancement (except the non-diluted, single-phase injection that represents a “typical” clinical injection). Signal intensity profiles were measured at 3T with a thick-slice, <1.5 sec temporal resolution, 3D SPGR acquisition with CE-MRA mimicking parameters: TR = 3.5 ms, TE = 1.5 ms, flip angle = 30°, FOV = 400 x 248 x 64 mm3, voxel volume = 2 x 2 x 8 mm3, covering the entire aorta (oblique sagittal orientation) to reduce contaminating inflow signal. The test bolus acquisition was similar with: TR = 2 ms, TE = 0.8 ms, flip angle = 7°. Each acquisition collected dynamic volumes for 100 sec. For both acquisitions, subjects were instructed to hold their breath as long as reasonable when contrast enhancement was first observed in the pulmonary arteries. Signal intensities were measured from a single ROI placed in the supra-celiac abdominal aorta.
Results
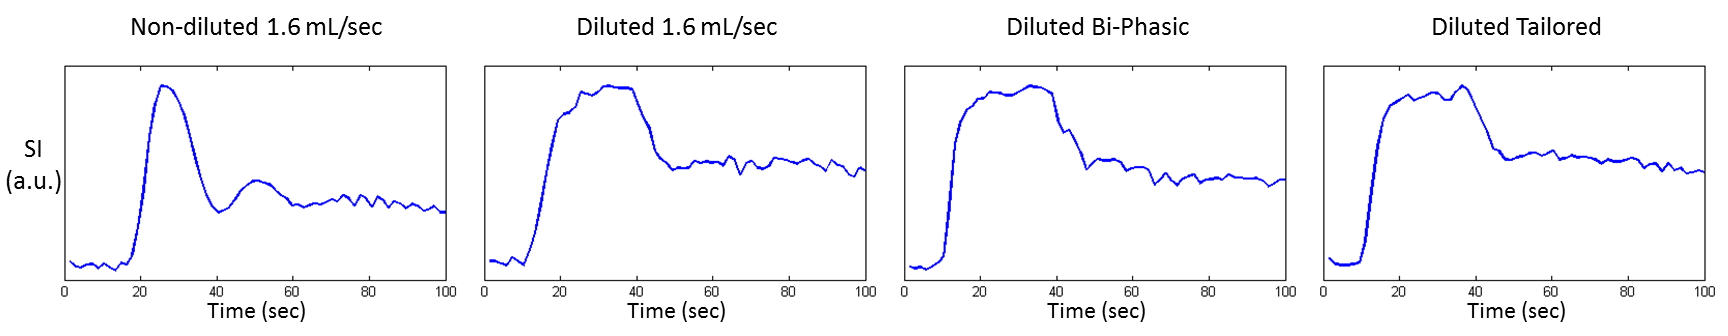
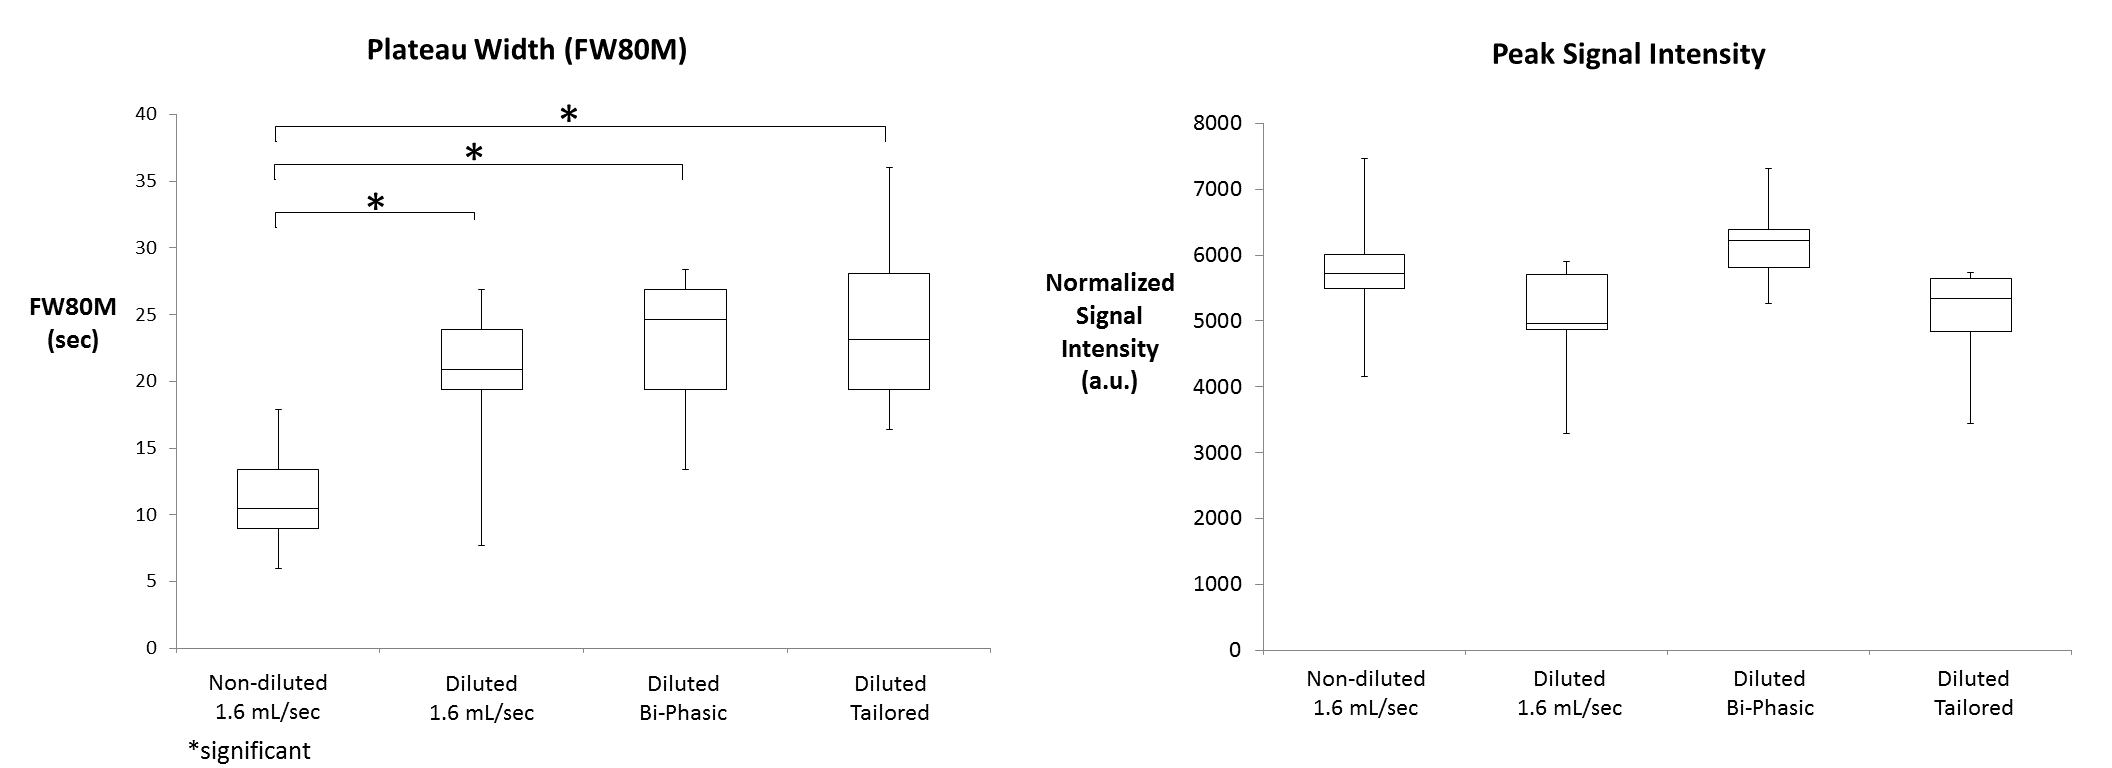
Example full-bolus signal intensity profiles are shown in Figure 1. The clinical standard [non-diluted, 1.6 mL/sec] injection shows a peaked signal intensity profile with no “plateau” phase. The three diluted injections show elongated signal enhancement phases compared to the clinical standard injection. Quantitative results of bolus profile width (FW80M) and peak signal intensity (normalized to baseline) are shown in Figure 2. The preliminary (n=34) results show no significant differences in peak signal intensity, and a significant increase in FW80M for all three diluted protocols compared to the non-diluted protocol.
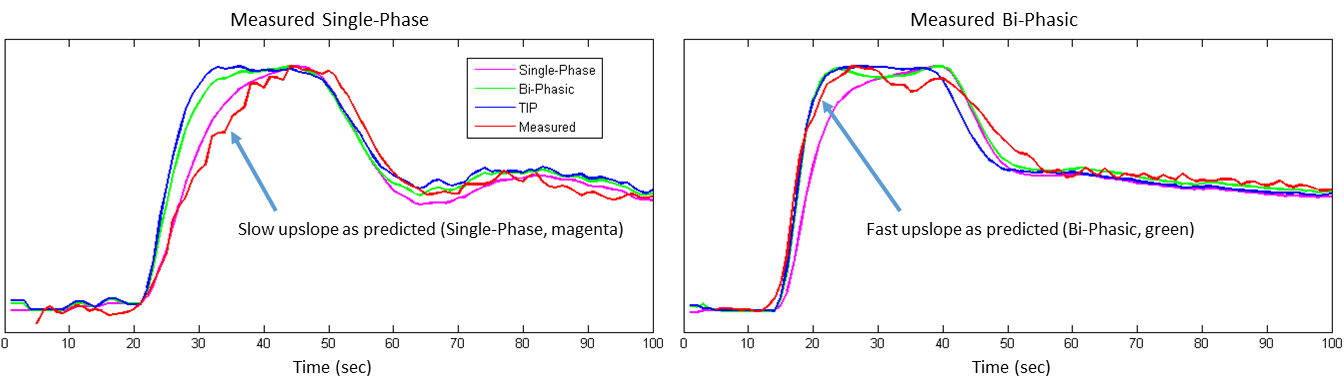
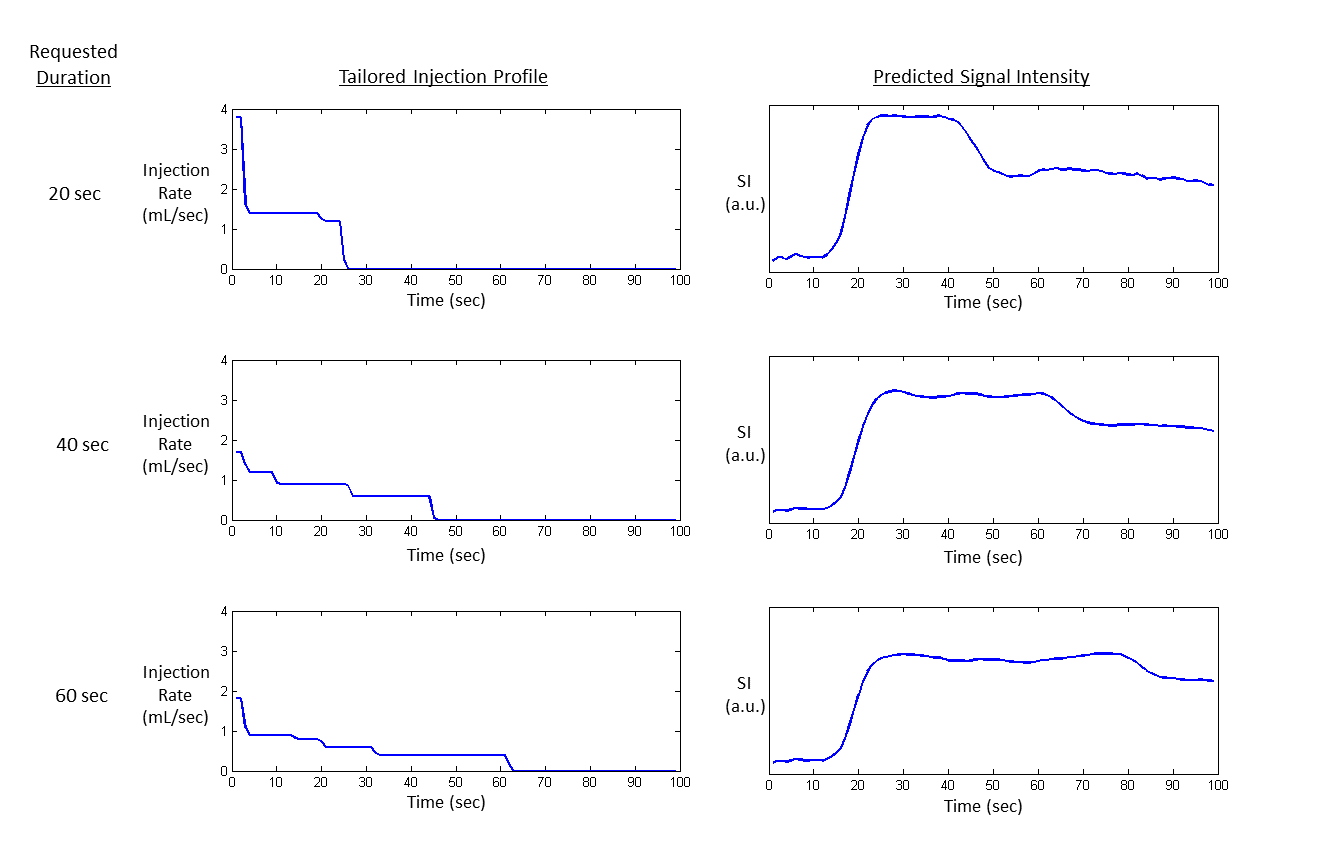
Bi-phasic and TIP injections, because of their high initial injection rate, produce a more rapid SI upslope (Figure 3). The more rapid upslope allows earlier triggering of the CE-MRA scan, which will reduce venous enhancement. This is especially important for longer scans with their overall slower injection rates and slower upslope, that are more prone to venous enhancement. Figure 4 displays TIP injection profiles and the corresponding predicted SI profiles for three different requested plateau durations (20, 40, and 60 sec). More injection phases are required to maintain longer signal intensity plateaus.
Discussion
Elongated injection profiles provide significantly longer signal enhancement with minimally (no significant difference, n = 34) reduced peak signal intensity. Constant signal enhancement will produce sharper CE-MRA images by reducing bolus profile blurring. Gadolinium contrast agent relaxivity effects (i.e., dimishing SI return at high concentration) limit the reduction of peak signal intensity such that resulting CE-MRA images will have sufficient signal-to-noise.1-3 Multi-phasic injections (diluted bi-phasic and diluted tailored) allow a steeper enhancement upslope, thus earlier CE-MRA acquisition start and less venous enhancement. TIP injections can be tailored for arbitrary scan durations and provide patient-specific injection profiles to reduce patient variability and optimize the use of contrast agent dose.Conclusion
Elongated injections of contrast agent provide significantly longer SI plateaus with minimal decrease in peak signal intensity. Future work will evaluate the use of TIP injection profiles in CE-MRA scans.Acknowledgements
Research funding provided by Bracco Diagnotics.References
1. Wilson GJ, Maki JH. J Magn Reson Imaging, May 5 (2016) Epub doi: 10.1002/jmri.25298.
2. Wilson GJ, Woods M, Springer CS Jr, Bastawrous S, Bhargava P, Maki JH. Magn Reson Med (2014)72(6):1746-54.
3. Wilson GJ, Springer CS, Bastawrous S, Maki JH. Magn Reson Med, Jun 14 (2016) Epub doi: 10.1002/mrm.26284.
Figures