3125
Quantitative Evaluation of RECS-3D MERGE MR Imaging for Carotid Plaque Assessment1Center Laboratory, The First Hospital of Nanchang City, Nanchang, People's Republic of China, 2Department of Radiology, The Third Affiliated Hospital of Nanchang University, Nanchang, People's Republic of China, 3Department of Radiology, University of Cambridge, Cambridge, United Kingdom, 4Department of Radiology, Beijing Anzhen Hospital, Beijing, People's Republic of China
Synopsis
We sought to quantitatively investigate the performances on blood suppression efficiency, wall-lumen CNR and plaque burden measurements for the RECS-3D MERGE sequence in carotid vessel wall MR imaging.
Twelve patients with carotid artery stenosis were recruited in this study. Lumen SNR and wall-lumen CNR were calculated and plaque burden measurements (i.e., lumen area, wall area, mean wall thickness and maximum wall thickness) were measured.
The RECS-3D MERGE was quantitatively demonstrated to have the ability to provide the comparable blood suppression, black-blood image quality and the highly correlated morphometry with the current plaque imaging protocol. The RECS-3D MERGE could be a promising tool for plaque burden measurement in a short scan time.
Purpose
Among 3D black-blood techniques, 3D MERGE is a promising one since it is able to provide excellent blood-suppression performance1 and cover large anatomical volume2. However, it is limited by the lower SNR and CNR of vessel wall3. In a previous study, we proposed a technique termed RECS-3D MERGE to provide high image quality for 3D black-blood imaging4. However, the performances on blood suppression efficiency, wall-lumen CNR and plaque burden measure for RECS-3D MERGE has not been quantitatively investigated. In this study, we sought to quantitatively conducts comparisons for RECS-3D MERGE and 3D MERGE. 2D DIR-FSE was the imaging reference for the investigation.
Materials and Methods
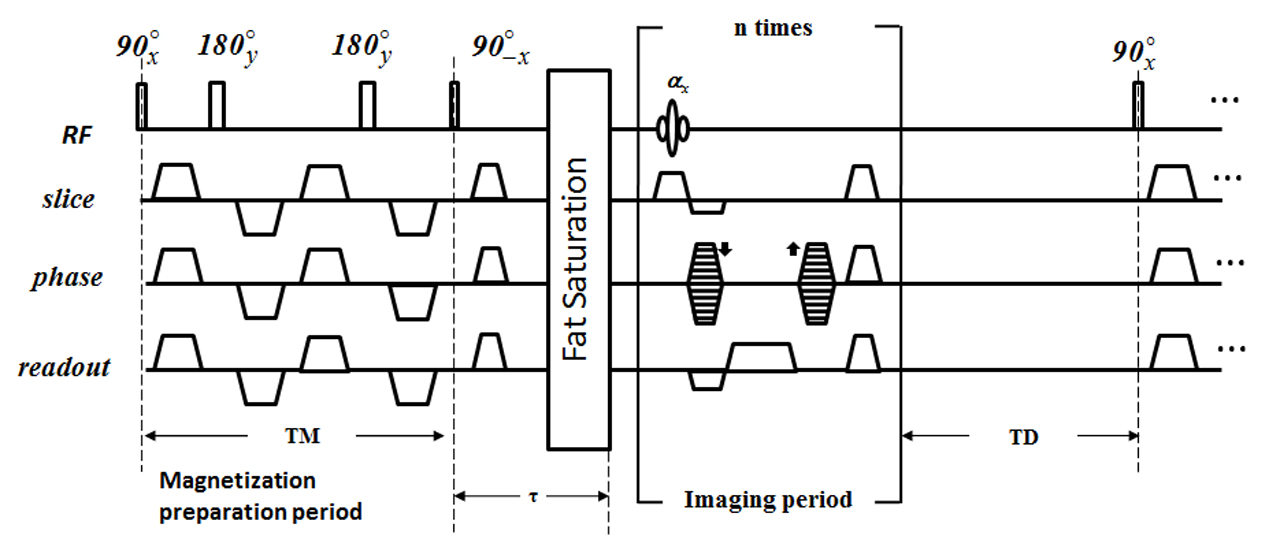
The RECS-3D MERGE sequence consists of 3D MERGE sequence, a delay time (TD) for relaxation enhancement, and a pseudo-centric phase encoding order used for under-sampling acquisition (Fig. 1). Compressed sensing (CS) reconstruction was employed to reconstruct the under-sampled images5.
After institutional review board approval and written informed consent, 12 patients with carotid artery stenosis were recruited. MR images were acquired using a clinical 3T scanner (Signa TM; GE Medical Systems, Milwaukee, WI). The imaging parameters of 3D MERGE were: TR/TE 6.2/2.9 ms, flip angle 6°, FOV 180 × 180 mm2, receiver bandwidth 244 Hz/pixel, matrix size 256 × 256, interpolated to 512 × 512, slice thickness 1.4 mm, number of slices 48, and signal averages 1. The scan time was 96 seconds.
The RECS-3D MERGE has the same imaging parameters as the 3D MERGE. And the TD and the acceleration factor in the RECS-3D MERGE were set to 800 ms and 3x. The scan time was 98 seconds.
The imaging parameters of 2D DIR-FSE were: TR/TE 1000/18 ms, FOV 180 × 180 mm2, receiver bandwidth 488 Hz/pixel, matrix size 256 × 256, interpolated to 512 × 512, slice thickness 2 mm, number of slices 12, signal averages 2. The scan time was 444 seconds.
Native RECS-3D MERGE and 3D MERGE images were reformatted to the axial plane with a 2-mm slice thickness such that slices were registered to the 2D DIR-FSE images
The SNR in the vessel lumen and the CNR between the lumen and the vessel wall were used as the measure of flowing signal suppression and the image quality for black-blood imaging. Vessel lumen area (LA), vessel wall area (WA), mean wall thickness (MWT), and maximum wall (MaxWT) thickness were compared. The statistical significance was defined as P < 0.05.
Results
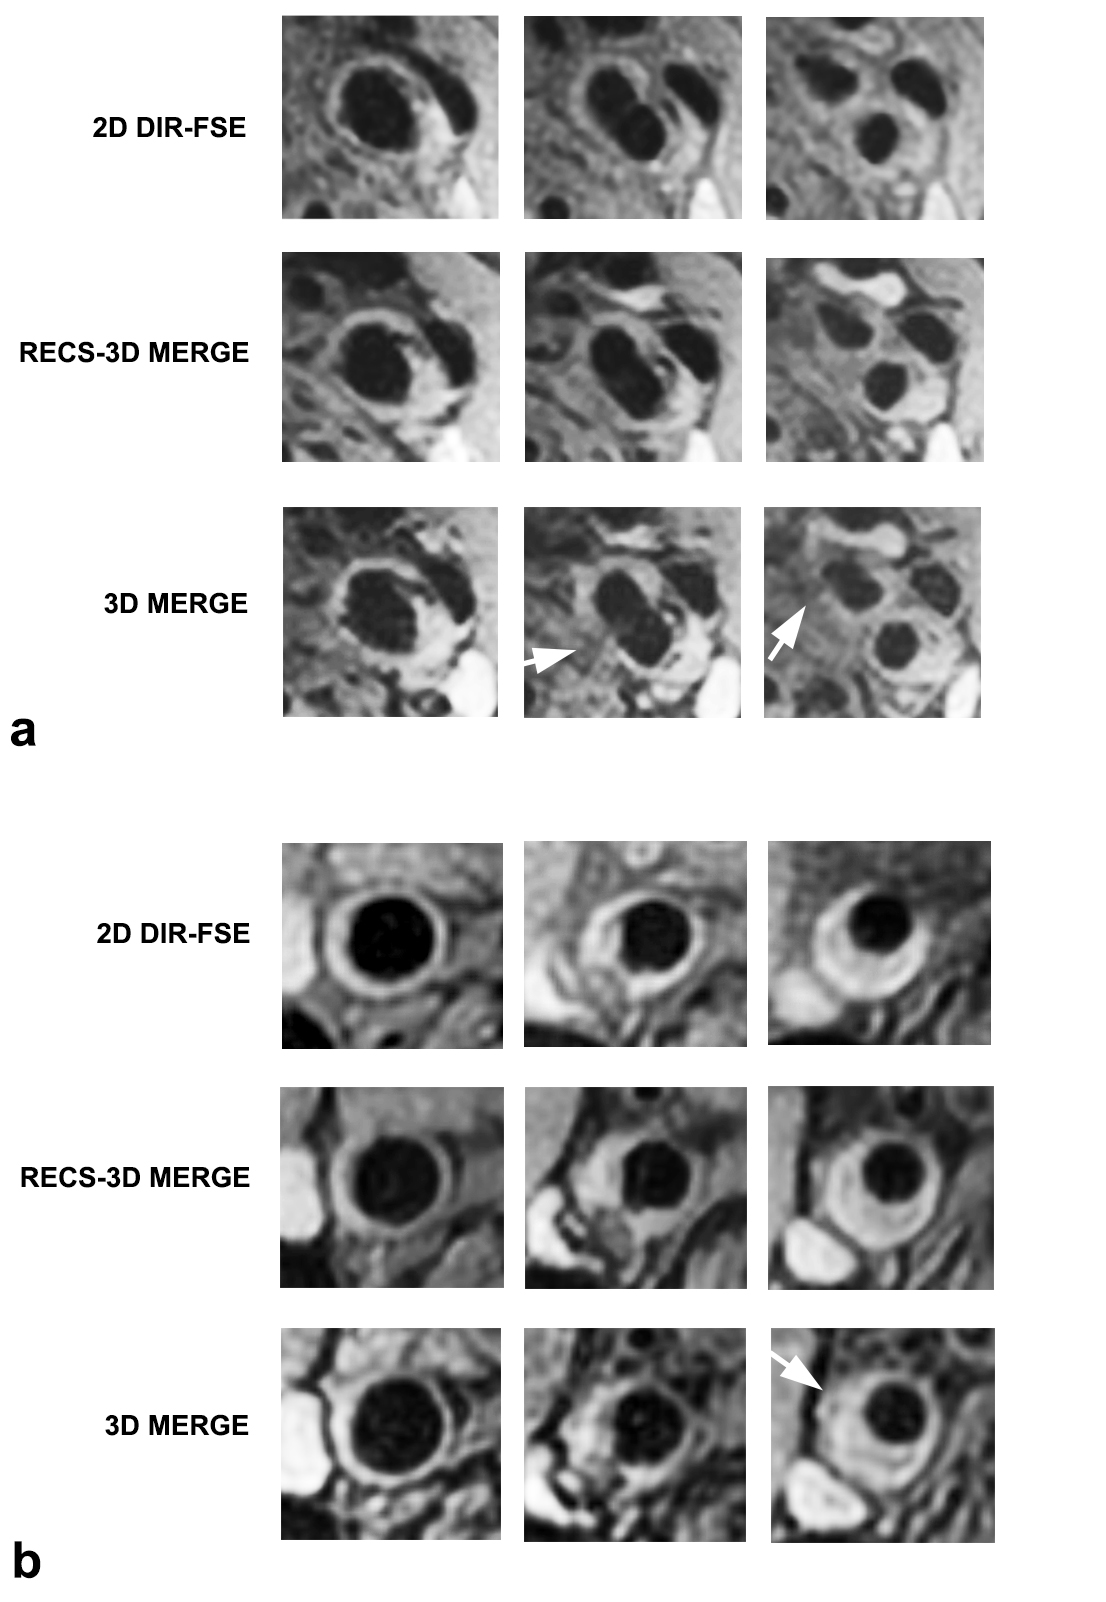
There were no statistically significant differences in lumen SNR and wall-lumen CNR between RECS-3D MERGE and 2D DIR-FSE, and no statistically significant difference was found in lumen SNR between 3D MERGE and 2D DIR-FSE. However, the CNR of 3D MERGE was significantly lower than that of 2D DIR-FSE. Representative axial images obtained with the three techniques in two volunteers are shown in Fig. 2. It is observed that the black-blood axial images at RECS-3D MERGE exhibit the comparable flow suppression of blood signal to the corresponding images at 2D DIR-FSE. And the depictions of outer vessel wall boundary, lumen-wall interface and plaque burden for both techniques were similar. However, the delineations of outer vessel wall boundary are negatively affected by artifacts in the images of 3D MERGE, resulting in the obscured delineations (see arrows in Fig. 2).
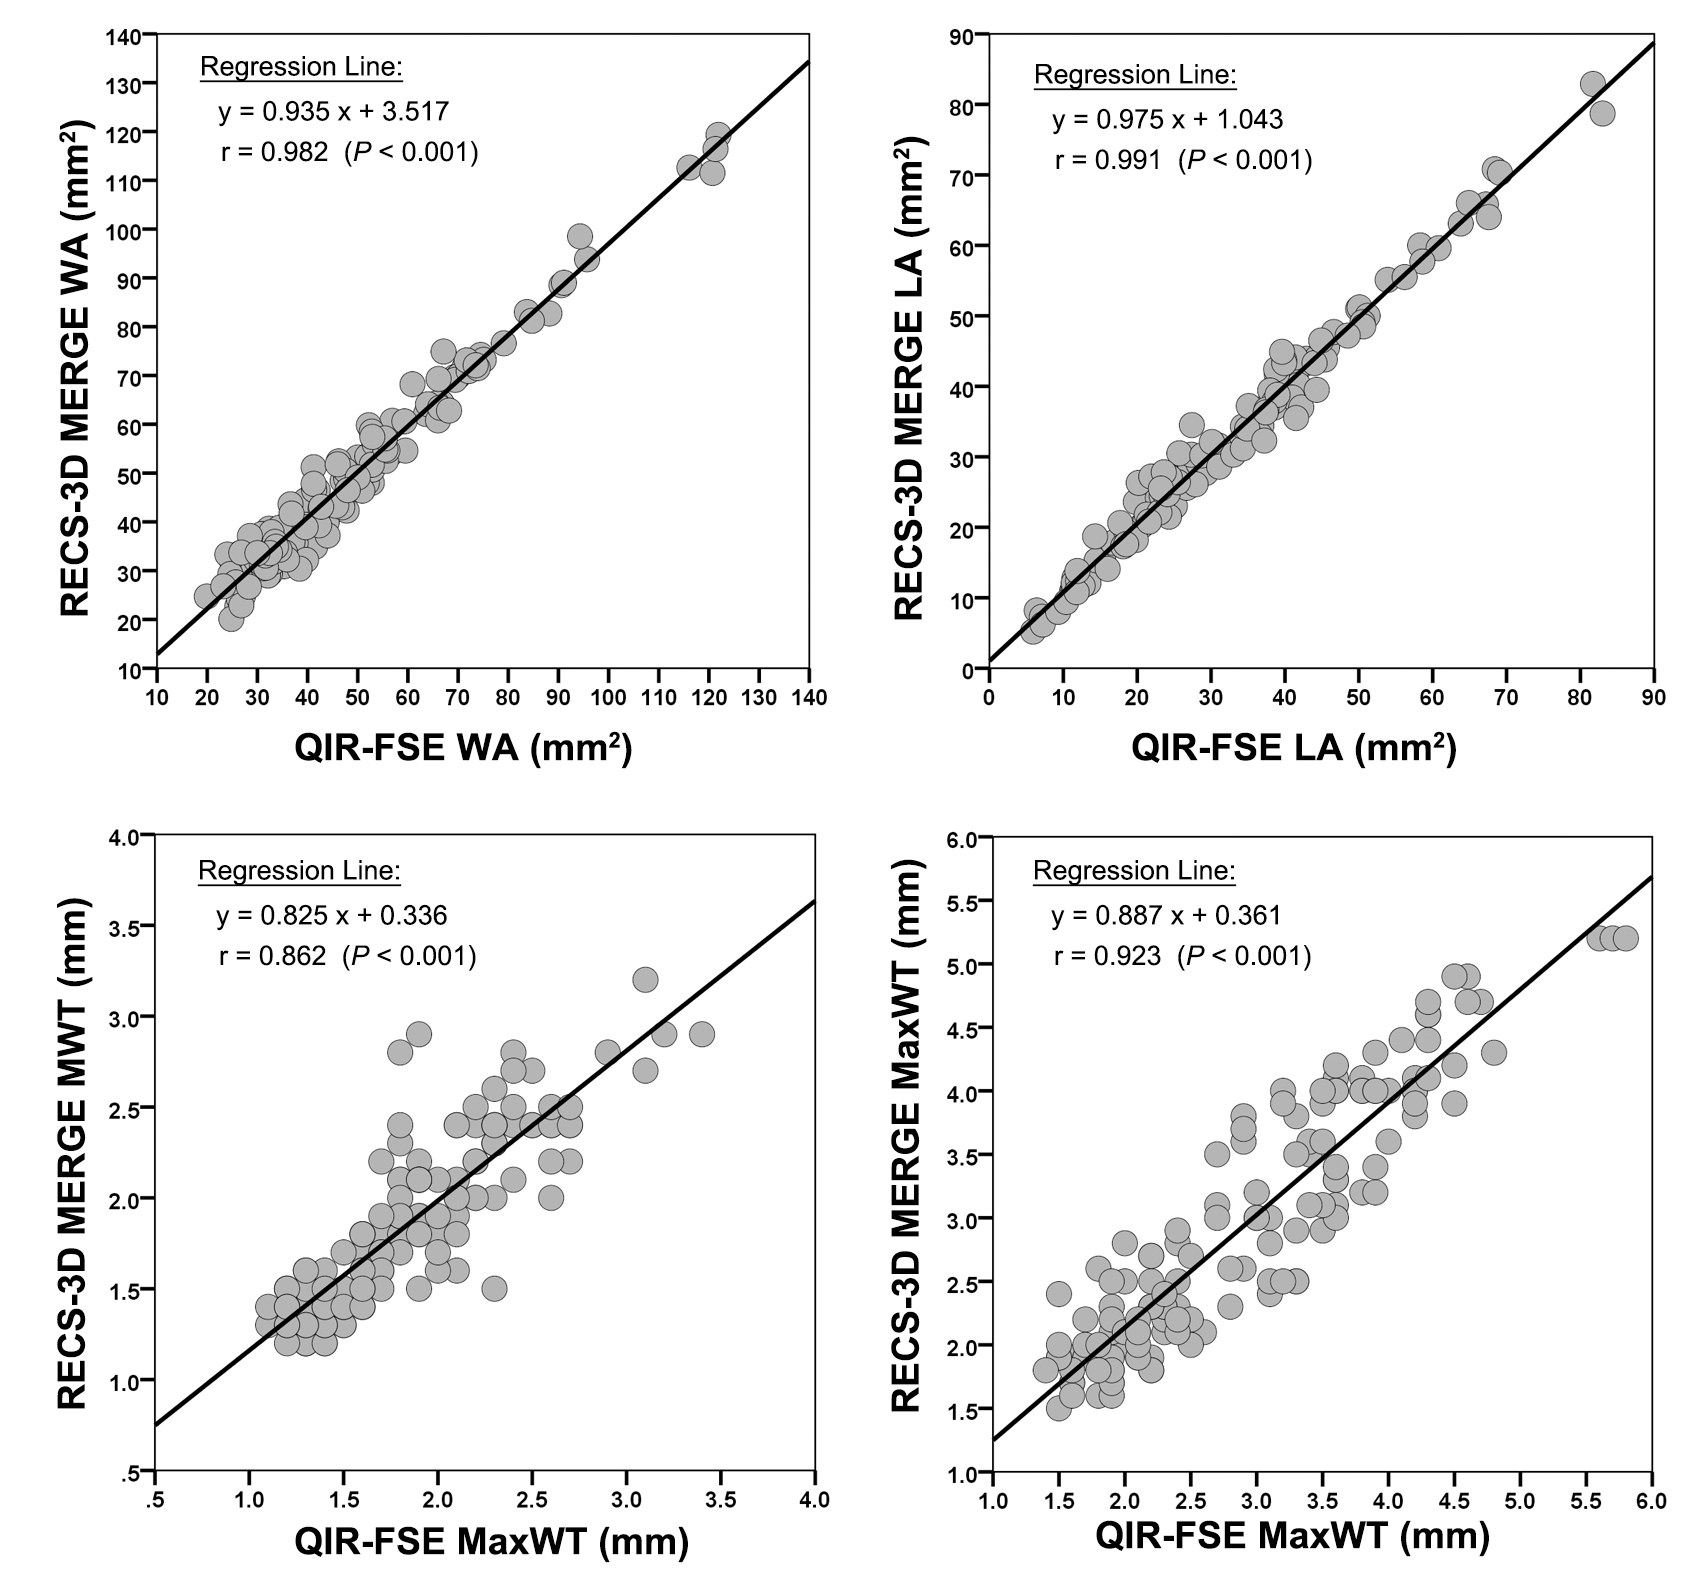
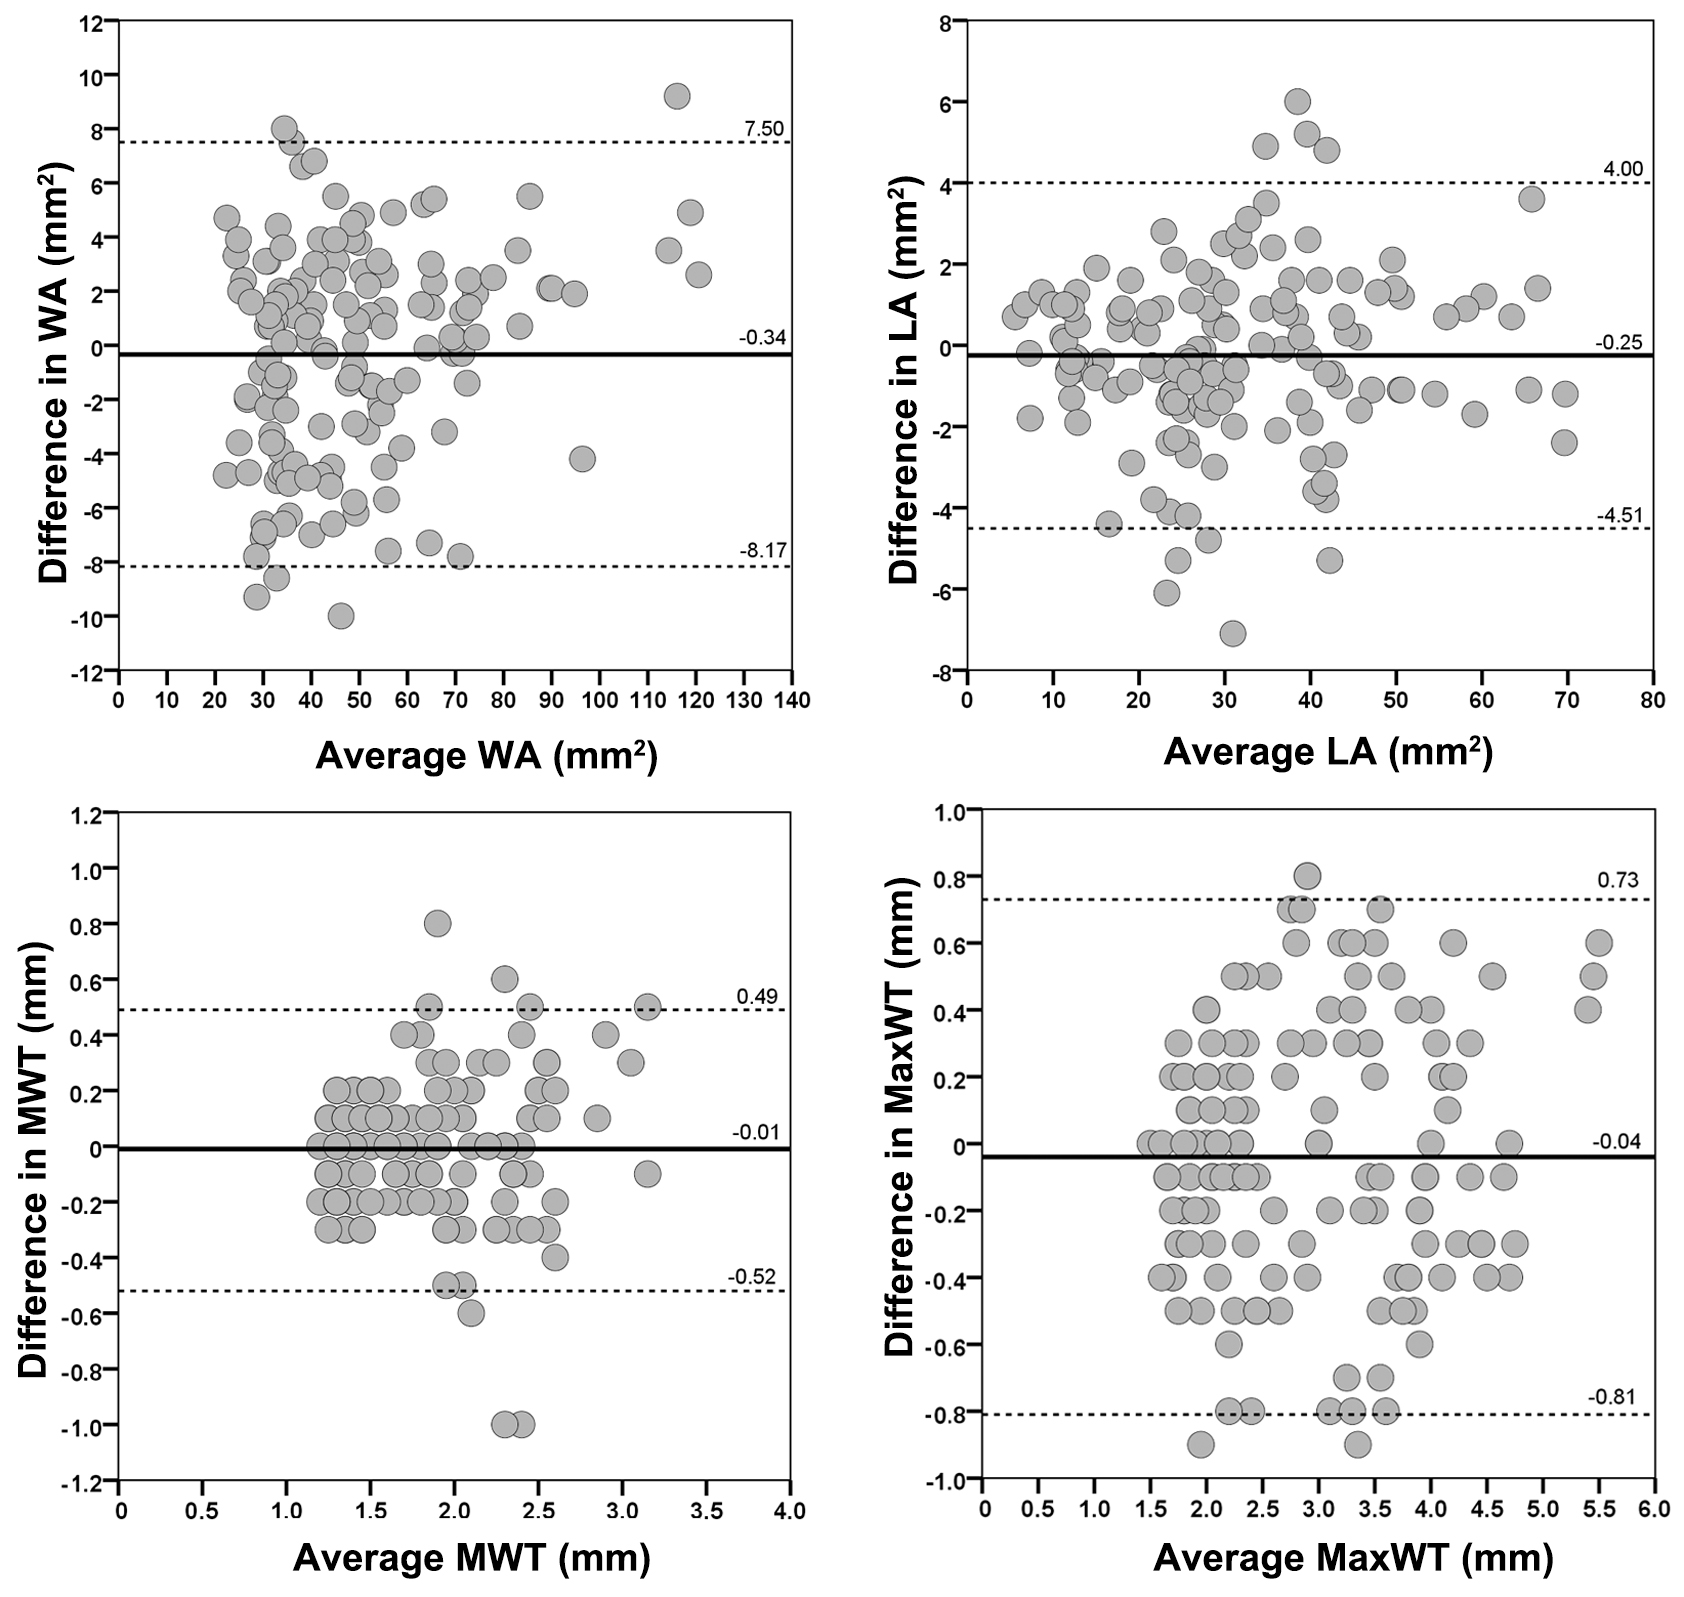
The intra-class correlation coefficients (ICCs) are 0.995, 0.990, 0.925 and 0.960 for LA, WA, MWT and MaxWT for RECS-3D MERGE and 2D DIR-FSE. The ICCs for 3D MERGE and 2D DIR-FSE are less than those between RECS-3D MERGE and 2D DIR-FSE. Scatter plots for LA, WA, MWT and MaxWT between RECS-3D MERGE and 2D DIR-FSE are shown in Fig. 3. The Bland-Altman plots for them are shown in Fig. 4. Bland-Altman plots for measurements between RECS-3D MERGE and 2D DIR-FSE demonstrate random error scattering patterns with no significant bias and no significant correlation between bias and mean.
Discussion
This study quantitatively demonstrated RECS-3D MERGE could considerably improve the image quality of MSDE prepared 3D black-blood MR imaging. This result is coincident with the findings in the previous study4, in which no significant differences in image quality of the area covering plaque were found between RECS-3D MERGE and 2D DIR-FSE.
The
improved tissue signal intensity and image quality achieved by TD increase the probability
of signal recovery because high SNR would be
advantageous to obtain the solution m* more approaching to the original signal
m when solving the
L1-norm optimization problem6.
Acknowledgements
No acknowledgement found.References
1. Wang J, Yarnykh VL, Hatsukami T, Chu B, Balu N, Yuan C. Improved suppression of plaque-mimicking artifacts in black-blood carotid atherosclerosis imaging using a multislice motion-sensitized driven-equilibrium (MSDE) turbo spinecho (TSE) sequence. Magn Reson Med. 2007;58:973-981.
2. Balu N, Chu B, Hatsukami TS, Yuan C, Yarnykh VL. Comparison between 2D and 3D high-resolution black-blood techniques for carotid artery wall imaging in clinically significant atherosclerosis. J Magn Reson Imaging. 2008;27:918–24.
3. Balu N, Yarnykh VL, Chu B, Wang J, Hatsukami T, Yuan C. Carotid plaque assessment using fast 3D isotropic resolution black-blood MRI. Magn Reson Med. 2011;65:627–37.
4. Li B, Li H, Li J, et al. Relaxation enhanced compressed sensing three-dimensional black-blood vessel wall MR imaging: Preliminary studies. Magn Reson Imaging. 2015;33:932-938.
5. Lustig M, Donoho D, Pauly JM. Sparse MRI: The application of compressed sensing for rapid MR imaging. Magn Reson Med. 2007;58:1182-1195.
6. Candès EJ, Romberg JK, Tao T. Stable signal recovery from incomplete and inaccurate measurements. Communications on pure and applied mathematics. 2006;59:1207–1223.
Figures