3121
Endothelial permeability in the aortic root of atherosclerotic mice: quantification using 3 dimensional, black blood, self-gated T1 mapping1Translational and Molecular Imaging Institute, Icahn School of Medicine at Mount Sinai, New York, NY, United States, 2Academic Medical Center, Amsterdam, Netherlands
Synopsis
Atherosclerotic plaques prone to rupture are characterized by endothelial dysfunction and increased endothelial permeability. The aortic root is a vascular territory where permeable atherosclerotic plaques form consistently and reliably. However, morphological and quantitative parametric imaging of the mouse aortic root is very challenging, due to the small dimensions, rapid blood flow through the valves, and high heart rate. Here we demonstrate feasibility of pre and post-contrast T1 mapping of the mouse aortic root using a 3 dimensional, self-gated fast low angle shot (FLASH) sequence with black blood imaging for improved vessel wall delineation. Future studies will entail further development of this technique for the more accurate quantification of endothelial permeability and fractional blood volume in the mouse aortic root.
Introduction
Atherosclerotic plaques prone to rupture are characterized by endothelial dysfunction and increased endothelial permeability1-4. The aortic root is a vascular territory where permeable atherosclerotic plaques form consistently and reliably. However, morphological and quantitative parametric imaging of the mouse aortic root is very challenging, due to the small dimensions, rapid blood flow through the valves, and high heart rate. Conventional prospectively ECG triggered and respiratory-gated acquisitions are lengthy, and therefore not well suited to capture the rapid dynamics of contrast agent extravasation in the vessel wall. Here we present a method to reliably quantify contrast agent uptake and endothelial permeability in the mouse aortic root based on a 3 dimensional, self-gated fast low angle shot (FLASH) sequence with black blood imaging for improved vessel wall delineation5-7.Methods
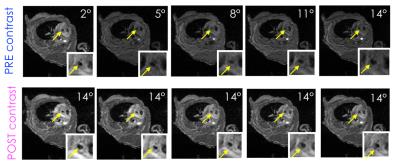
Image acquisition: Two 8 weeks old female ApoE-/- mice were fed a high-fat diet for approximately 28 weeks. Two wild type mice were used as controls. Mice were imaged using a pre-clinical 7T MRI scanner. After self-gated localizer scans to identify the mouse aortic root, a pre-contrast T1 map was acquired using a variable flip angle 3D self-gated FLASH sequence. Acquired flip angles were 2, 5, 8, 11 and 14 degrees. Other relevant imaging parameters were: repetition time (TR), 7.6 ms; echo time (TE), 1.7 ms; field of view, 3 x 3 x 0.6 cm3; in-plane spatial resolution, 0.117 mm2; slice thickness, 0.3 mm; number of slices, 20; number of cardiac cine frames per slice, 6. Black blood was achieved by using a flip angle of 90 degrees for excitation of the navigator slice that allows for a self-gated acquisition. Following acquisition of the last flip angle, 0.3 mmol/Kg of Gd diethylenetriaminepentacetate (DTPA) – a contrast agent commonly used in the clinics – was injected through a catheter placed in the mouse tail vein. Immediately afterwards, 5 data points after injection were acquired using the same 3D self-gated FLASH sequence, using the same imaging parameters used for pre-contrast T1 mapping, and a flip angle of 14 degrees for all time-points.
Image analysis: For each mouse inner and outer vessel wall contours were drawn for the slice corresponding to the aortic root, and two consecutive slices above (only 1 cardiac frame). Contours were drawn separately on all 3D self-gated FLASH acquisitions (5 pre-contrast and 5 post-contrast), and average vessel wall region-of-interest (ROI) signal was calculated. Pre-contrast T1 was calculated from the 5 pre-contrast acquisitions using the DESPOT1 analysis, previously described by Deoni et al8, by linear fitting of Equation 1, and multiplied by a correction factor to account for its known under-estimation due to black blood imaging6.
$$\frac{S\left(\theta\right)}{\sin\theta}=M0\left(1-E1\left(0\right)\right)+E1\left(0\right)\frac{S\left(\theta\right)}{\tan\theta}$$
with $$$ E1 = \exp\frac{-TR}{T1}$$$
Post-contrast T1 values were then derived from Equation 2
$$\frac{St\left(\theta\right)}{S0\left(\theta\right)}=\frac{1-E1\left(t\right)}{1-E1\left(t\right)\cos\theta}\cdot\frac{1-E1\left(0\right)\cos\theta}{1-E1\left(0\right)}$$
and then converted to contrast agent concentration using Equation 37
$$C\left(t\right) = \frac{R1\left(t\right) - R1\left(0\right)}{r1}$$
where $$$ R1 = \frac{1}{T1} $$$ (s-1) and r1 is the contrast agent relaxivity (4.5 s/mM).
Unpaired t-tests were used to compare T1 and concentration values among atherosclerotic and control animals. p<0.05 was considered significant.
Results
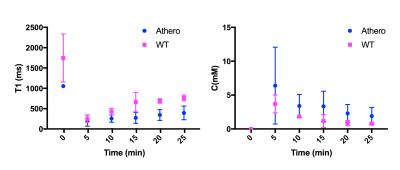
Average corrected pre-contrast T1 values for atherosclerotic mice were 1054 +/ 13ms, while they were 1745 +/- 589 ms for wild type mice (p=0.04). On average T1 values at the end of acquisition were lower for atherosclerotic (395 +/- 167 ms), than for wild type mice (763 +/- 71ms), indicating higher accumulation of contrast agent in the root of atherosclerotic mice (p = 0.007). Peak concentration were on average higher for atherosclerotic mice (1.42 +/- 1.26 mM mM), compared to controls (0.82 +/- 0.29 mM) but not significantly different (p=0.32). Concentration at end of acquisition was on average higher for atherosclerotic mice (0.42 +/- 0.28 mM), compared to controls (0.17 +/- 0.04 mM) (p=0.06).Discussion and Conclusion
Our results indicate that 3D, self-gated, black blood T1 mapping with a FLASH sequence may be suitable for quantification of endothelial permeability in the mouse aortic root. We are currently conducting studies to further develop acquisition to quantify contrast agent concentration in the blood plasma, and to allow for the quantification of fractional plasma volume and permeability7.Acknowledgements
We wish to acknowledge grant support from the American Heart Association (Scientist Development Grant 16SDG27250090), and the National Institutes of Health (R01EB009638).References
1. Noninvasive magnetic resonance imaging evaluation of endothelial permeability in murine atherosclerosis using an albumin-binding contrast agent. Phinikaridou A, Andia ME, Protti A, Indermuehle A, Shah A, Smith A, Warley A, Botnar RM. Circulation. 2012 Aug 7;126(6):707-19. doi: 10.1161/CIRCULATIONAHA.112.092098. PMID: 22753191
2. Noninvasive MRI monitoring of the effect of interventions on endothelial permeability in murine atherosclerosis using an albumin-binding contrast agent. Phinikaridou A, Andia ME, Passacquale G, Ferro A, Botnar RM. J Am Heart Assoc. 2013 Sep 26;2(5):e000402. doi: 10.1161/JAHA.113.000402. PMID: 24072533
3. Monitoring vascular permeability and remodeling after endothelial injury in a murine model using a magnetic resonance albumin-binding contrast agent. Lavin B, Phinikaridou A, Lorrio S, Zaragoza C, Botnar RM. Circ Cardiovasc Imaging. 2015 Apr;8(4). pii: e002417. doi: 10.1161/CIRCIMAGING.114.002417. PMID: 25873720
4. Retrospectively gated MRI for in vivo assessment of endothelium-dependent vasodilatation and endothelial permeability in murine models of endothelial dysfunction. Bar A , Skórka T, Jasinski K , Sternak M , Bartel Z , Tyrankiewicz U , Chlopicki S. NMR Biomed. 2016 Aug;29(8):1088-97. doi: 10.1002/nbm.3567. Epub 2016 Jun 27.
5. Regional contrast agent quantification in a mouse model of myocardial infarction using 3D cardiac T1 mapping. Coolen BF, Geelen T, Paulis LE, Nicolay K, Strijkers GJ. J Cardiovasc Magn Reson. 2011 Oct 5;13:56. doi: 10.1186/1532-429X-13-56. PMID: 21974927
6. Three-dimensional T1 mapping of the mouse heart using variable flip angle steady-state MR imaging. Coolen BF, Geelen T, Paulis LE, Nauerth A, Nicolay K, Strijkers GJ. NMR Biomed. 2011 Feb;24(2):154-62. doi: 10.1002/nbm.1566. PMID: 20960583
7. Noninvasive mapping of endothelial dysfunction in myocardial ischemia by magnetic resonance imaging using an albumin-based contrast agent. Vandoorne K, Vandsburger MH, Jacobs I, Han Y, Dafni H, Nicolay K, Strijkers GJ. NMR Biomed. 2016 Nov;29(11):1500-1510. doi: 10.1002/nbm.3599. PMID: 27604064
8. Deoni SCL, Rutt BK, Peters TM. Rapid combined T1 and T2 mapping using gradient recalled acquisition in the steady state. Magn. Reson. Med. 2003; 49: 515–526.
Figures


