3119
3D black blood T2 mapping of the carotid artery wall with compressed sensing and data-driven parallel imaging1Department of Radiology, University of Cambridge, Cambridge, United Kingdom, 2GE Healthcare, Amersham, United Kingdom, 3GE Healthcare, Waukesha, Wisconsin, USA, 4Department of Radiology, Cambridge University Hospitals NHS Foundation Trust, Cambridge, United Kingdom
Synopsis
Quantitative MRI has many advantages over traditional contrast weighted methods, which may be more suitable for multi-centre studies across different MRI systems. This study describes the development of a 3D black blood T2 mapping sequence with the combination of compressed sensing and data-driven parallel imaging. Phantom and volunteer experiments were performed to optimise the parameters and patients with atherosclerotic carotid artery disease were scanned using the optimised sequence.
Introduction
Carotid atherosclerotic disease is one of the most common causes of death and disability worldwide1,2. Compared to traditional contrast weighted methods, quantitative MRI may be more suitable for multi-centre studies across different MRI systems. Among the quantitative relaxation values, T2 has been reported to be statistically different in different plaque components3. However, 3D T2 mapping typically has a long acquisition time which limits its application. This study describes the development of a 3D black blood T2 mapping sequence with the combination of compressed sensing (CS) and data-driven parallel imaging4, to reduce the acquisition time.Methods
Sequence: An improved motion-sensitized driven-equilibrium (iMSDE) preparation scheme5 with three different echo times (TE), was combined with a 3D fast spin echo (FSE) readout to achieve black-blood T2 mapping. The three echoes were acquired interleaved. The effect of the noise was corrected by computing the power images using Miller’s algorithm6. Then, the T2 map was generated on a voxel basis by fitting the exponential decay of power images over three echoes: $$$I_{c}(TE)^{2}=I_{0}^{2}e^{-2TE/T_{2}}$$$. A self-calibrated data-driven parallel imaging reconstruction method (Autocalibrated Reconstruction of Cartesian or ARC7) was used in the readout. A Gaussian pseudo-random undersampling pattern was used for CS. In the reconstruction, a non-linear gradient sparsifying transform with 15 iteration of conjugate gradient loops was applied to minimise the L1-norm of the object function: $$$\widehat{m}=minimize\left\{\parallel\psi m\parallel _{1}\right\}$$$ such at $$$\parallel F\widehat{m}-y\parallel _{2}^{2}\leq\epsilon$$$, before the ARC algorithm to combine images from different channels4,8. All the imaging was performed on a 3T GE MRI scanner (MR 750, GE Healthcare, Waukesah, WI), using a four channel phased-array neck coil (PACC, MachNet, Roden, The Netherlands) and in the coronal acquisition plane.
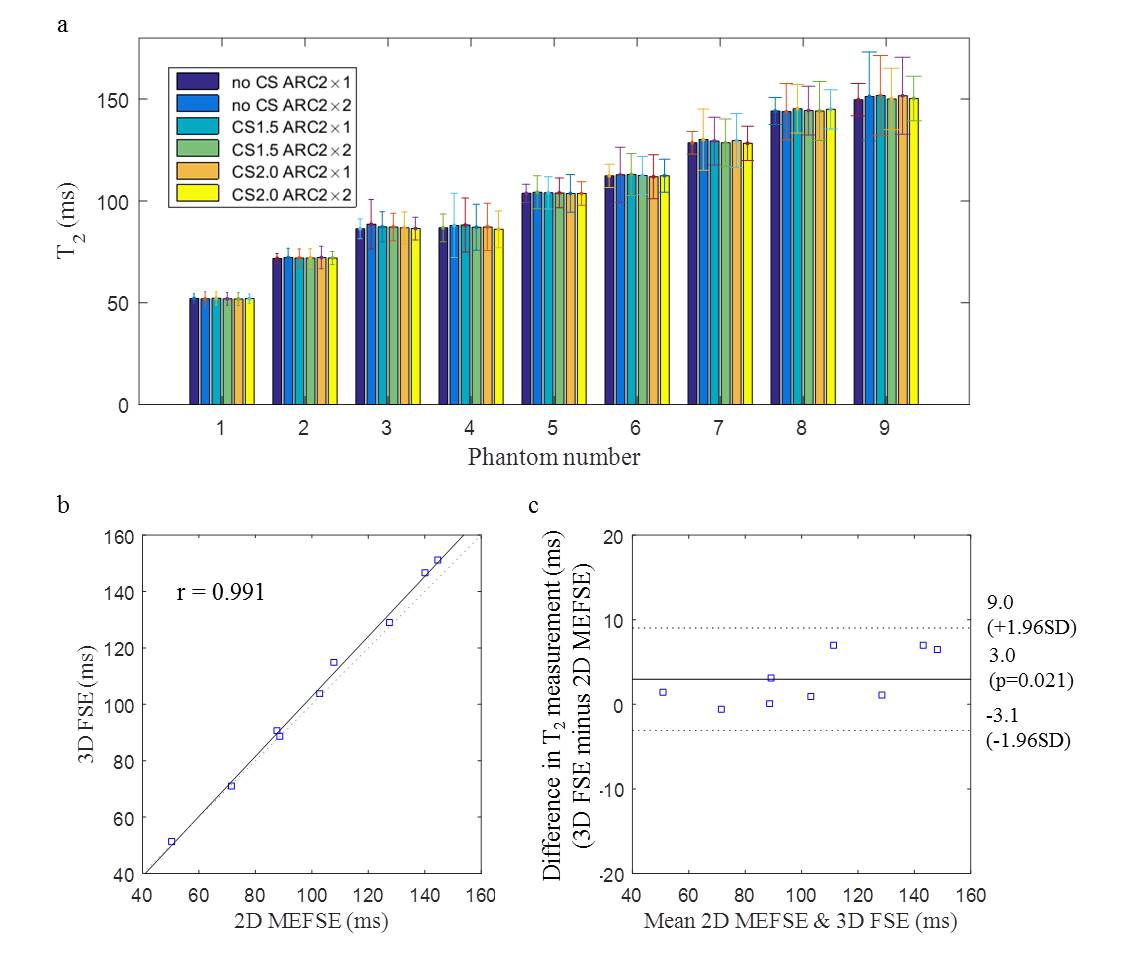
Phantom: The 3D T2 mapping sequence with the combination of two ARC values (2×1 and 2×2) without CS, and with CS factors of 1.5 and 2.0 was tested using a Eurospin gel phantom with a T2 range from 52 to 143ms. A 2D multi-echo fast spin echo sequence was used as the reference.
Volunteers: Twelve healthy volunteers were scanned twice with CS1.5 and ARC2×1 to determine the reproducibility of the sequence. The ARC2×1 without CS was also scanned once for each volunteer. The non-CS accelerated k-space data was used off-line for simulating higher ARC and CS factors. The overall image quality and wall-lumen sharpness were calculated to optimise the protocol. The scanning time for standard sequence without CS or ARC, with ARC2×1 only and with ARC2×1 and CS1.5 were 21min 38s, 10min 49s and 7min 48s, respectively.
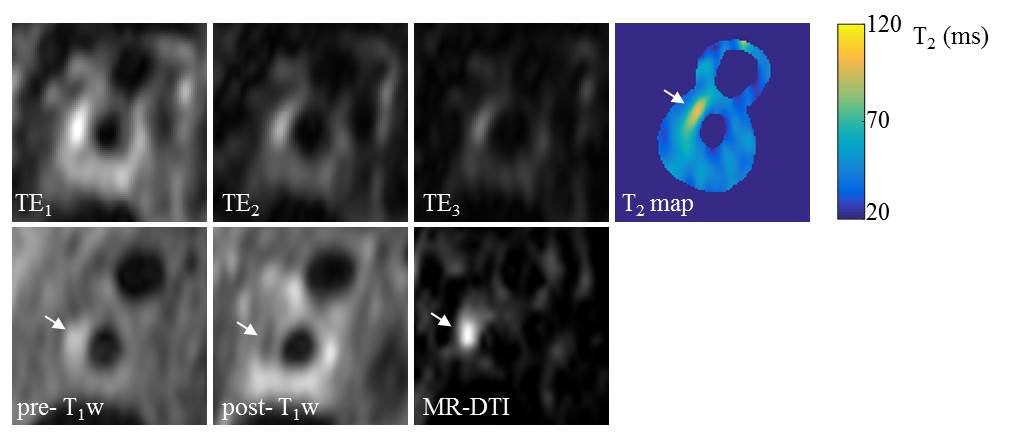
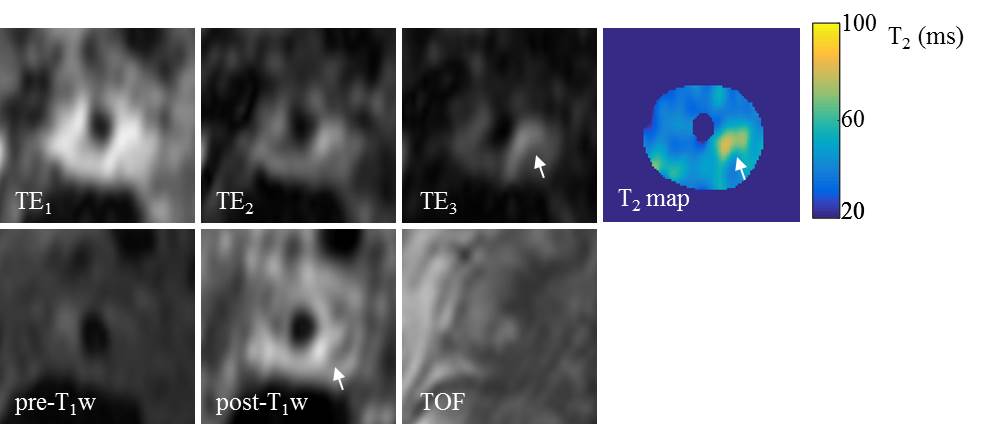
Patients: Six patients with atherosclerotic carotid artery disease underwent this examination. The T2 mapping sequence with a combination of CS1.5 and ARC2×1 was used. Acquired image resolution was 0.6×0.6×1.4mm3, TE/TR = 21.6, 51.6, 81.6/2000ms. Echo train length = 40. This study protocol was reviewed and approved by the local ethics committee and written informed consent was obtained from each volunteer and patient.
Results
The phantom study showed excellent correlation between the 3D and 2D T2 mapping results (r=0.99, figure 1). No significant difference was found between different combination of ARC and CS factors. Volunteer scans showed good reproducibility of the sequence in measuring T2 values (ICC: 0.88). Average T2 for the normal carotid wall was 56ms. The wall-lumen sharpness decreased as the CS acceleration increased (1.8, 1.7 and 1.4mm-1 for ARC2×1 with non-CS, CS1.5 and CS2.0, respectively). The T2 maps from the patient scan with intraplaque haemorrhage (IPH) and fibrous tissue are shown in figure 2 and 3. The average T2 values for the IPH and fibrous tissue were 88.1±6.8ms and 62.7±9.3ms, respectively.Discussion and conclusion
This study for the first time shows the feasibility of combining CS and parallel imaging to reduce the acquisition time of 3D black blood T2 mapping sequence to a more clinical accepted time (7min 48s) for carotid artery imaging. This sequence demonstrates accurate T2 measurement with good reproducibility.Acknowledgements
We acknowledge funding from NIHR BRC and Addenbrooke's Charitable Trust.References
1. Truelsen T, Piechowski Józwiak B, Bonita R, Mathers C, Bogousslavsky J, Boysen G. Stroke incidence and prevalence in Europe: a review of available data. European journal of neurology. 2006 Jun 1;13(6):581-98.
2. Hoyert DL, Xu J. Deaths: preliminary data for 2011. Natl Vital Stat Rep. 2012 Oct 10;61(6):1-51.
3. Degnan AJ, Young VE, Tang TY, Gill AB, Graves MJ, Gillard JH, Patterson AJ. Ex vivo study of carotid endarterectomy specimens: quantitative relaxation times within atherosclerotic plaque tissues. Magnetic resonance imaging. 2012 Sep 30;30(7):1017-21.
4. King K, Xu D, Brau AC, Lai P, Beatty PJ, Marinelli L. A new combination of compressed sensing and data driven parallel imaging. In Proc Intl Soc Magn Res Med 2010 (p. 4881).
5. Wang J, Yarnykh VL, Yuan C. Enhanced image quality in black-blood MRI using the improved motion-sensitized driven-equilibrium (iMSDE) sequence. Journal of Magnetic Resonance Imaging. 2010 May 1;31(5):1256-63.
6. Miller AJ, Joseph PM. The use of power images to perform quantitative analysis on low SNR MR images. Magnetic resonance imaging. 1993 Dec 31;11(7):1051-6.
7. Beatty PJ, Brau AC, Chang S, Joshi SM, Michelich CR, Bayram E, Nelson TE, Herfkens RJ, Brittain JH. A method for autocalibrating 2-D accelerated volumetric parallel imaging with clinically practical reconstruction times. In Proc Intl Soc Magn Res Med 2007 (p. 1749).
8. Lustig M, Donoho D, Pauly JM. Sparse MRI: The application of compressed sensing for rapid MR imaging. Magnetic resonance in medicine. 2007 Dec 1;58(6):1182-95.
Figures