3115
Cardiac CEST MRI with Dual-Echo Readout for B0 Correction: A Preliminary Reproducibility Study for Assessment of Metabolic Activity in the Heart1Biomedical Imaging Research Institute, Cedars-Sinai Medical Center, Los Angeles, CA, United States, 2Department of Bioengineering, University of California, Los Angeles, Los Angeles, CA, United States, 3MR R&D, Siemens Healthcare, Los Angeles, CA, United States
Synopsis
Previous studies have shown that cardiac CEST technique can detect myocardial metabolic abnormalities in chronic myocardial infarction. However, this navigator-gated technique is still sensitive to B0 field variations caused by respiratory motion within the acceptance window.
In this work, we developed a cardiac CEST dual-echo technique which not only acquires CEST-weighted image, but also enables acquisition of B0 map for each saturation frequency offset. The reproducibility of this technique was also assessed.
Background
ATP is the most important energy source in the myocardium. It governs the myocardial contraction. Creatine kinase (CK) system is essential in resynthesizing ATP and the capacity of substrates involved in this system, like creatine, can serve as a great indicator of the myocardial metabolic level.
Previous studies have shown the feasibility of cardiac CEST technique to detect creatine loss in chronic myocardial infarction1,2. This suggests that cardiac CEST has the potential to provide information on metabolic abnormalities for cardiac diseases. However, B0 field variations, mostly caused by respiratory motion within the acceptance window in a navigator-gated acquisition, especially on the edge of heart-lung interface, can induce errors of the CEST signal3. In addition, the reproducibility of cardiac CEST technique has not been assessed. Whether this technique can be used to detect mild myocardial metabolic impairment still needs further investigation.
In this work, we developed a cardiac CEST dual-echo technique which not only acquires CEST-weighted image, but also enables acquisition of B0 map for each saturation frequency offset. CEST reproducibility with the technique was assessed.
Methods
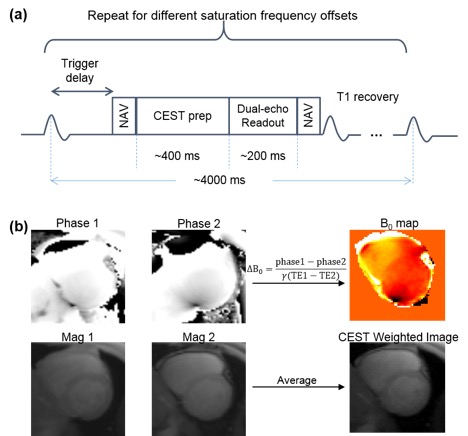
Fig. 1 shows the workflow of the proposed cardiac CEST dual-echo technique. As illustrated in the sequence diagram (Fig. 1a), images were acquired using dual-echo readout to allow simultaneous acquisition of B0 map and CEST-weighted image. Figure 1b shows the analysis of images acquired at each CEST saturation frequency offset. B0 map was generated by calculating the difference of the phase images acquired at different TE, ΔB0=(phase1-phase2)/γ(TE1-TE2). After B0 correction for each CEST-weighted image, MTRasym was calculated as MTRasym = (S(-2 ppm)–S(+2 ppm))/S0, where S0 is the signal intensity of the reference image.
Five healthy volunteers were scanned on a 3T Siemens Verio clinical scanner. CEST saturation frequency offsets range from -3.6 ppm to 3.6 ppm with a step size of 0.3 ppm. Imaging parameters are: 3 CEST saturation pulses (flip angle 2700º and duration of 80 ms at duty cycle of 50%); FOV: 350 x 280 mm2; Spatial resolution: 2.7 x 2.2 x 8.0 mm3; TE1: 0.99 ms; TE2: 2.37 ms; Partial Fourier: 6/8; iPAT: 2. Two mid-ventricular slices were acquired in each volunteer.
Results
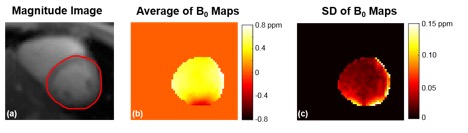
Fig.2 represents the B0 map acquired using cardiac CEST dual-echo sequence. Average and standard deviation of B0 maps acquired at different saturation frequency offsets were shown in Fig. 2b and 2c, respectively. It is clear that there is more variation of the B0 map in the lateral wall. This is mostly because B0 field changes rapidly in this region and it is more sensitive to respiratory motion than the septal region. Therefore, it is important to correct for B0 field for each image acquired at different CEST saturation frequency offsets.
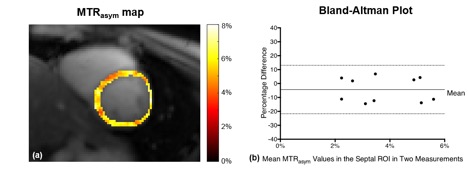
Fig. 3a shows one representative MTRasym map acquired using the proposed method. For each slice, images from two measurements were registered. One ROI was drawn in the septal region and mean MTRasym value in the ROI was calculated for each measurement. The Bland-Altman plot of the MTRasym values from the two measurements was shown in Fig. 3(b). The y axis is the percentage difference between the two measurements, defined as Difference/Average*100. The limits of agreement were -4.32 ± 17.41%.
Conclusion
We developed a cardiac CEST dual-echo method and performed reproducibility studies in healthy volunteers. Preliminary results suggest that cardiac CEST with B0 correction is reproducible. The proposed method needs to be tested in patients to assess its ability to detect mild myocardial metabolic impairment.Acknowledgements
No acknowledgement found.References
[1] Haris, M., et al. Nature medicine 20.2 (2014): 209-214.
[2] Zhou, Z., et al. JCMR 18.1 (2016): 1.
[3] Singh, A., et al. MRM 68.2 (2012): 588-594.
Figures