3114
Temporal Diffusion Spectroscopy in the Heart with Oscillating Gradients1Division of Cardiovascular Medicine, Radcliffe Department of Medicine, University of Oxford, Oxford, United Kingdom, 2Danish Research Centre for Magnetic Resonance, Centre for Functional and Diagnostic Imaging and Research, Copenhagen University Hospital Hvidovre, Denmark, 3Department of Applied Mathematics and Computer Science, Technical University of Denmark, Denmark
Synopsis
Conventional pulsed gradient spin echo, with its longer diffusion time, is poorly sensitive to diffusion at short length scales. Oscillating gradient spin echo enables assessment of diffusion at sub-cellular length scales, providing information about cell size and the intracellular environment. We observed that time dependence of diffusion in the myocardium was more pronounced along the 2nd and 3rd eigenvectors compared to the 1st eigenvector of the diffusion tensor. This is consistent with known anisotropic cardiomyocyte geometry. Furthermore, the measured diffusion at high frequencies still exhibited strong anisotropy that may reflect anisotropy of intracellular organelles such as actin-myosin filaments.
Purpose
Diffusion tensor imaging (DTI) is widely used for characterization of microstructural anisotropy. In the heart, traditionally the pulsed gradient spin echo (PGSE) is used to measure molecular diffusion, and time dependence of parameters, such as the mean apparent diffusion coefficient (ADC) and fractional anisotropy (FA), has been observed at long diffusion times [1]. However, limited gradient strengths determine a lower bound on sizes of geometries that can be measured [2]. Oscillating gradient spin echo (OGSE) instead uses a train of oscillating gradients that can be tuned to shorter diffusion times, improving specificity of the sensitivity of diffusion to restrictions of different length scales. We present the novel use of OGSE for exploring sub-cellular scale microstructure in the myocardium.Methods
One heart was excised from a female C57BL/6 mouse and fixed in paraformaldehyde. The heart was subsequently flushed with PBS to restore T2 [3] and embedded in a tube of 2% agarose gel for MRI. Imaging was performed on a 9.4 T preclinical scanner (Agilent Technologies, Santa Clara, CA) with a 20 cm bore using a transmit-receive quadrature coil. Diffusion MRI data were acquired with a 2D spin echo sequence: TR / TE = 1500 / 48 ms, matrix = 64 x 64, in-plane resolution = 0.15 mm, slice thickness = 0.5 mm, NEX = 8, 1 non-DW image and 10 non-collinear directions from Camino [4], and total acquisition time = 2 h 21 min. Cosine-modulated OGSE data were acquired with frequency, f = 50, 100, 150, 200, 250 Hz and effective diffusion times ranging from about 5 to 1 ms. For comparison, PGSE data were acquired with diffusion duration, δ = 1 ms, and diffusion time, Δ = 10, 20, 30, 40 ms. The maximum gradient strength, gmax, was adjusted to achieve b = 512 s/mm2 in each experiment, and ranged from 213 ≤ gmax ≤ 950 mT/m. Tensors were fitted to the data using non-linear least squares in Matlab (Mathworks, Natick, USA). Mean ADC, principal eigenvalues λ1, λ2 and λ3, and FA were calculated. The myocardium, gel and buffer were segmented based on non-DW signal intensity and mean ADC thresholds. Data were subsequently compared to the analytical description of the diffusion spectrum in cylindrical geometries [5].Results
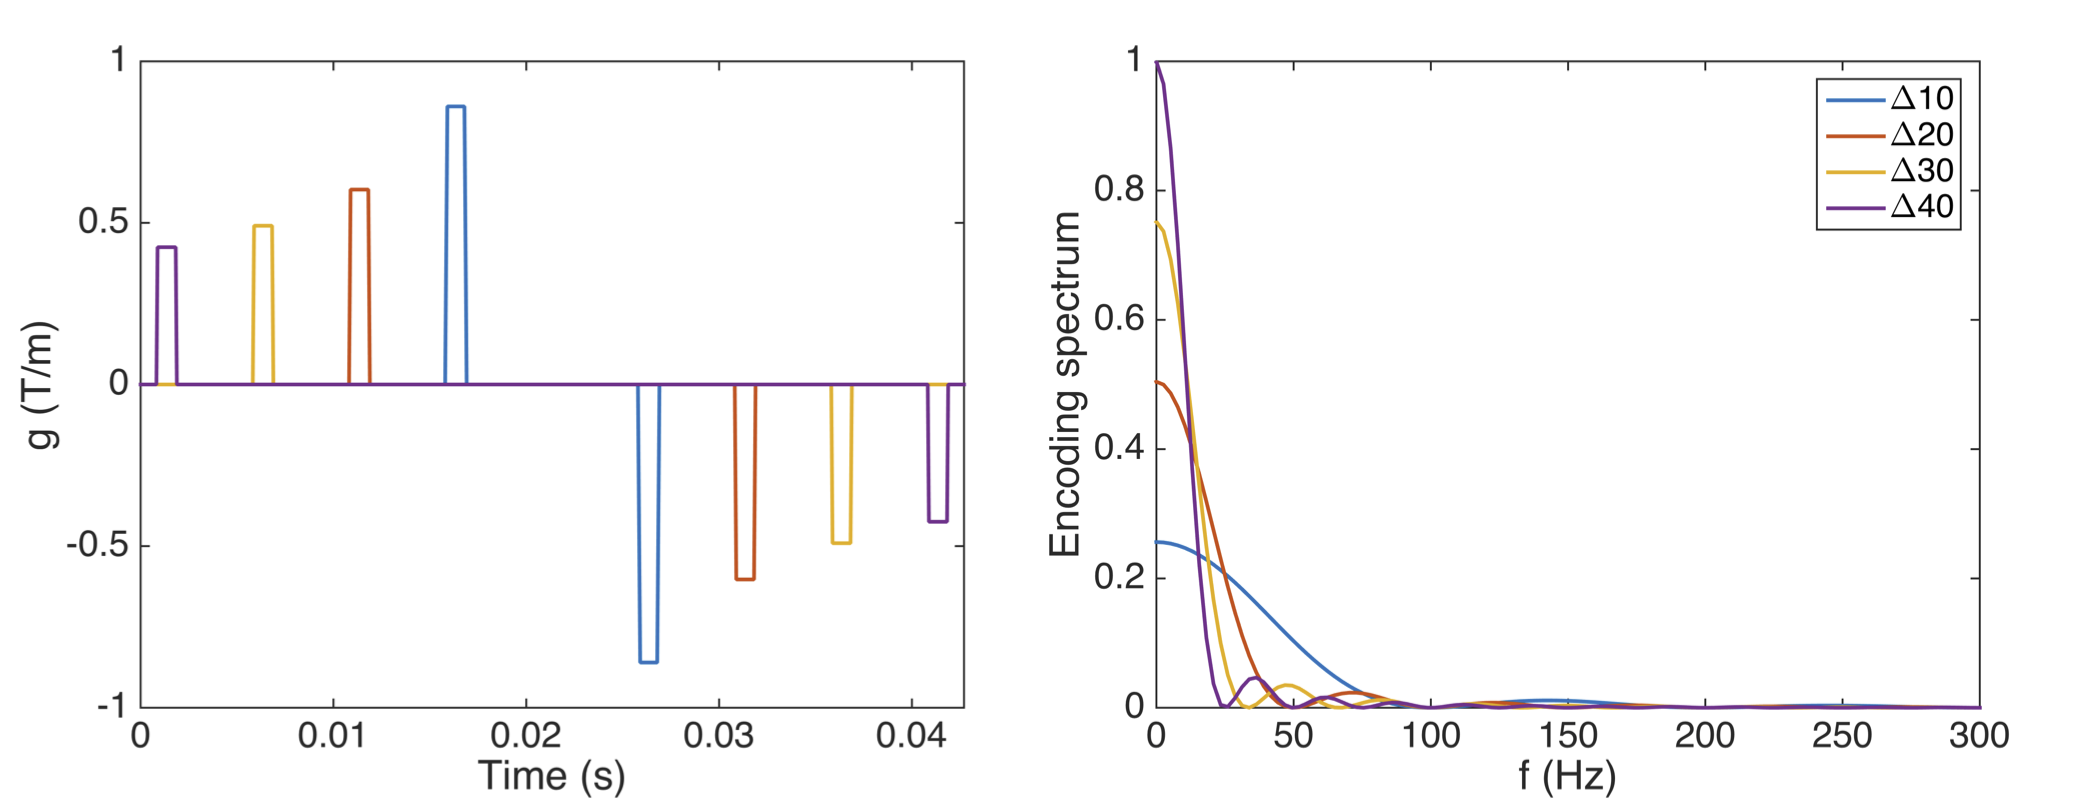
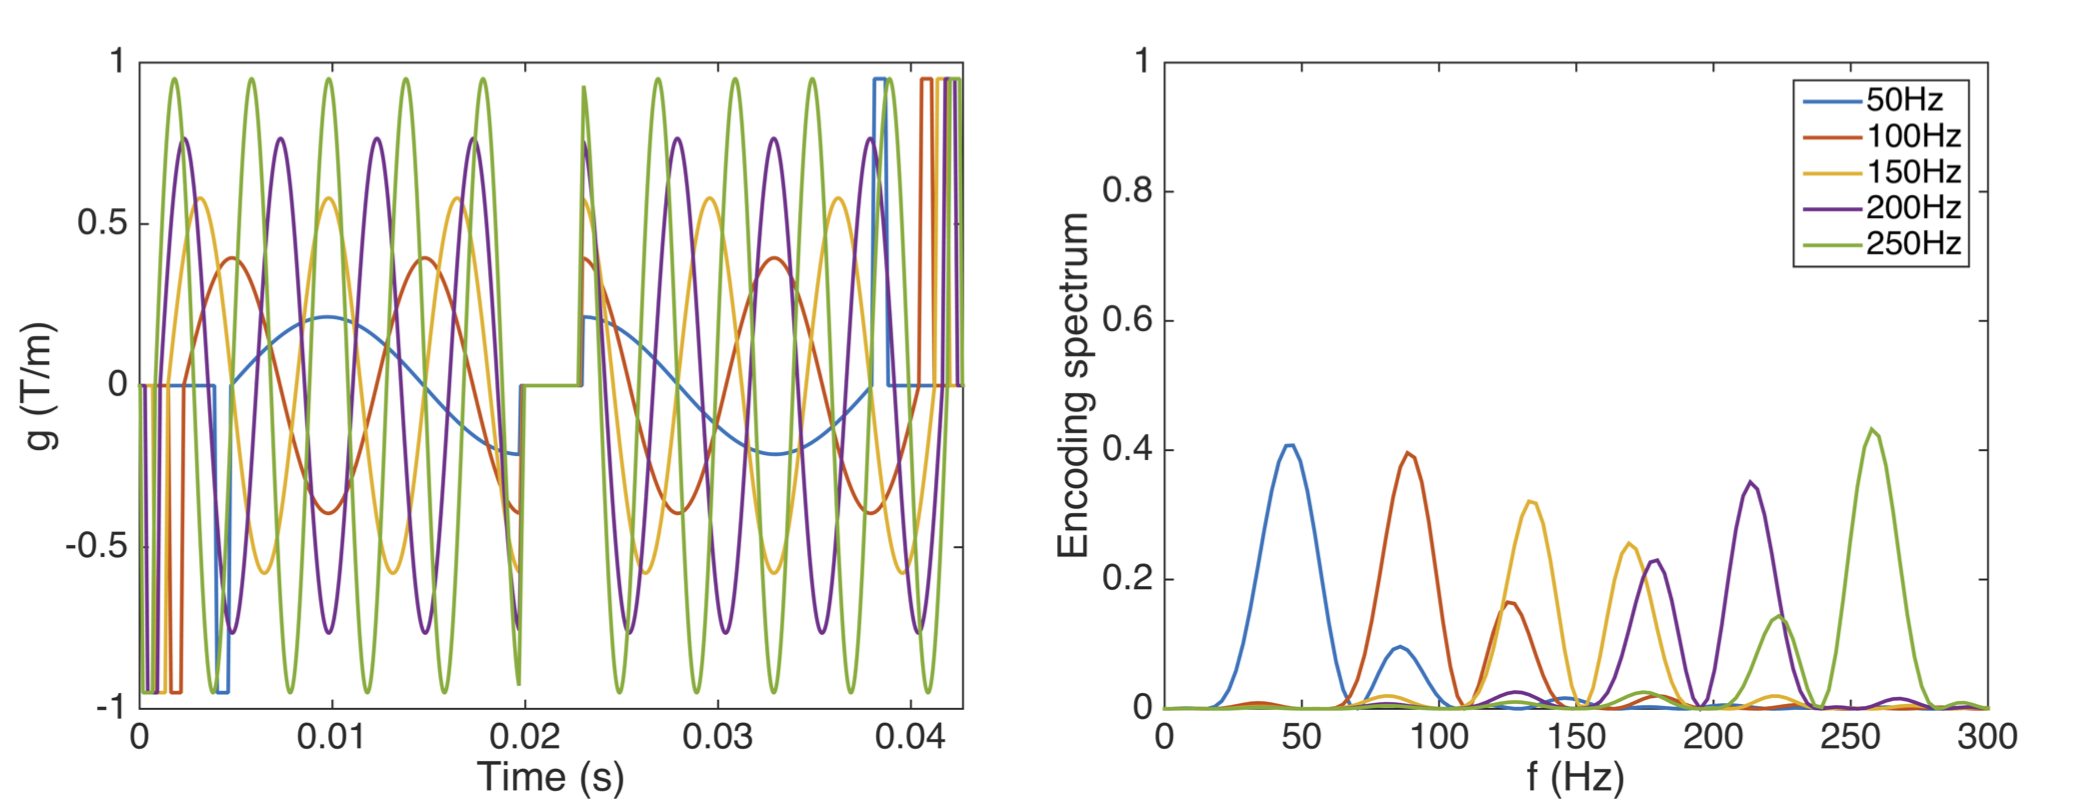
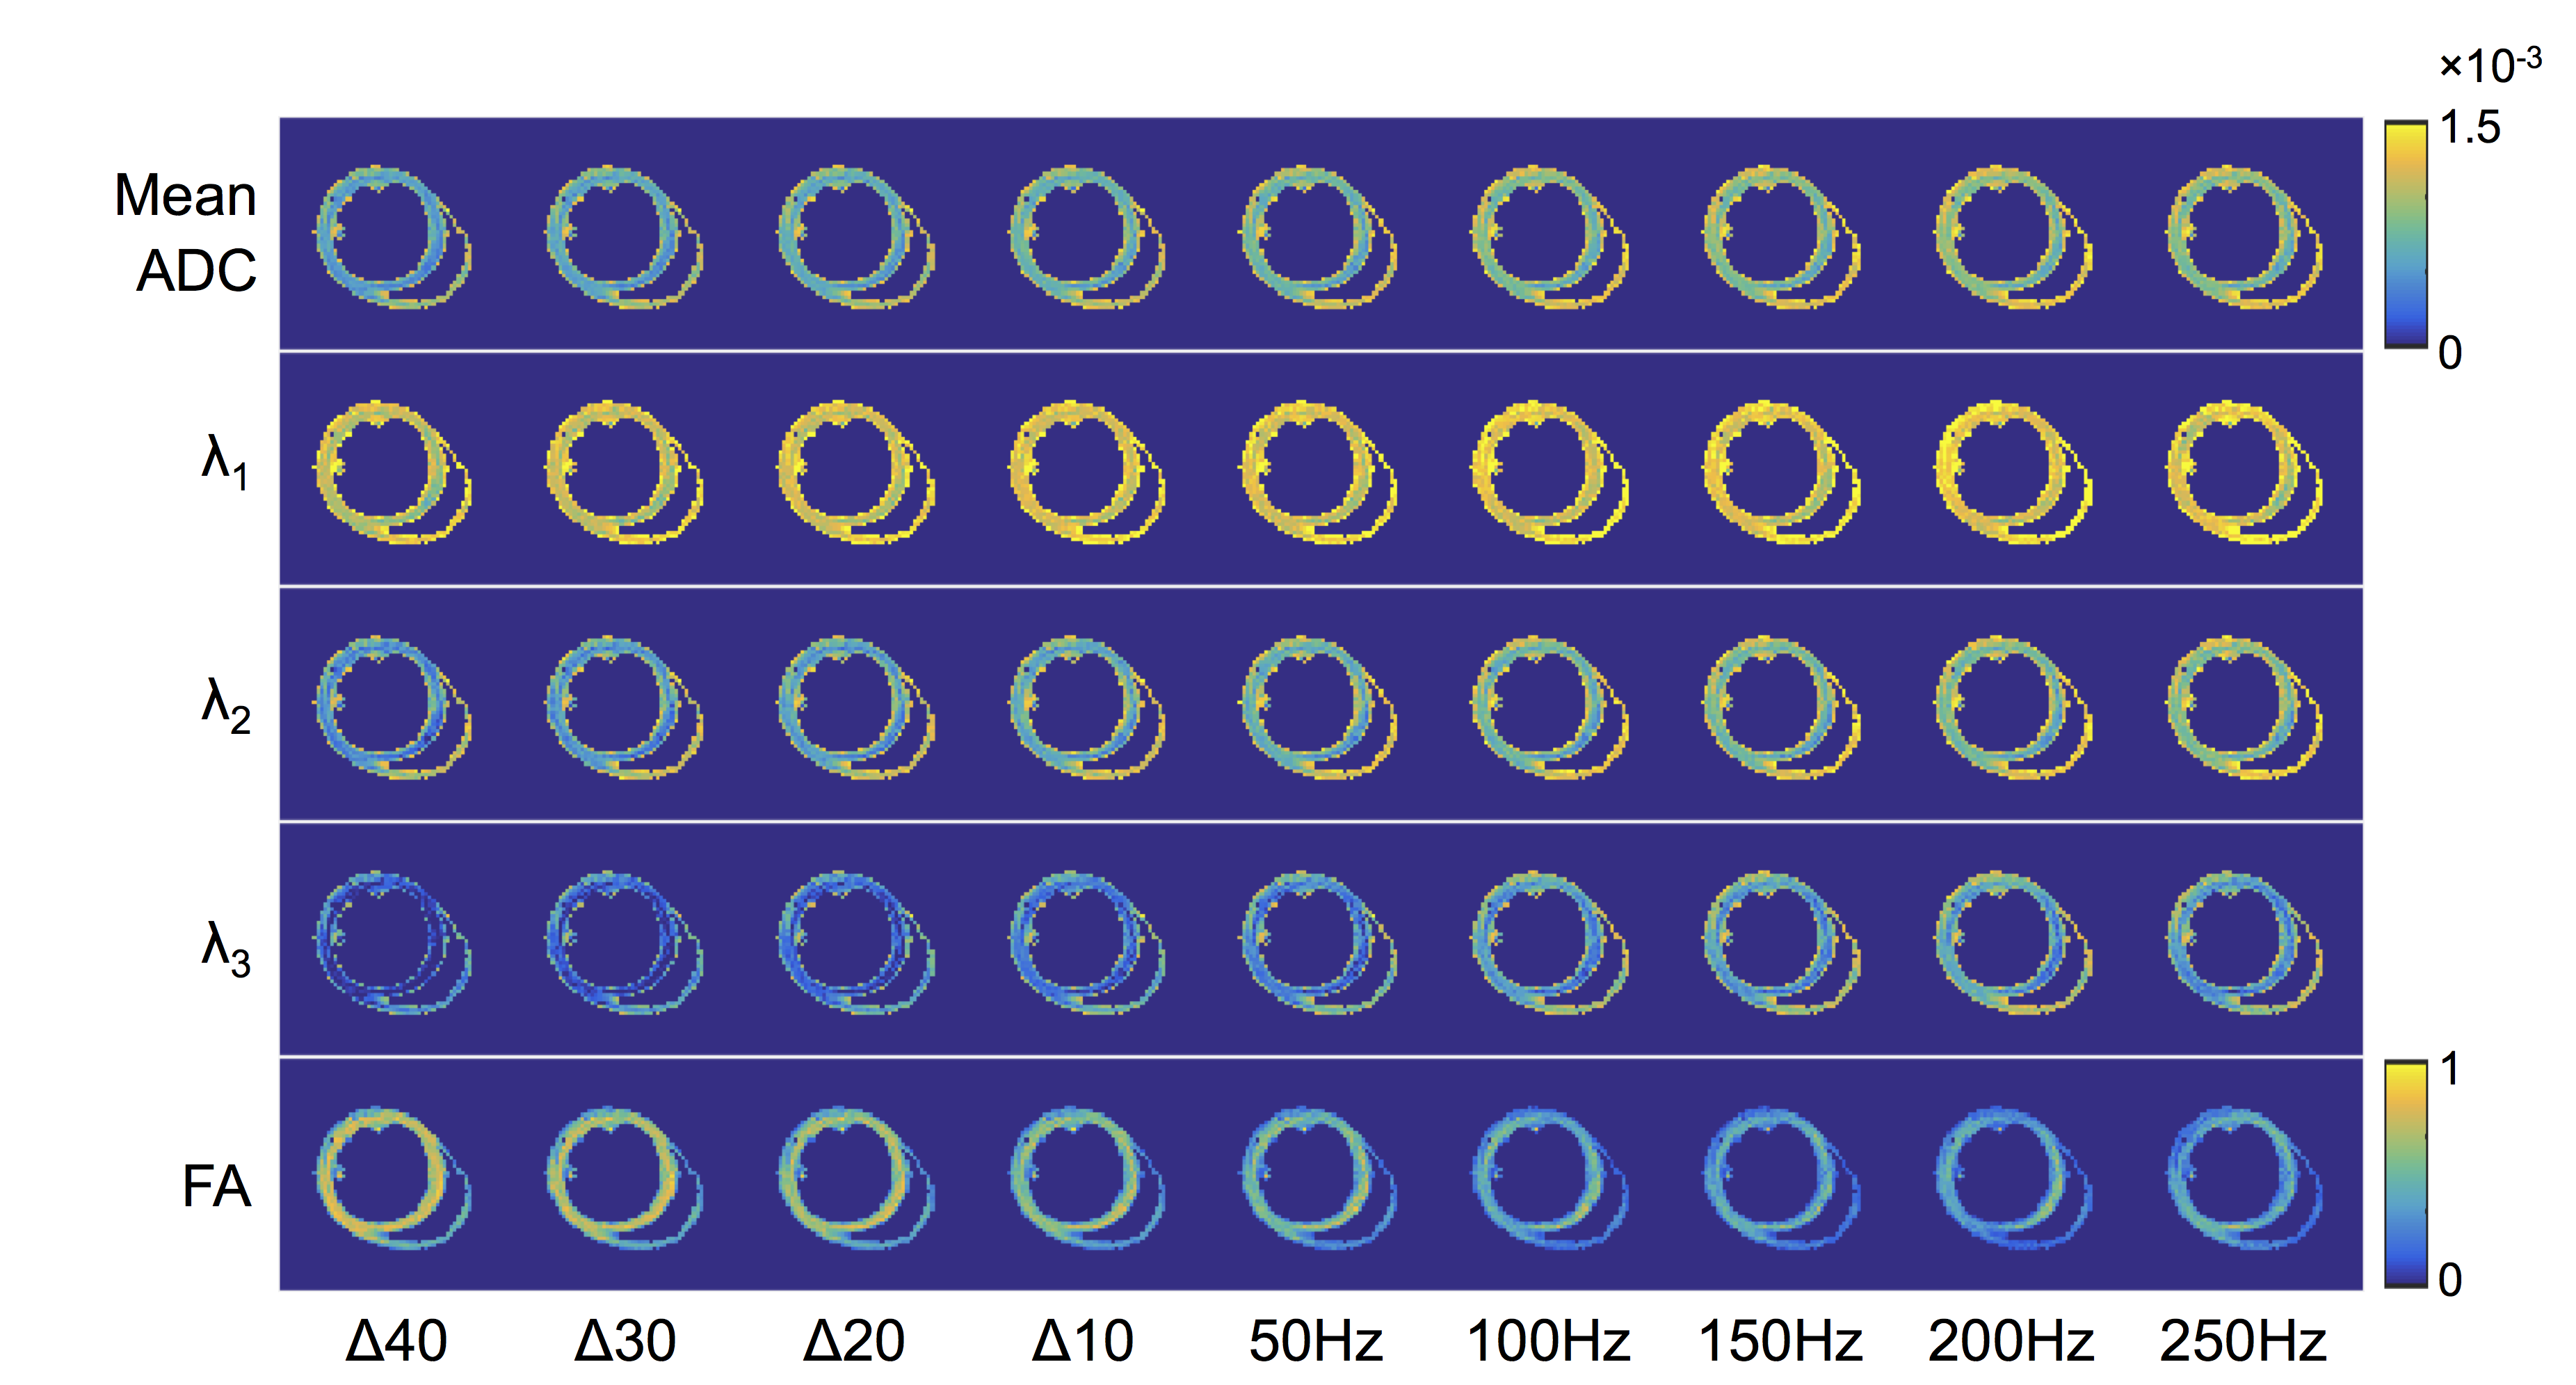
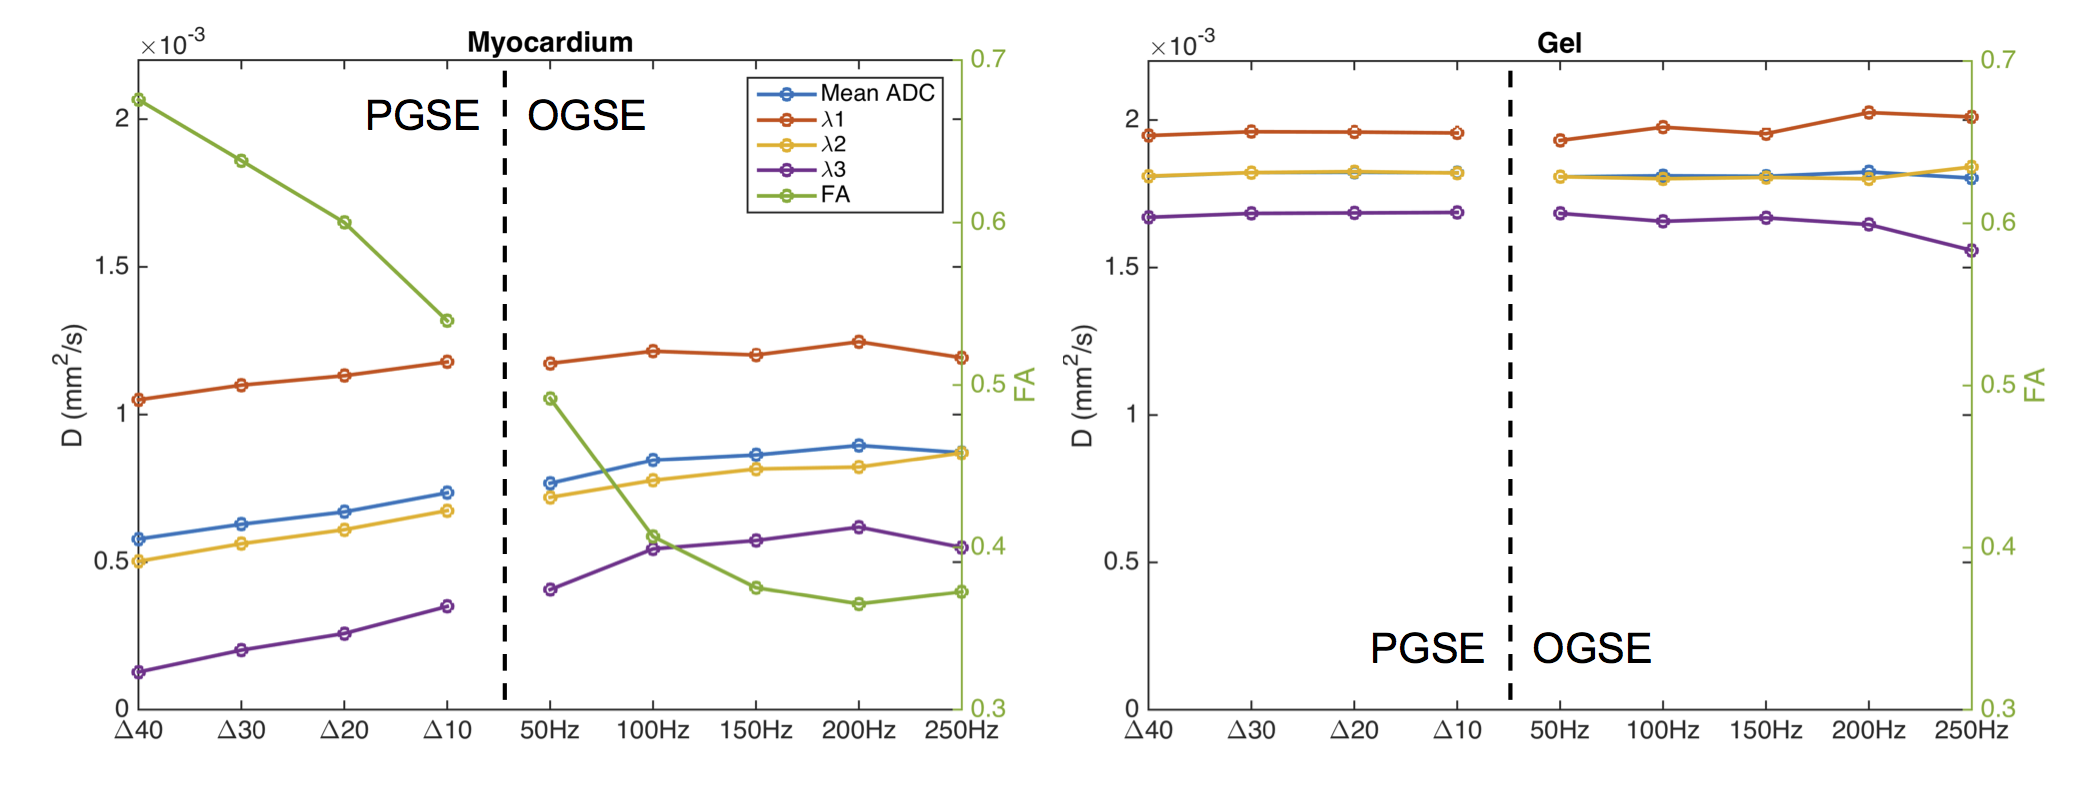
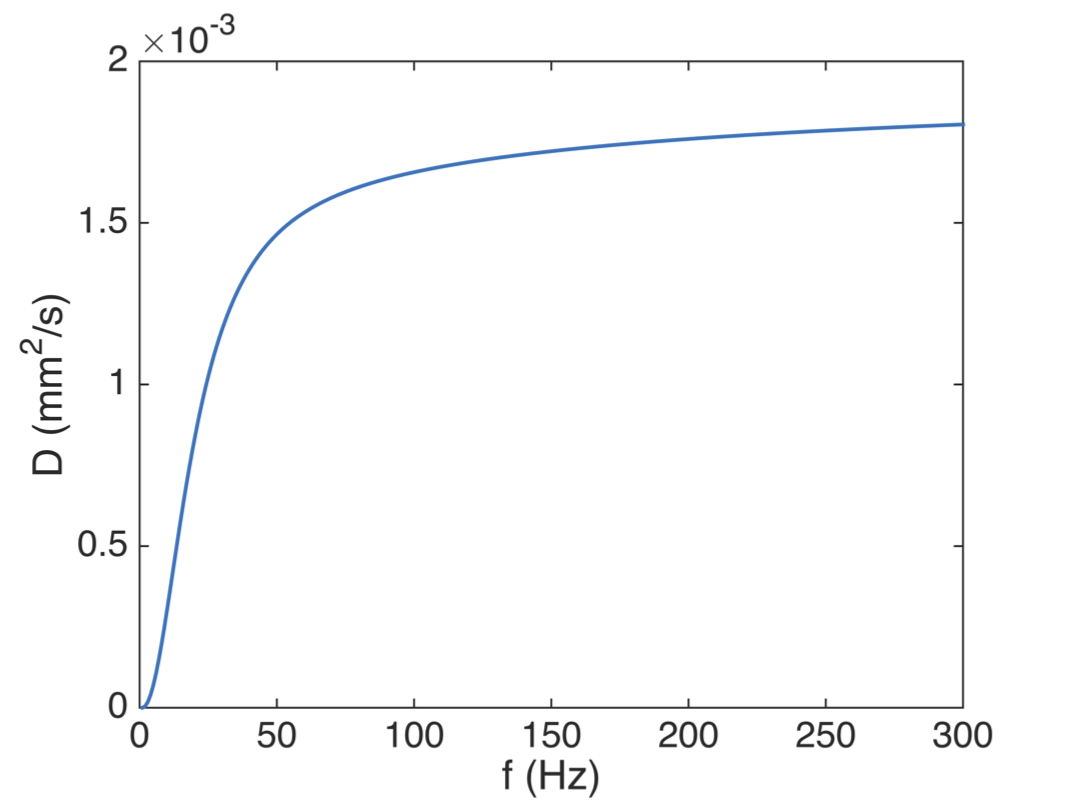
Figures 1 and 2 show the diffusion gradient waveforms used for PGSE and OGSE, alongside their respective diffusion encoding spectrums, F(ω). In PGSE, F(ω) is centred at 0 Hz, with longer Δ leading to sharper peaks. In OGSE, the mean F(ω) is centred on the nominal frequency. Figures 3 and 4 illustrate that the time dependence of diffusion in this frequency range is more prominent along the 2nd and 3rd eigenvectors compared to the 1st eigenvector. This reflects the much smaller cell diameters relative to cell lengths. Figure 5 shows that in the limit of long and short diffusion times, the mean diffusivity in idealized uniform cylinders approaches zero and the free diffusivity of water respectively. A transition from low to high frequency behaviour is observed at around 100 Hz, and this effect is recapitulated in λ3 in the experimental data.Discussion
The variable time dependence of diffusion along the 1st, 2nd and 3rd eigenvectors is consistent with the known anisotropic geometry of cardiomyocytes, and we observe minimal effects of restrictions along the 1st eigenvector even at lower frequencies of 50 Hz. The variation in time dependence with direction would likely be accentuated further at higher spatial resolutions with reduced partial volume and cell dispersion. Asymptotic values of λ1, λ2 and λ3 are approached from about 100 Hz and upwards. Even at these higher frequencies, prominent diffusion anisotropy is observed, which may reflect anisotropic intracellular structures such as actin-myosin filaments. Probing higher frequencies with OGSE is technically demanding, requiring gradient systems with high gmax and rapid slew rates, and could be further explored with circularly polarized OGSE [6]. We performed here the first OGSE investigation of the time dependence of diffusion in the myocardium. OGSE has better sensitivity than PGSE to diffusion at short length scales, and can be used to assess sizes of cellular and subcellular structures [7]. By the same token, OGSE facilitates early detection of intracellular diffusion changes that precede changes in cell density [8], and could potentially provide early biomarkers in cardiac pathologies such as hypertrophy and fibrosis.Acknowledgements
This work was supported by the EPSRC, UK (EP/J013250/1), BBSRC, UK (BB/I012117/1) and the British Heart Foundation (BHF) Centre for Research Excellence, UK (RE/13/1/30181 & FS/11/50/29038). The authors acknowledge a Wellcome Trust Core Award (090532/Z/09/Z). HL is supported by the Danish Council for Independent Research (4093-00280A and 4093-00280B).References
1. Froeling M, Mazzoli V, Nederveen AJ, Luijten PR, Strijkers GJ. Ex vivo cardiac DTI: on the effects of diffusion time and b-value. Journal of cardiovascular magnetic resonance, 2014;16 (Suppl 1):P77.
2. Dyrby TB, Baare WF, Alexander DC, Jelsing J, Garde E, Sogaard LV. An ex vivo imaging pipeline for producing high-quality and high-resolution diffusion-weighted imaging datasets. Human brain mapping 2011;32(4):544-563.
3. Shepherd TM, Thelwall PE, Stanisz GJ, Blackband SJ. Aldehyde fixative solutions alter the water relaxation and diffusion properties of nervous tissue. Magnetic resonance in medicine. 2009;62(1):26-34.
4. Cook PA, Symms M, Boulby PA, Alexander DC. Optimal acquisition orders of diffusion-weighted MRI measurements. Journal of Magnetic Resonance Imaging 2007;25(5):1051-1058.
5. Stepisnik J. Time-Dependent Self-Diffusion by Nmr Spin-Echo. Physica B 1993;183(4):343-350.
6. Lundell H, Sonderby CK, Dyrby TB. Diffusion Weighted Imaging with Circularly Polarized Oscillating Gradients. Magn Reson Med 2015;73(3):1171-1176.
7. Drobnjak I, Zhang H, Ianus A, Kaden E, Alexander DC. PGSE, OGSE, and sensitivity to axon diameter in diffusion MRI: Insight from a simulation study. Magnetic resonance in medicine. 2016;75(2):688-700.
8. Colvin DC, Loveless ME, Does MD, Yue Z, Yankeelov TE, Gore JC. Earlier detection of tumor treatment response using magnetic resonance diffusion imaging with oscillating gradients. Magn Reson Imaging 2011;29(3):315-323.
Figures