3113
Precision and sensitivity of radial MOLLI sequence for fast myocardial T1 mapping1NMR Laboratory, Institute of Myology, Paris, France, 2NMR Laboratory, CEA, DRF, I²BM, MIRCen, Paris, France
Synopsis
Quantitative cardiac NMR imaging, and more particularly T1 mapping has become a most important modality to characterize myocardial tissue. In this work, we evaluated the precision and sensitivity of a fast radial MOLLI sequence by comparison with conventional MOLLI on 14 subjects presenting different heart rates, BMI and cardiac conditions. This sequence demonstrated the same precision on T1 estimates than conventional MOLLI, and was not influenced by heart rate variations. It might represent a good candidate for ultra-fast acquisition of myocardial T1 maps.
PURPOSE
Cardiac T1
mapping is becoming a most popular non-invasive modality to characterize
myocardial tissues, and a wide range of NMR sequences are being developed to
perform accurate and precise measurements. Among the most reliable methods, one
can cite MOLLI1, SASHA2 and SAPPHIRE3
acquisition schemes. Depending on the approach, the acquisition time of a
single slice varies between 9 and 17 heartbeats. Recently, a radial variant of
the MOLLI sequence (raMOLLI) was introduced and allowed to significantly
decrease the acquisition time of myocardial T1 maps down to 5 heartbeats while
providing accurate T1 values4. In this work, we evaluated the
precision and sensitivity of this novel approach by comparison with
conventional MOLLI on 14 subjects presenting different heart rates (HR), BMI
and cardiac conditions.METHODS
Experiments were performed at 3T (Prisma, Siemens). The raMOLLI sequence consisted in the acquisition of 5 shots of 80 radial spokes at end of diastole with a fast low angle shot (FLASH) readout after non-selective inversion. A golden angle of 111,2° was imposed between 2 successive spokes to ensure optimal k-space coverage. Sequence parameters were: TR = 2.4ms, BW = 1000 Hz/pix, nominal flip angle (FA) = 8°. A total of 50 different images were reconstructed with a view sharing method using a KWIC filter for data selection and a compressed sensing algorithm based on total variation regularization. Bloch simulations combined with a dictionary fitting method (700 values for T1 between 300 and 3000ms and 20 values for FA between 2 and 8°) were then used to fit the temporal evolution of the signal and obtain a T1 map4. Eight healthy volunteers (26.5±3.4y.o., BMI = 22.1±2.2, range [19.3-26], HR = 1059±224ms, range [845-1446ms]) were investigated using the raMOLLI sequence and six patients suffering from Becker muscular dystrophy (BMD, 50.8±16.3y.o, BMI=24.4±5.1, range [17.5-31.4], HR = 776±91ms, range [663-877ms]) were scanned before and 10 minutes after injection of a Gd-DOTA contrast agent. This genetic disease, caused by an X-linked recessive mutation leading to a defective dystrophin expression, is frequently associated with myocardial involvement, eventually progressing to a dilated cardiomyopathy5. For comparison, standard 3-3-5 MOLLI was also acquired with the following parameters: TE/TR = 1.25/2.5ms, FA = 35°, TImin = 100ms with 80ms increment. T1 values were assessed in 16 regions of interest manually drawn according to the nomenclature proposed by the American Heart Association6.RESULTS
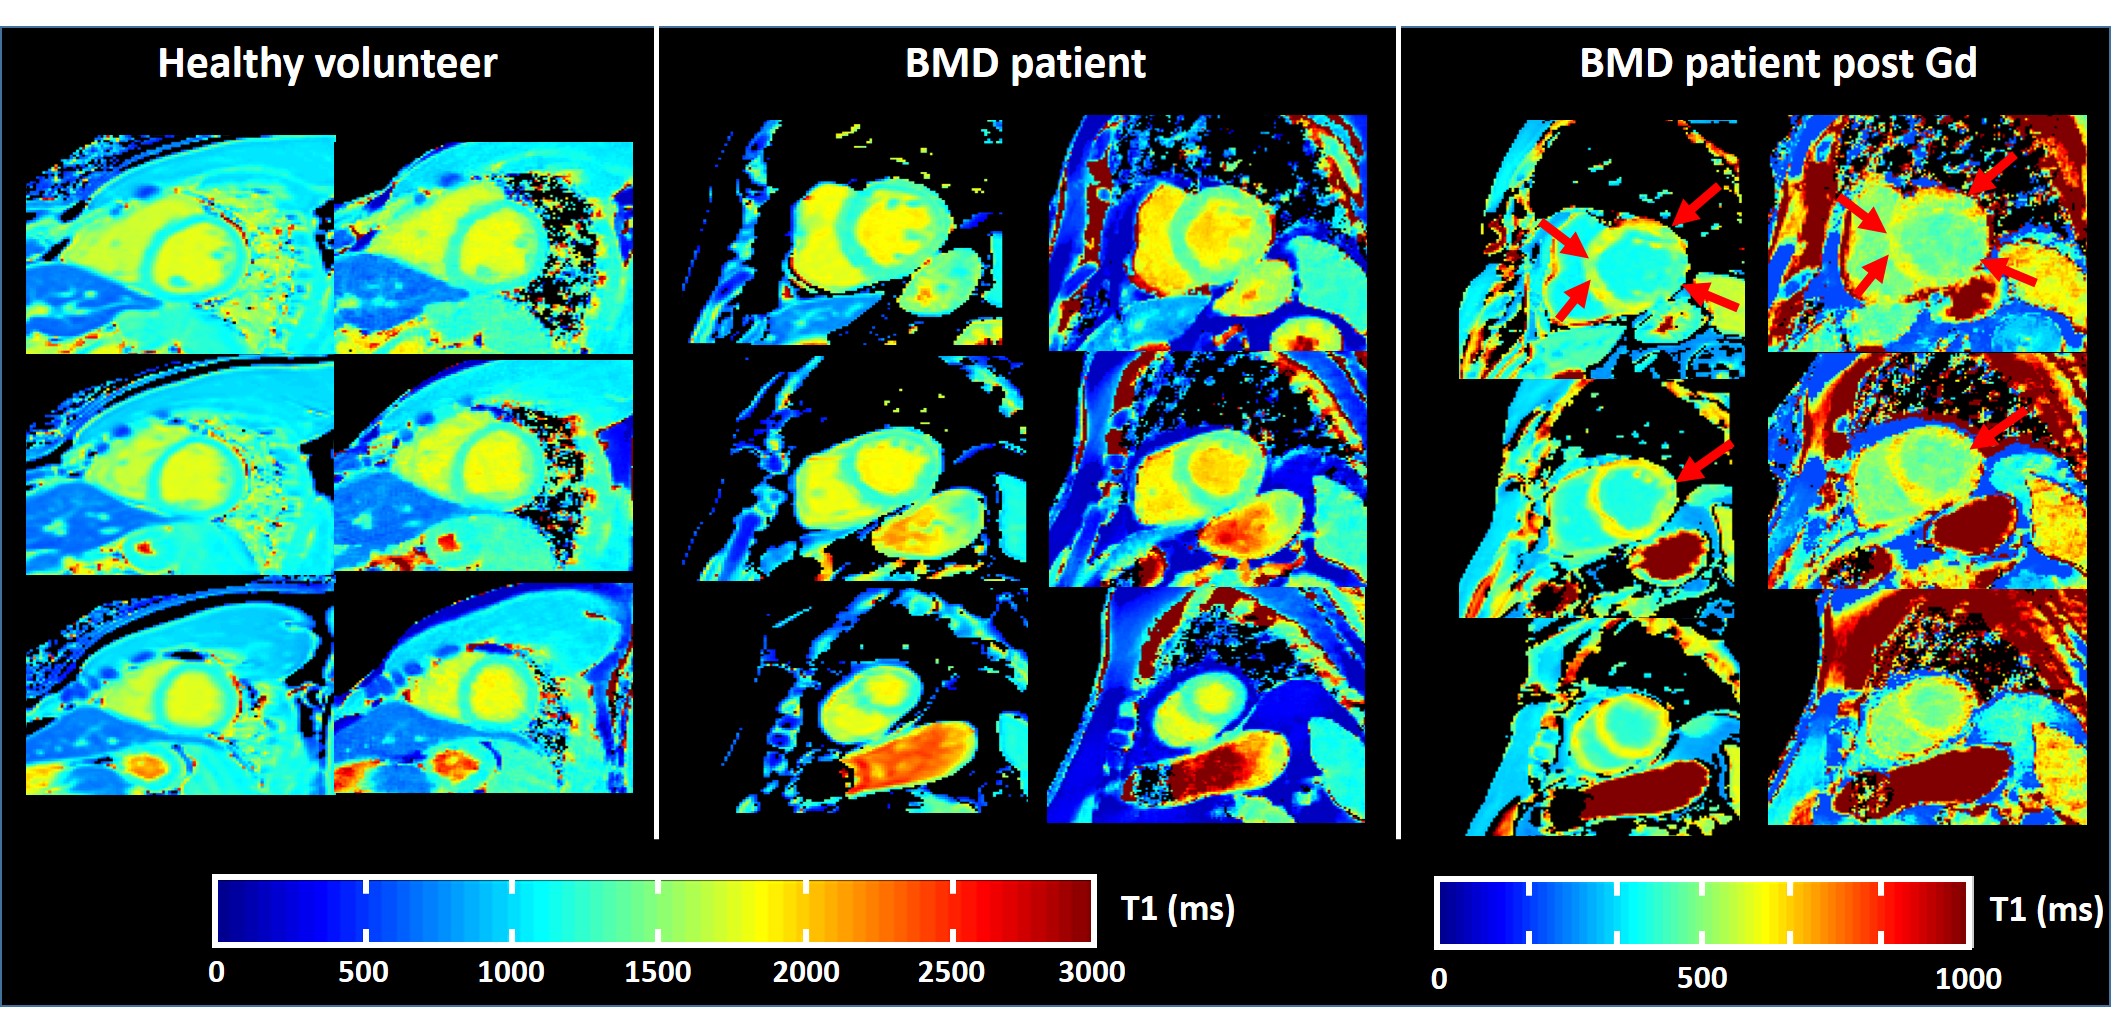
Figure 1 represents typical T1 maps reconstructed at the
basal, medial and apical levels for a healthy volunteer and a BMD patient
before and after Gd injection using both MOLLI and raMOLLI sequences. As
depicted by the red arrows, regions with decreased post-injection T1 values were
identical with the two acquisitions schemes. Mean T1 values and coefficients of
variation were summarized in table 1 for the two sequences. T1 values measured
with the raMOLLI sequence were significantly higher in both groups (p<0.01).
Coefficient of variations of the T1 measures were slightly but significantly decreased with the
raMOLLI sequence (p<0.01). Both MOLLI and raMOLLI T1 values were
statistically increased in the BMD group compared to healthy volunteers
(p<0.01). For both methods, T1 values did not correlate with HR on healthy
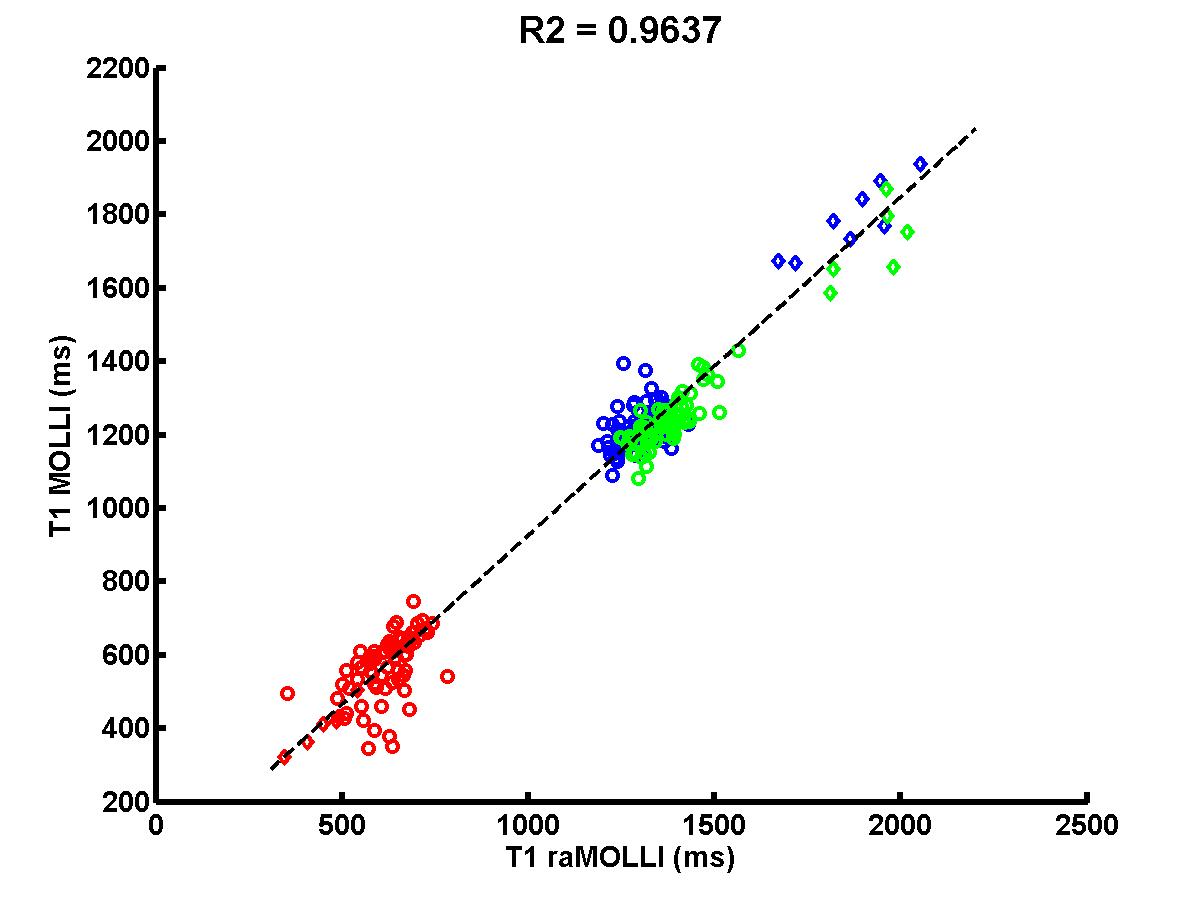
volunteers (R2 = 0.009 and 0.01 respectively). Finally, T1 measurements
were highly correlated between the two approaches on the whole dataset (figure
2, R2 = 0.96).DISCUSSION/CONCLUSION
The raMOLLI
sequence was successfully acquired on the 14 subjects presenting different features
for HR, BMI and cardiac conditions. On the 8 healthy volunteers, this approach
demonstrated the same precision on T1 estimates than conventional MOLLI, and
was not influenced by heart rate variations. Both raMOLLI and MOLLI acquisition
schemes were able to reveal pre-Gd increased T1 values in some patients, which
were generally associated with an increased distribution volume of the Gd-based
contrast agent. T1 measurements with the two sequences were highly correlated.
This demonstrates the sensitivity of the raMOLLI approach to measure abnormal
T1 values. Finally, these promising results suggest that the radial MOLLI
sequence is a good candidate for ultra-fast acquisition of myocardial T1 maps.Acknowledgements
No acknowledgement found.References
1- Messroghli DR, Radjenovic A, Kozerke S, Higgins DM, Sivananthan MU, Ridgway JP. Modified Look-Locker inversion recovery (MOLLI) for high-resolution T1 mapping of the heart. Magn Reson Med. 2004 Jul;52(1):141-6.
2- Chow K, Flewitt JA, Green JD, Pagano JJ, Friedrich MG, Thompson RB. Saturation recovery single-shot acquisition (SASHA) for myocardial T(1) mapping. Magnetic resonance in medicine 2014;71:2082–95.
3- Weingärtner S, Akçakaya M, Basha T, Kissinger K V, Goddu B, Berg S, Manning WJ, Nezafat R. Combined saturation/inversion recovery sequences for improved evaluation of scar and diffuse fibrosis in patients with arrhythmia or heart rate variability. Magnetic resonance in medicine 2014;71:1024–34.
4- Marty B, Coppa B, Carlier PG, Radial MOLLI sequence for fast, precise and accurate myocardium T1 mapping. Proc ISMRM 2016, p0986.
5- Ho R, Nguyen ML, Mather P. Cardiomyopathy in becker muscular dystrophy: Overview. World J Cardiol. 2016 Jun 26;8(6):356-61. doi: 10.4330/wjc.v8.i6.356.
6- Cerqueira MD, Weissman NJ, Dilsizian V, et al. Standardized myocardial segmentation and nomenclature for tomographic imaging of the heart. A statement for healthcare professionals from the Cardiac Imaging Committee of the Council on Clinical Cardiology of the American Heart Association. Circulation 2002;105:539–42.
Figures