3111
Myocardial Motion Velocity in Patients with Cirrhotic Cardiomyopathy1National Tsing Hua University, Hsinchu, Taiwan, 2Department of Radiology, Kaohsiung Veterans General Hospital, Kaohsiung, Taiwan, 3Department of Medical Imaging, National Taiwan University Hospital, Taipei
Synopsis
In this study, we employed MR tissue phase mapping (TPM) to evaluate three-directional left ventricular velocity. The purpose of this study is to establish quantitative indices to comprehend the characteristics of myocardial motion in patients with cirrhotic cardiomyopathy. Compared with normal subjects, patients displayed lower systolic Vz and prolonged systolic TTPz. Lower systolic Vphi was also demonstrated in patient group. In conclusion, to analyze myocardial velocity and TTP can potentially provide helpful information for realizing the myocardial compensatory mechanism in patients with cirrhotic cardiomyopathy.
Introduction
Patients with cirrhotic cardiomyopathy usually exhibit systolic as well as diastolic dysfunction and electrical mechanical abnormalities.1 Previous study adopted echocardiography and reported several clinical indices, including cardiac fibrosis, myocardial hypertrophy and subendothelial oedema for diagnosis of cirrhotic cardiomyopathy2, a robust technique to accurately investigate abnormal myocardial motion for patients with cirrhotic cardiomyopathy is still deficient. In this study, we employed MR tissue phase mapping (TPM) to evaluate three-directional left ventricular velocity. The purpose of this study is to establish quantitative indices to comprehend the characteristics of myocardial motion in patients with cirrhotic cardiomyopathy.Methods
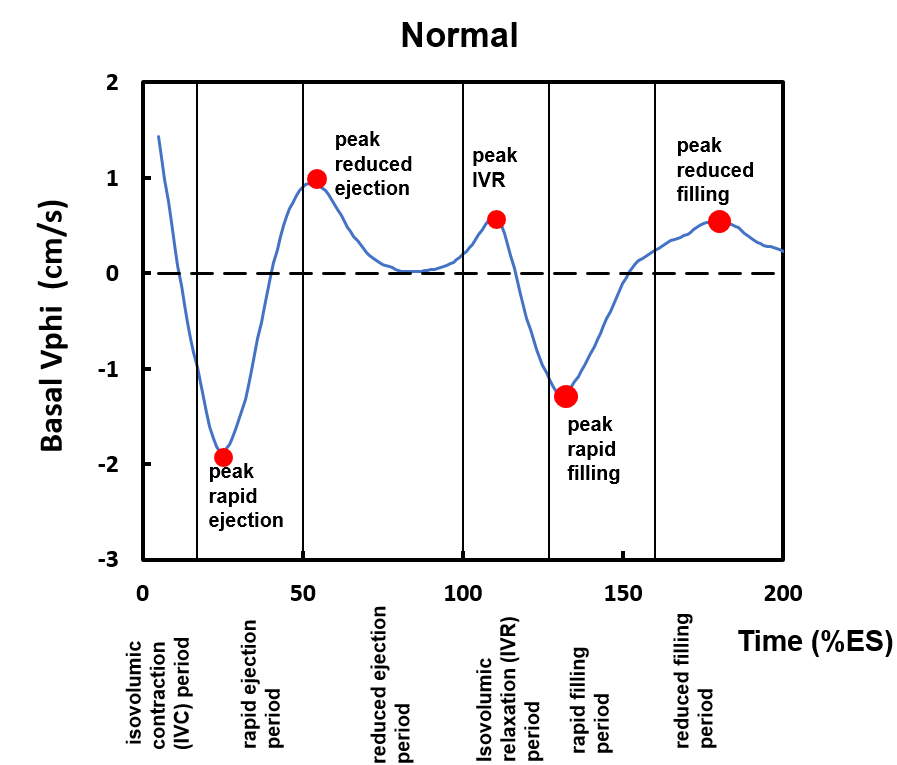
We recruited 18 cirrhosis patients (age = 59.6 ± 6.7 years; male /female = 6/12) and 14 normal subjects (age = 46.0 ± 5.0 years; male /female = 6/8) without any known cardiovascular diseases. All TPM images were acquired in a 3-T scanner (Tim Trio or Skyra, Siemens, Erlangen, Germany). 2D dark-blood phase-contrast imaging adopted by fast low angle shot (FLASH) sequence was performed for acquiring myocardial velocity information. The TPM images were acquired with parameters of TR/TE= 12/5.2 ms, flip angle=7°, pixel size=1.04x1.04x6 mm3, temporal resolution=24 ms; Venc=15 cm/s in-plane and 25 cm/s through-plane and acquired myocardial motion velocity in basal, middle, and apical short-axis views. The LV was divided into 16 segments according to the AHA 16-segment model (6 basal, 6 mid, and 4 apical regions). The time frame was normalized to the individual end-systolic time, which determined by the first crossing-zero point of the global radial velocity during late systole. For each segment, peak velocity (radial: Vr, circumferential: Vphi, and longitudinal: Vz) and time-to-peak (TTPr, TTPphi, TTPz) in three directions were calculated. Five specific cardiac statuses in the time course of the circumferential velocity were selected and used to compare the different characteristic between normal and patient group, as shown in Figure 1. A △TTPphi, describing the period to complete a full cardiac contraction, was defined as the time difference between peak rapid ejection and peak reduced filling time. All statistical analyses were performed using SPSS16 (SPSSInc. Chicago, Illonosis). Student’s t test was used to test the difference between two groups. A p<0.05 was considered as statistically significant.Results
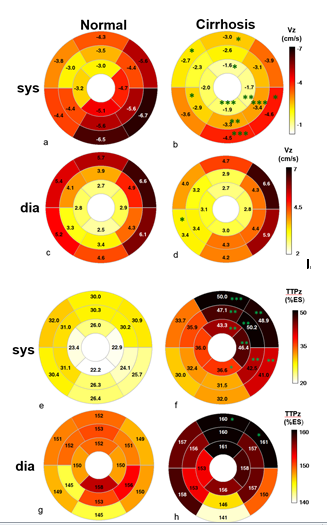
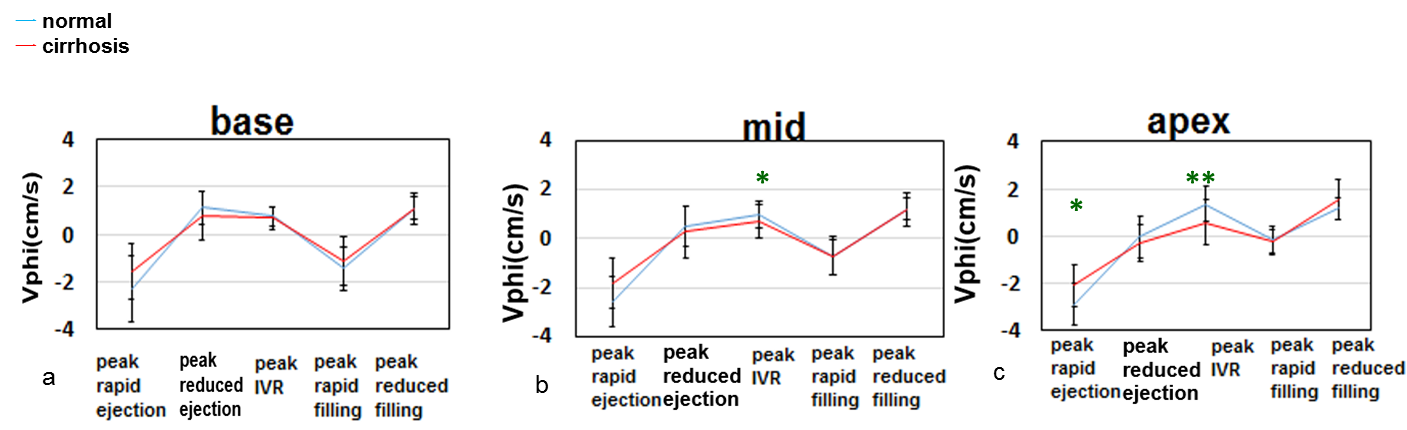
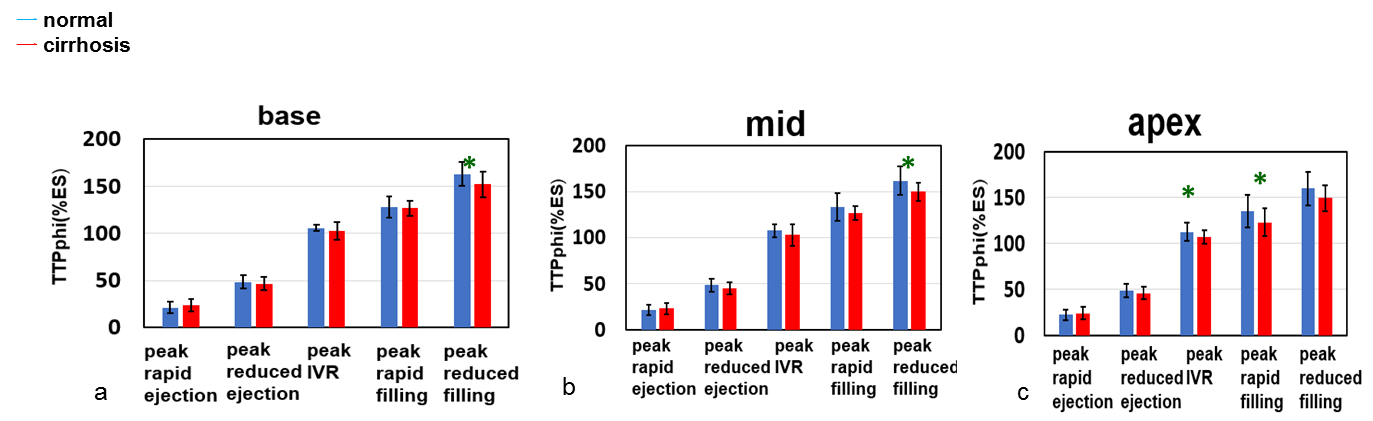
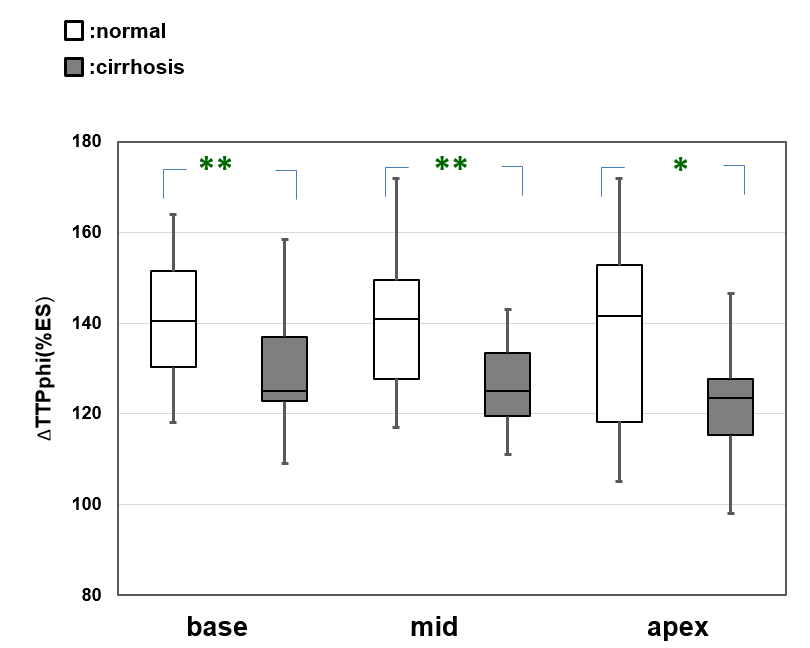
Compared with normal subjects, patients displayed lower systolic Vz at inferolateral segments and prolonged systolic TTPz at anterolateral segments (Figure 2). Lower systolic Vphi was demonstrated in patient group, in particular at peak isovolumetric relaxation (IVR) time in mid and apex (Figure 3). Lower TTPphi values at peak reduced filling time of base and mid as well as at peak IVR and peak rapid filling of apex were also shown in patient group (Figure 4). The patient group also exhibited significant lower △TTPphi in basal, mid and apical slices (Figure 5).
Discussion and Conclusion
In this study, TPM technique was used to explore the myocardial motion velocity in patient with cirrhotic cardiomyopathy. Patient group demonstrated lower systolic Vphi and Vz. Zardi et al reported that prolongation of QT interval is considered to be related to cirrhosis.1,4 In our work, the prolonged systolic TTPz was consistent with the previous study. It may reflect a compensatory mechanism, maintaining a longer period for the longitudinal contraction and thereby to compensate the reduced systolic Vz. The association between cardiac fibrosis and diastolic dysfunction were verified in previous studies.5 Diastolic dysfunction in cirrhotic patients is considered to be an early sign of cardiac fibrosis. The shorter TTPphi and △TTPphi might also reveal the abnormal diastolic function and imply the phenomena of myocardial fibrosis by exerting less-elastic myocardium. In conclusion, to analyze myocardial velocity and TTP can potentially provide helpful information for realizing the myocardial compensatory mechanism in patients with cirrhotic cardiomyopathy.Acknowledgements
No acknowledgement found.References
1. Zardi et al. Cirrhotic cardiomyopathy. Journal of the American College of Cardiology 2010;56:539-549.
2. Pozzi et al. Evidence of functional and structural cardiac abnormalities in cirrhotic patients with and without ascites. Hepatology 1997;26:1131-1137.
3. Jung B et al. Detailed analysis of myocardial motion in volunteers and patients using high-temporal-resolution MR tissue phase mapping. Journal of Magnetic Resonance Imaging 2006;24:1033-1039.
4. Gould L et al. Cardiac hemodynamics in alcoholic patients with chronic liver disease and a presystolic gallop. Journal of Clinical Investigation 1969;48:860.
5. Moon J et al. Myocardial late gadolinium enhancement cardiovascular magnetic resonance in hypertrophic cardiomyopathy caused by mutations in troponin I. Heart 2005;91:1036-1040.
Figures