3109
In-vivo comparison of STEAM EPI and STEAM spiral diffusion-weighted sequences1Cardiovascular Biomedical Research Unit, The Royal Brompton Hospital, London, United Kingdom, 2National Heart and Lung Institute, Imperial College, London, United Kingdom, 3National Heart, Lung and Blood Institute, National Institutes of Health, Bethesda, MD, United States
Synopsis
A cardiac DTI STEAM spiral sequence with a novel asymmetric zonal excitation and a reduced FOV was implemented and compared to an established STEAM EPI sequence. 10 volunteers were scanned in systole and diastole and standard cDTI parameters were compared for both sequences. The spiral trajectory is both efficient and motion robust and its centre-out nature allows a shorter echo time and, therefore an increase in image SNR over EPI. The spiral trajectory is also able to take full advantage of the two-dimensional reduced in-plane field-of-view (FOV) made possible by the 3 RF pulses used in the STEAM sequence.
Background
Cardiac diffusion tensor imaging (cDTI) is a
unique non-invasive technique that provides insights into myocardial
microstructure and may assist in diagnosing heart disease1,2. Stimulated echo acquisition mode
(STEAM) cDTI is commonly used with an echo-planar imaging (EPI) readout. A
spiral readout is an efficient and motion robust alternative trajectory as
previously demonstrated with stimulated echoes in DENSE3 and a proof-of-concept study with
STEAM cDTI4. By measuring the k-space centre
first, it also allows a shorter TE than EPI thereby enhancing the SNR. In
this work a comparison between a STEAM EPI and STEAM spiral cDTI was performed
in vivo.Methods
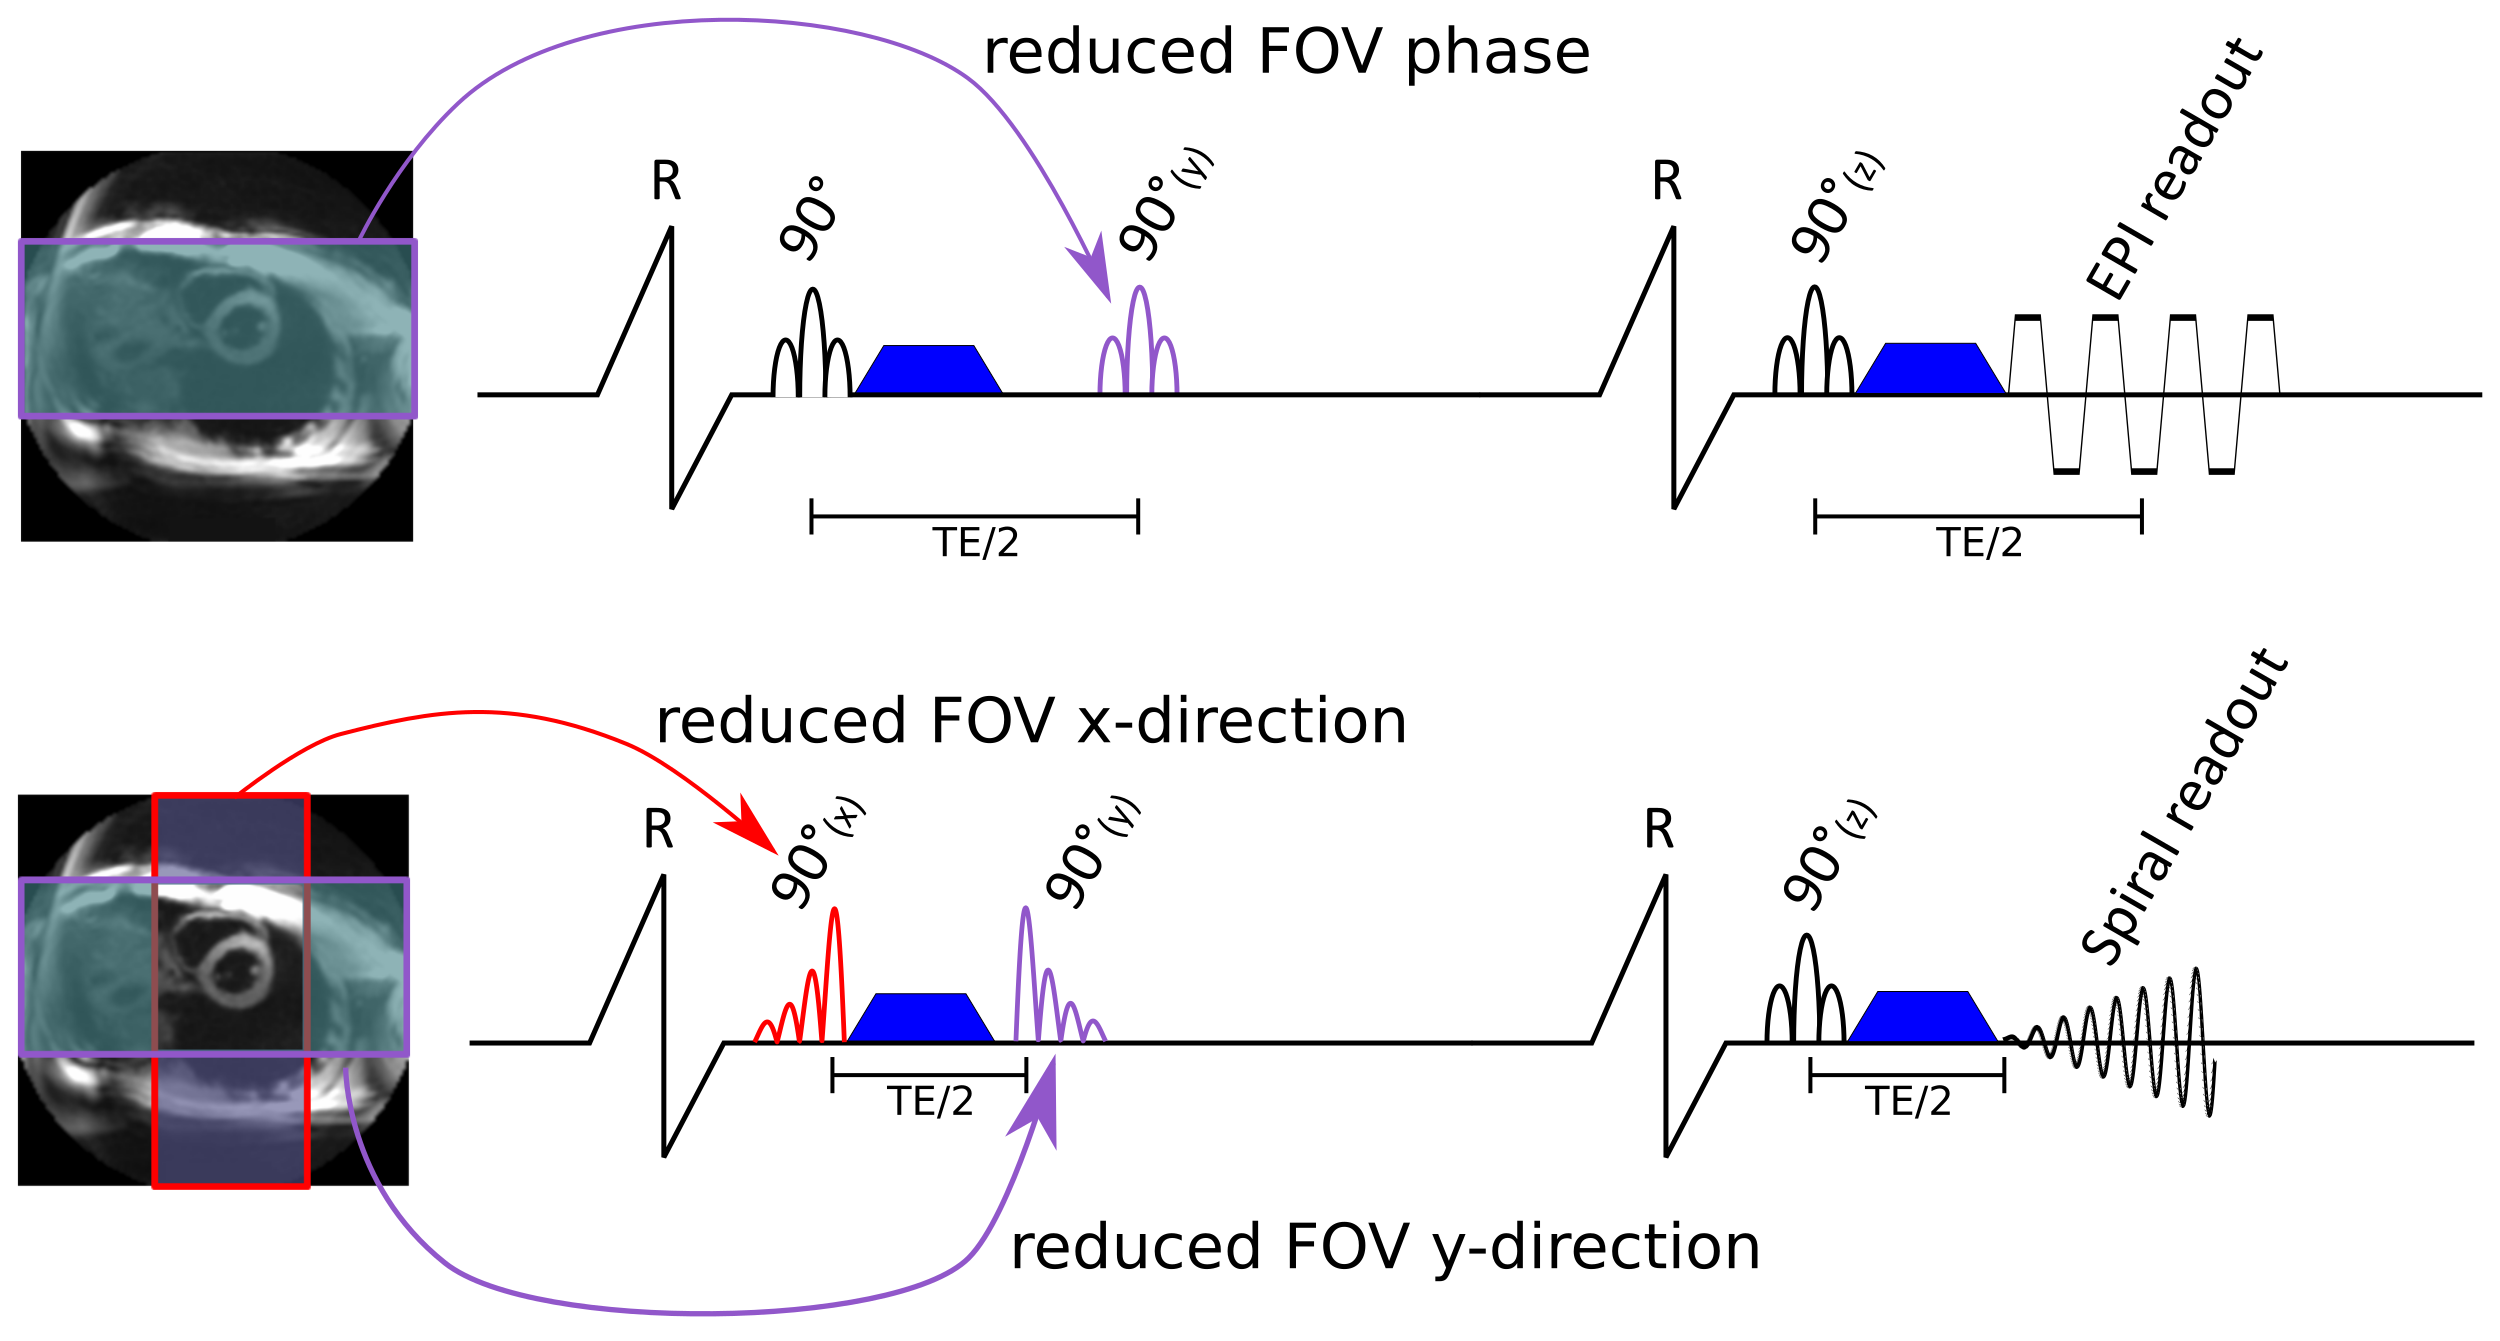
Both sequences are shown in figure 1. Data were acquired on a Siemens Skyra 3T scanner. A signal to noise ratio (SNR) measurement on an agar phantom (agar 40g/L., T2=49ms, T1=888ms, MD=1.2x10⁻³mm2/s) was performed for b=600s/mm2 and b=150s/mm2. Protocol parameters matched those of the in-vivo study described below, with TR=3s and 30 averages. The SNR per average was calculated using the repeated measurement technique5,6.
Spiral and EPI STEAM cDTI was performed in the mid-ventricular short-axis in 10 volunteers (5 female, 27 [20-35] years, heart rate 62 [53-72] bpm) at both peak-systole and diastole. Data were obtained in 6 diffusion directions using bmain=600s/mm2 (8 averages) and bref=150s/mm2 (1 average). The readout duration was 13ms for the EPI and 15ms for the spiral, TE was 23ms for the EPI and 12ms for the spiral; and TR was two cardiac cycles for both sequences. Zonal excitation via slice selective pulses was used in two directions for the EPI and three directions for the spiral. A reduced field of view (FOV) allows either the use of a shorter readout for the same resolution or an increased resolution. The FOV was 360x135mm2 (read x phase) for the EPI and 120x120mm2 for the spiral, the resolution was 2.8x2.8mm2 with 8mm slice thickness. For the EPI acquisition parallel imaging with SENSE x2 was used.
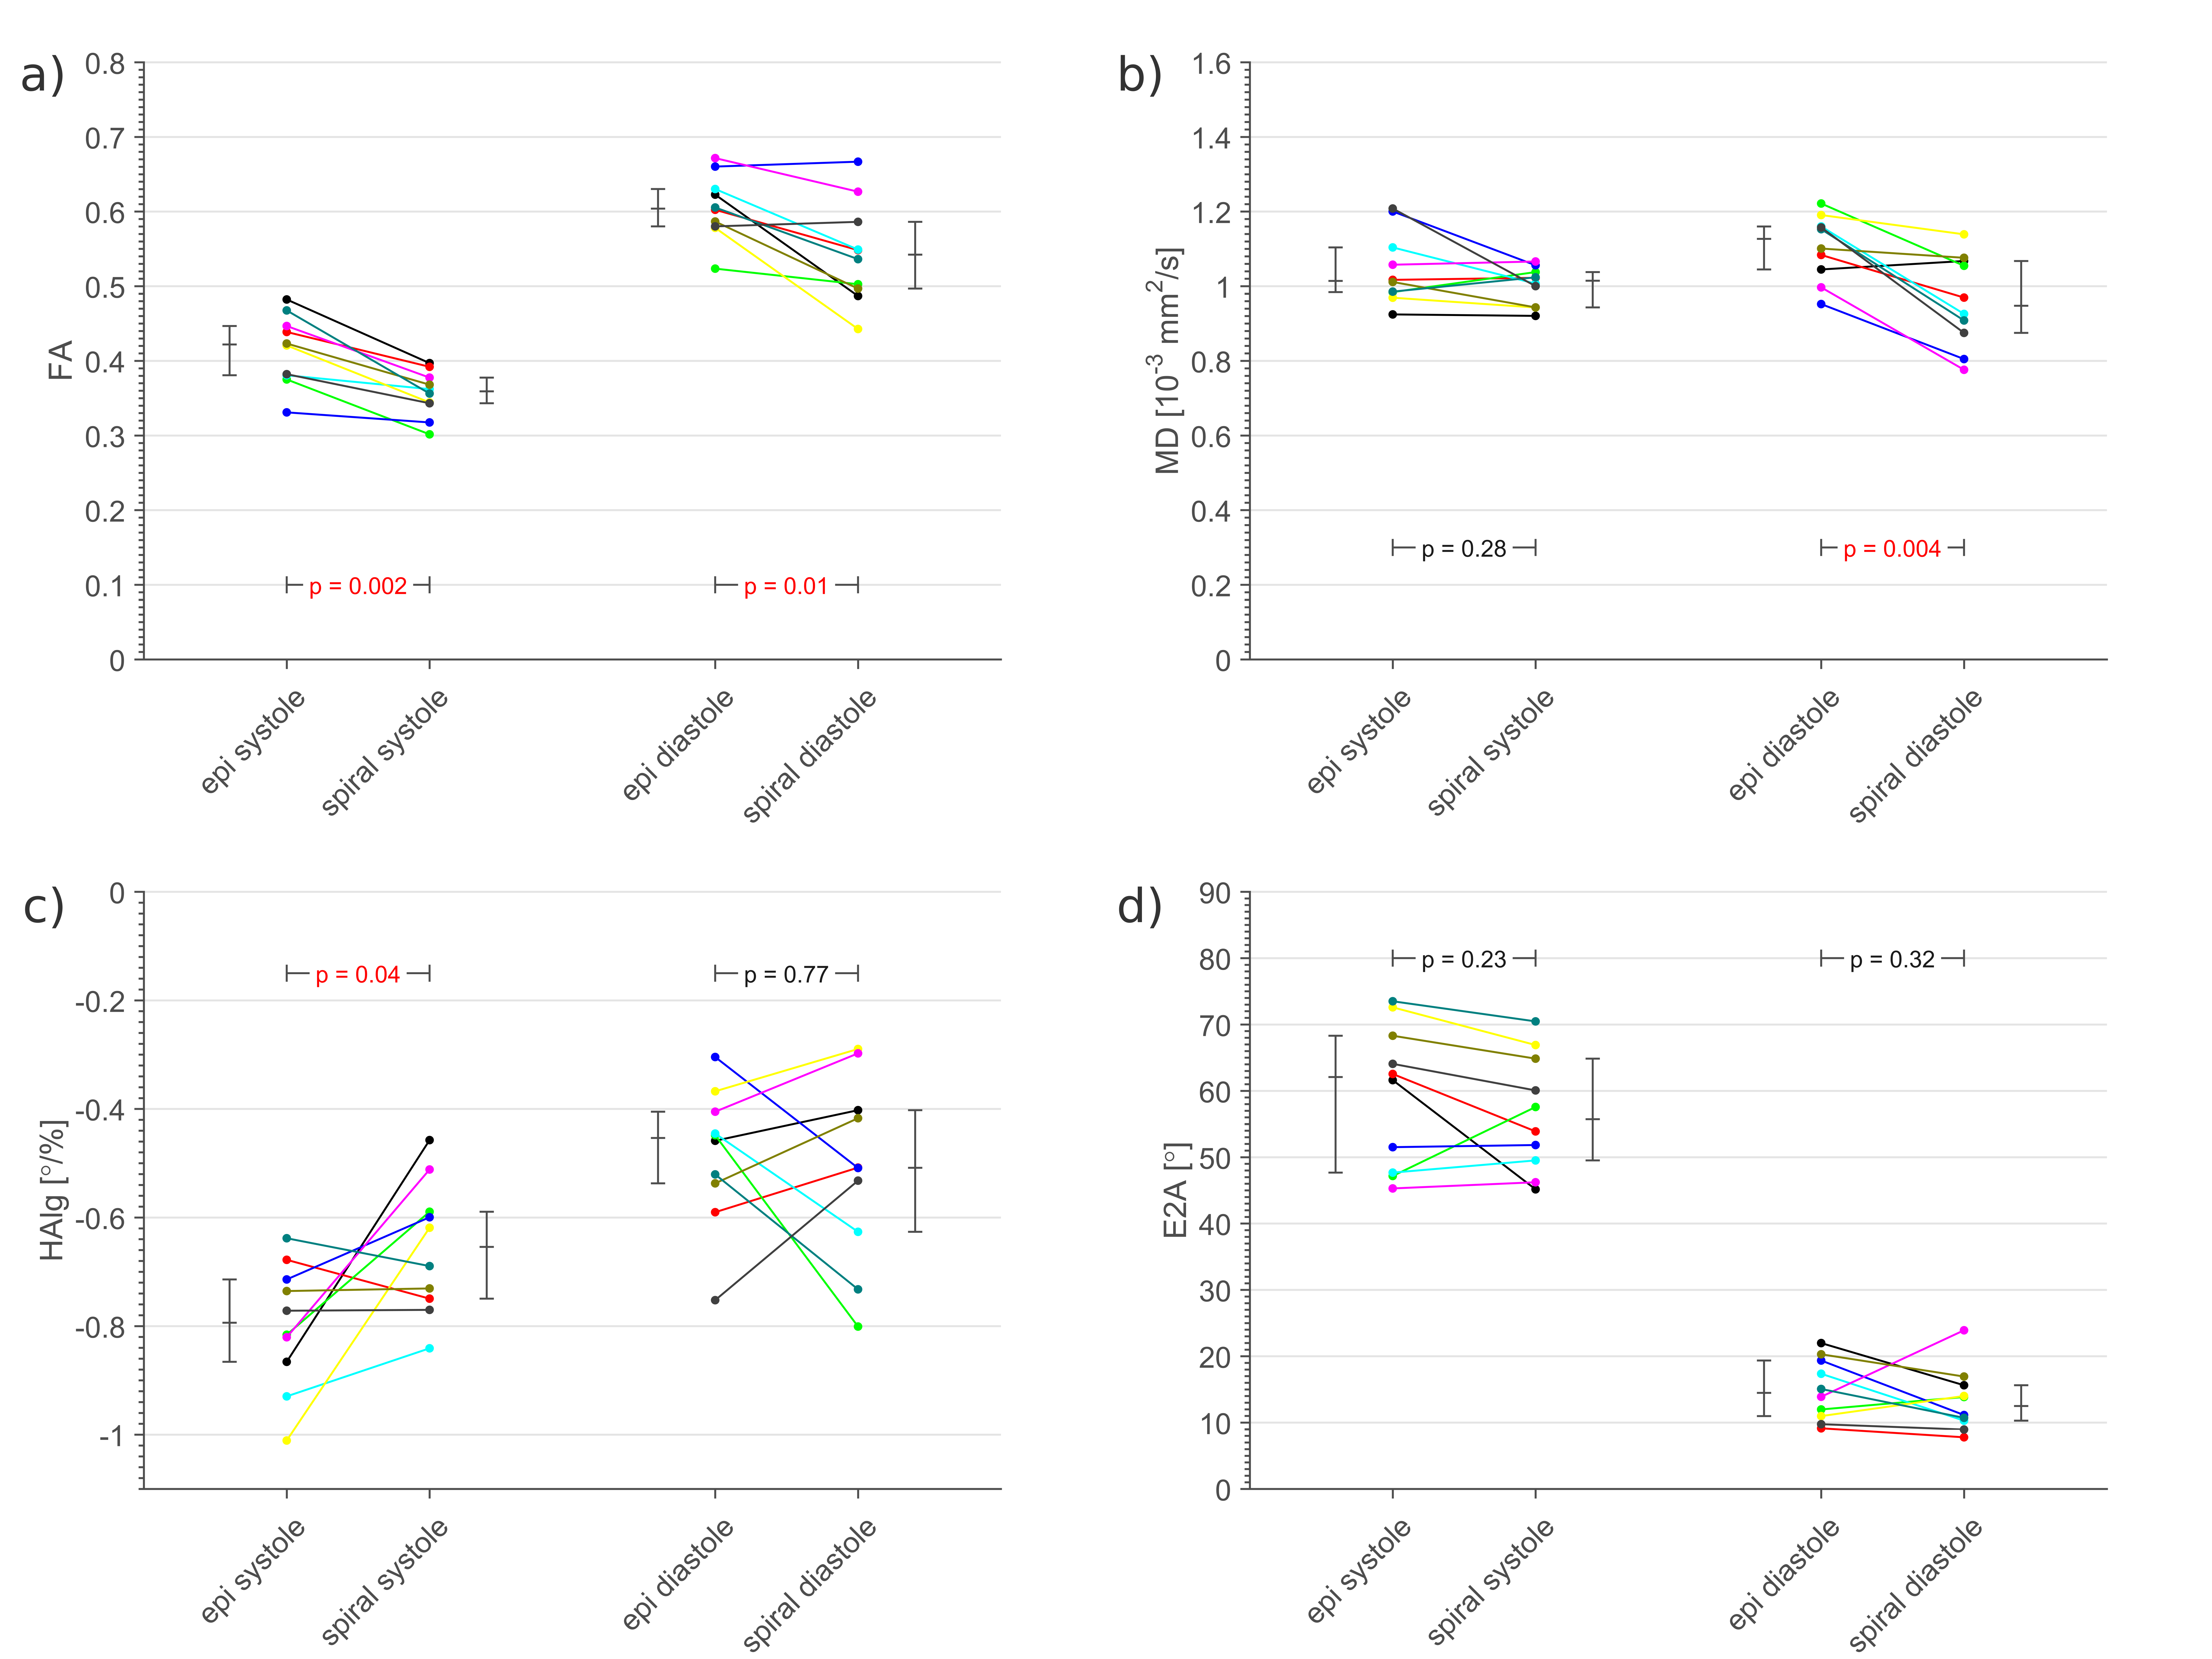
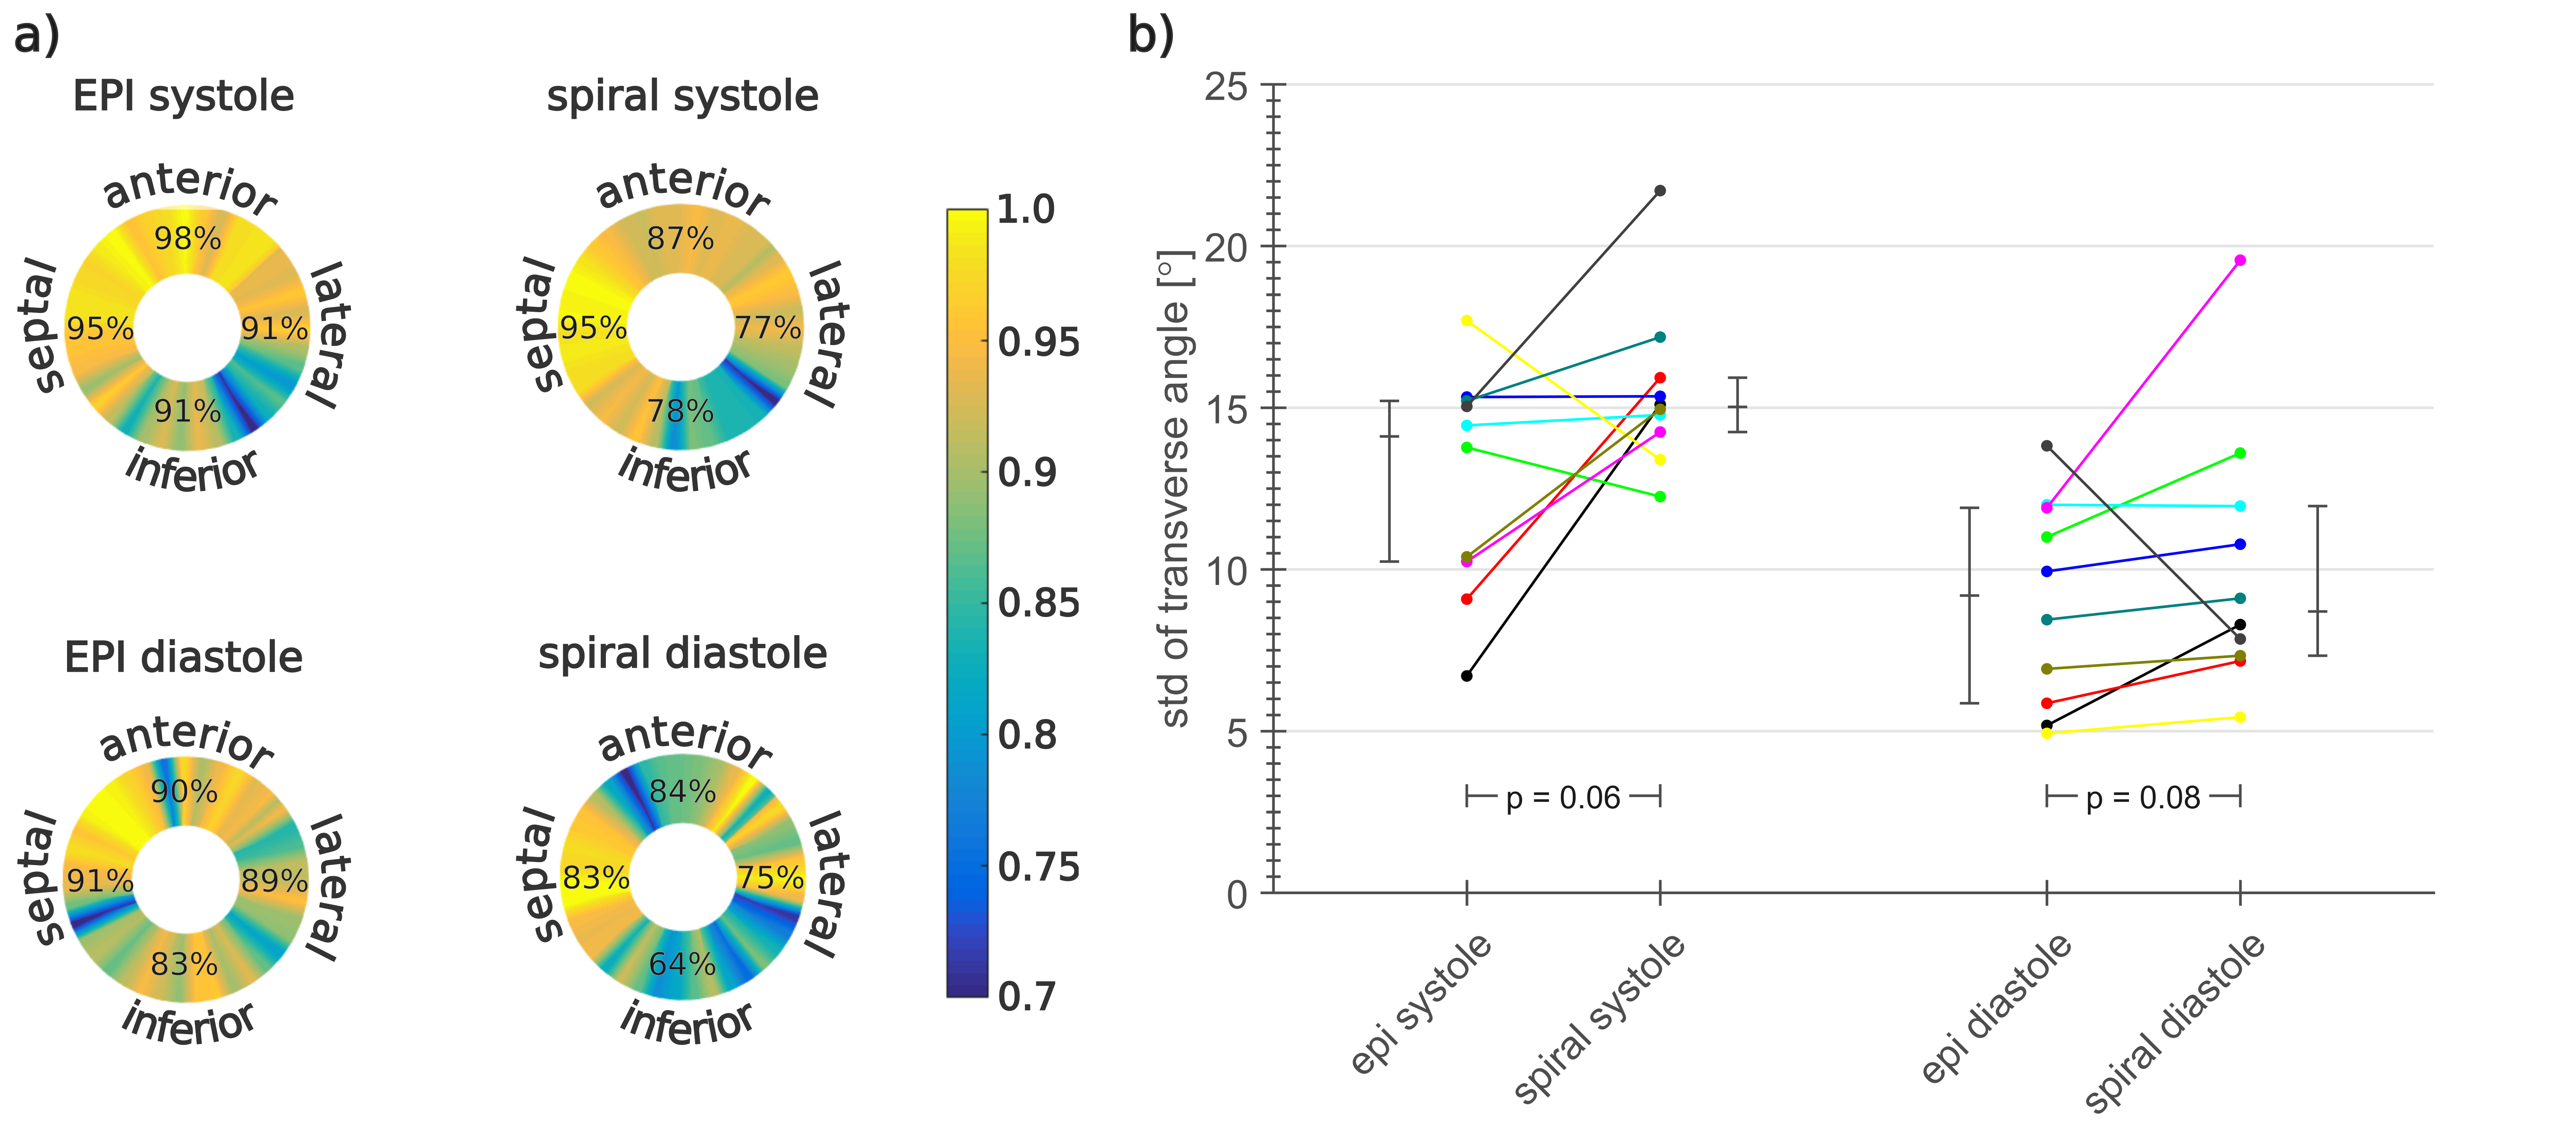
EPI and spiral cDTI results were compared subject-wise in systole and diastole for fractional anisotropy (FA), mean diffusivity (MD), secondary eigenvector angulation (E2A) and transmural helical angle line gradient (HAlg). Both mean left-ventricular and region-wise comparisons (4 regions of 90°) of the data quality were performed. HA line profiles (HAlp) are known to vary linearly and to have a negative slope. A linear fit was performed for a HA comparison. The goodness of the fit was used to indicate the quality of the data. Low R2 values and a positive slope are indices for artifacts7-9.
Results
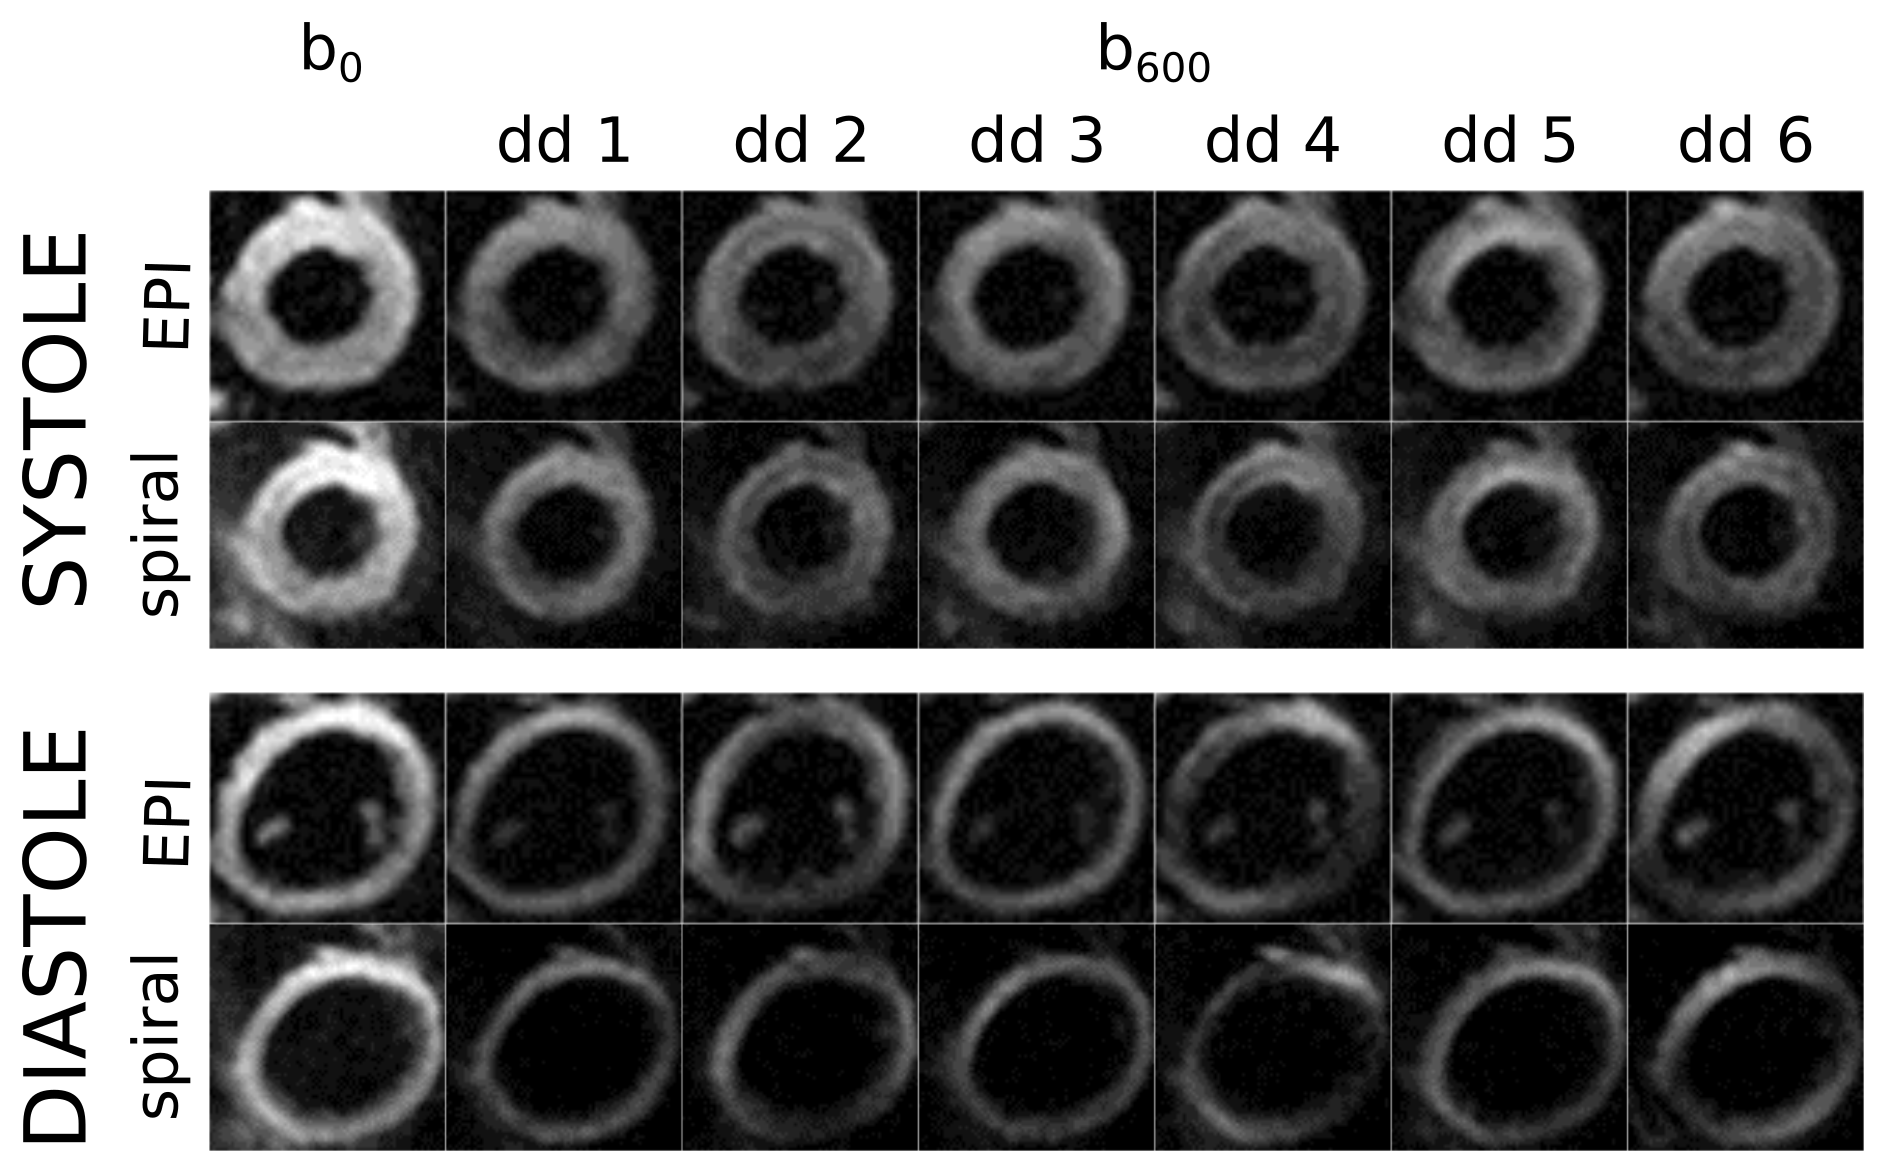
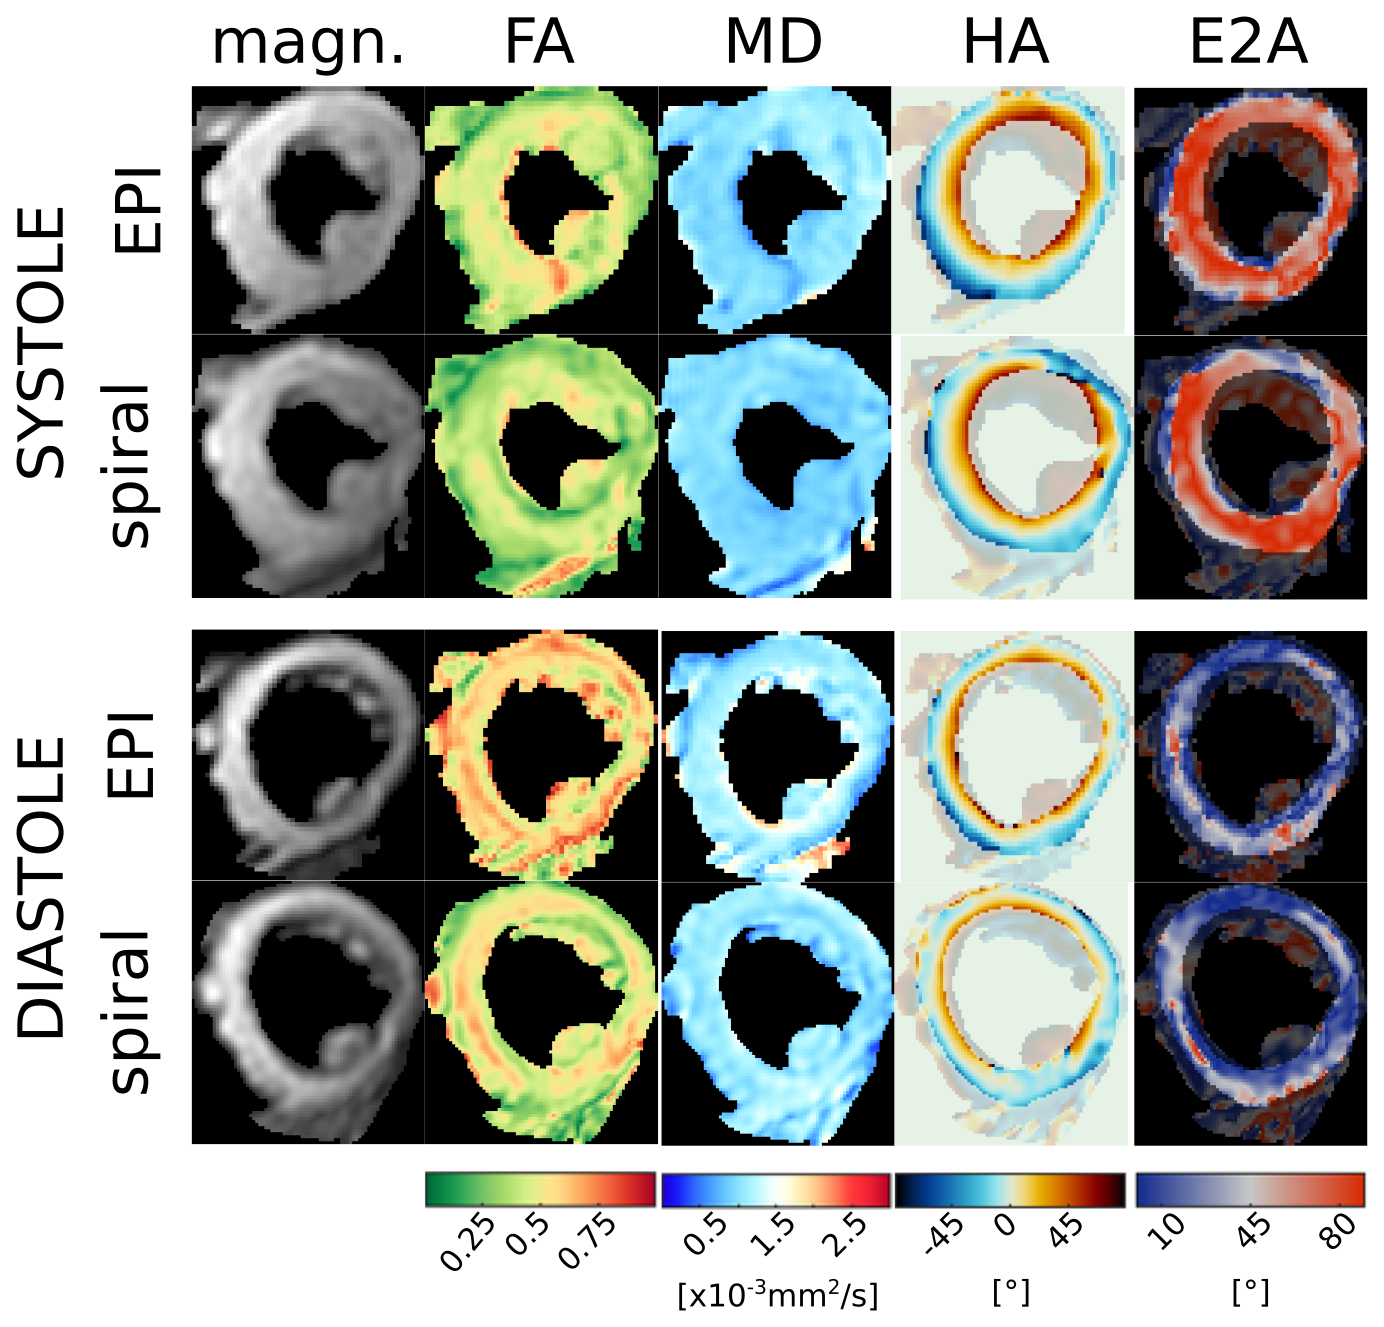
Example raw images and cDTI parameter maps are shown in figures 2 and 3 and the comparison plots are shown in figure 4. Systolic E2A and MD, as well as diastolic HAlg showed no significant differences between sequences, p>0.2. There were significant differences in diastolic FA and systolic HAlg (p≤0.04) and in diastolic MD and systolic FA (p<0.01).
The SNR was increased from SNR600=80±18 and SNR150=142±32 in EPI to SNR600=95±18 and SNR150=163±30 in spiral for b=600s/mm2 and b=150s/mm2 respectively.
The standard deviation of the transverse angles was lower, although not significantly (p≥0.06) for EPI trajectories. The inferior wall demonstrated the worst data quality in HAlp analysis for both sequences however this effect was stronger in the spiral, see data quality analysis in figure 5. This is caused by more severe off-resonance artifacts for the spiral readout than for the EPI.
Discussion
Calculating the diffusion tensor requires ≥7 images with sufficient SNR, which is hampered by the use of stimulated echoes and alternate cycle triggering in STEAM cDTI. In this work for the same acquisition time the SNR was increased (15-19%) by using a spiral readout. Systolic FA and MD, as well as diastolic HAlg obtained using STEAM EPI were similar to those obtained using STEAM spiral (p=NS). Other parameters were similar to within ~20% or better and all parameters obtained using spiral readouts were within the range reported in the literature for in-vivo STEAM cDTI7,9,11,12.Conclusion
In this initial comparison SNR is improved by replacing the EPI readout with a spiral in a STEAM cDTI acquisition. Although the DTI parameters were largely similar between spiral and EPI readouts, off-resonance artifacts were more severe in spirals. These artefacts may be corrected in a post-processing step or by using shorter spirals. To address this issue, future work will focus on implementing a segmented acquisition and parallel imaging with variable density spirals. Higher spatial resolution may provide insights into cardiac microstructure in patient groups with a thin myocardial wall.Acknowledgements
No acknowledgement found.References
1. Wu M-T, Su M-YM, Huang Y-L, Chiou K-R, Yang P, Pan H-B, et al. Sequential changes of myocardial microstructure in patients postmyocardial infarction by diffusion-tensor cardiac MR correlation with left ventricular structure and function. Circulation: Cardiovascular Imaging. 2009;2(1):32-40.
2. Nguyen C, Lu M, Fan Z, Bi X, Kellman P, Zhao S, et al. Contrast-free detection of myocardial fibrosis in hypertrophic cardiomyopathy patients with diffusion-weighted cardiovascular magnetic resonance. Journal of Cardiovascular Magnetic Resonance. 2015;17(1):1.
3. Zhong X, Spottiswoode BS, Meyer CH, Kramer CM, Epstein FH. Imaging three-dimensional myocardial mechanics using navigator-gated volumetric spiral cine DENSE MRI. Magnetic resonance in medicine. 2010;64(4):1089-97.
4. Scott AD, Ferreira P, Nielles-Vallespin S, Pierce I, McGill L-A, Pennell D, et al., editors. In Vivo Cardiac Diffusion Tensor Imaging Using a Spiral Trajectory. International Society for Magnetic Resonance in Medicine Annual Meeting; 2014; Milan, Italy.
5. Reeder SB, Wintersperger BJ, Dietrich O, Lanz T, Greiser A, Reiser MF, et al. Practical approaches to the evaluation of signal-to-noise ratio performance with parallel imaging: Application with cardiac imaging and a 32-channel cardiac coil. Magnetic Resonance in Medicine. 2005;54(3):748-54.
6. Nielles-Vallespin S, Mekkaoui C, Gatehouse P, Reese TG, Keegan J, Ferreira PF, et al. In vivo diffusion tensor MRI of the human heart: Reproducibility of breath-hold and navigator-based approaches. Magnetic resonance in medicine. 2013;70(2):454-65.
7. Stoeck CT, Kalinowska A, von Deuster C, Harmer J, Chan RW, Niemann M, et al. Dual-phase cardiac diffusion tensor imaging with strain correction. PLoS One. 2014;9(9):e107159.
8. Jiang Y, Pandya K, Smithies O, Hsu EW. Three-dimensional diffusion tensor microscopy of fixed mouse hearts. Magnetic resonance in medicine. 2004;52(3):453-60.
9. Ferreira PF, Kilner PJ, McGill L-A, Nielles-Vallespin S, Scott AD, Ho SY, et al. In vivo cardiovascular magnetic resonance diffusion tensor imaging shows evidence of abnormal myocardial laminar orientations and mobility in hypertrophic cardiomyopathy. Journal of Cardiovascular Magnetic Resonance. 2014;16(1):1.
10. Von Deuster C, Stoeck CT, Genet M, Atkinson D, Kozerke S. Spin echo versus stimulated echo diffusion tensor imaging of the in vivo human heart. Magnetic resonance in medicine. 2015.
11. Tunnicliffe EM, Scott AD, Ferreira P, Ariga R, McGill L-A, Nielles-Vallespin S, et al. Intercentre reproducibility of cardiac apparent diffusion coefficient and fractional anisotropy in healthy volunteers. Journal of Cardiovascular Magnetic Resonance. 2014;16(1):1.
12. Scott AD, Ferreira PF, Nielles-Vallespin S, Gatehouse P, McGill LA, Kilner P, et al. Optimal diffusion weighting for in vivo cardiac diffusion tensor imaging. Magnetic resonance in medicine. 2015;74(2):420-30.
Figures