3108
Accelerating High-Resolution Whole-Heart 3D T2 Mapping1Department of Biomedical Engineering, Johns Hopkins University School of Medicine, Baltimore, MD, United States, 2Department of Biomedical Engineering, Tsinghua University, Beijing, People's Republic of China, 3Department of Medicine, Johns Hopkins University School of Medicine, Baltimore, MD, United States
Synopsis
In this work, we aim to determine an optimal strategy for accelerating high-resolution 3D myocardial T2 mapping. We quantitatively evaluate the performance of diverse methods involving different subsampling patterns and different reconstruction strategies relative to volume-by-volume SENSE reconstruction. Reconstructions which address all volumes as a single reconstruction problem (i.e. joint-sparsity SENSE or model-based SENSE) outperform volume-by-volume approaches, and variable density sampling outperforms equal spacing or CAIPIRIHNA undersampling. The T2 values observed in parametric maps proved to be more sensitive to data corruption than images themselves, limiting the degree of data reduction tolerable.
Introduction
For myocardial T2 mapping, multiple image volumes with varying amounts of T2-weighting are acquired. Parametric maps are produced at the expense of increases in scan duration based on how many additional volumes are acquired. To reduce scan time, parallel imaging with aggressive undersampling can be applied. The significant structural similarity between image volumes(albeit with changes in contrast), could be exploited to improve the quality of both images and parametric maps. Hence, this work aims to determine an optimal strategy for accelerating multi-volume high-resolution whole-heart 3D T2 mapping by examining multiple combinations of undersampling patterns and parallel imaging strategies.Methods
Image acquisition: Fully-sampled data was acquired at 3T with a respiratory navigator-gated free-breathing 3D T2 mapping method based on saturation and T2 preparation1 (T2-Prep) using a 32-channel cardiac array2. For N=8 normal subjects and N=3 naïve swine, 4 image volumes were acquired with T2-Prep TE$$$\in$$${0,25,35,45}ms. For one additional swine with acute myocardial infarction (MI) displaying significant edema (elevated T2), 3 volumes were acquired with T2-Prep TE$$$\in$$${0,25,45}ms. Image resolution was 1.25x1.25x5.0 mm3 for all scans.
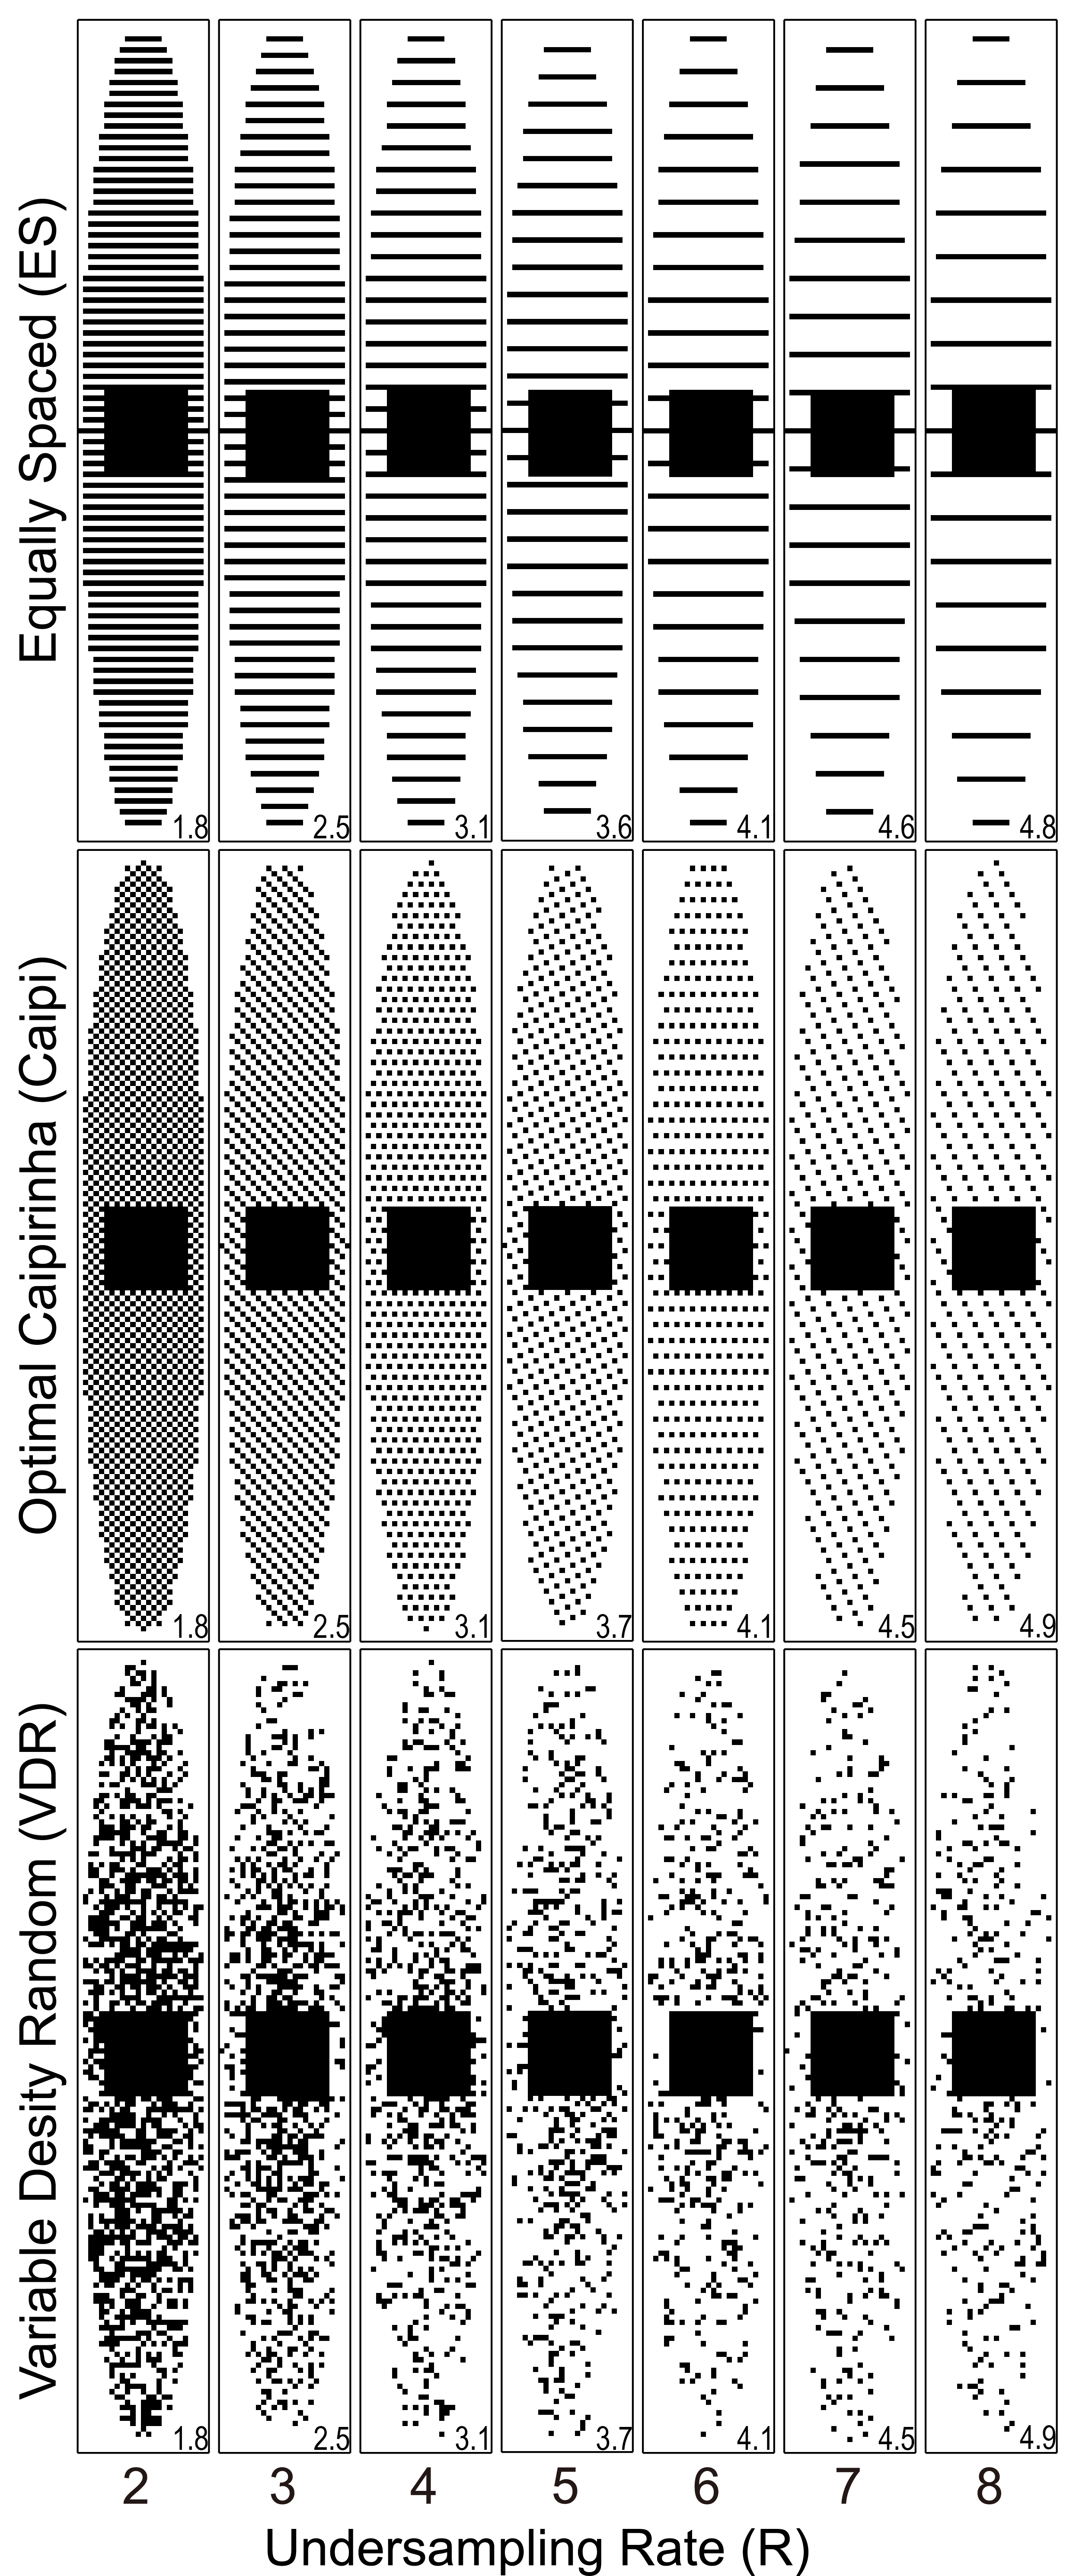
Image reconstruction methods: We compared the performance of traditional SENSE3 in which each volume is subsampled and reconstructed independently to: 1) standard SENSE which reconstructs all volumes jointly, 2) joint-sparsity SENSE (JS-SENSE) which uses a sparsity transform to exploit the structural similarities4, and 3) model-based SENSE (MB-SENSE) which drives optimization with an exponential decay model5. For standard SENSE, JS-SENSE and MB-SENSE, data was retrospectively undersampled using optimal CAIPIRINHA6 and variable density random(VDR) sampling7. Images were reconstructed with no under-sampling,and with acceleration rate R$$$\in$$${2,3,4,5,6,7,8}.
reconstruction steps: Homodyne detection was applied to correct for partial echo sampling. Multi-channel images were combined by root-sum-squares. Sensitivity maps were computed using the fully sampled center of k-space. To better estimate the performance of random sampling paterns, 6 different random samplings with the same distribution were tested each dataset and the results were averaged (Fig. 1).
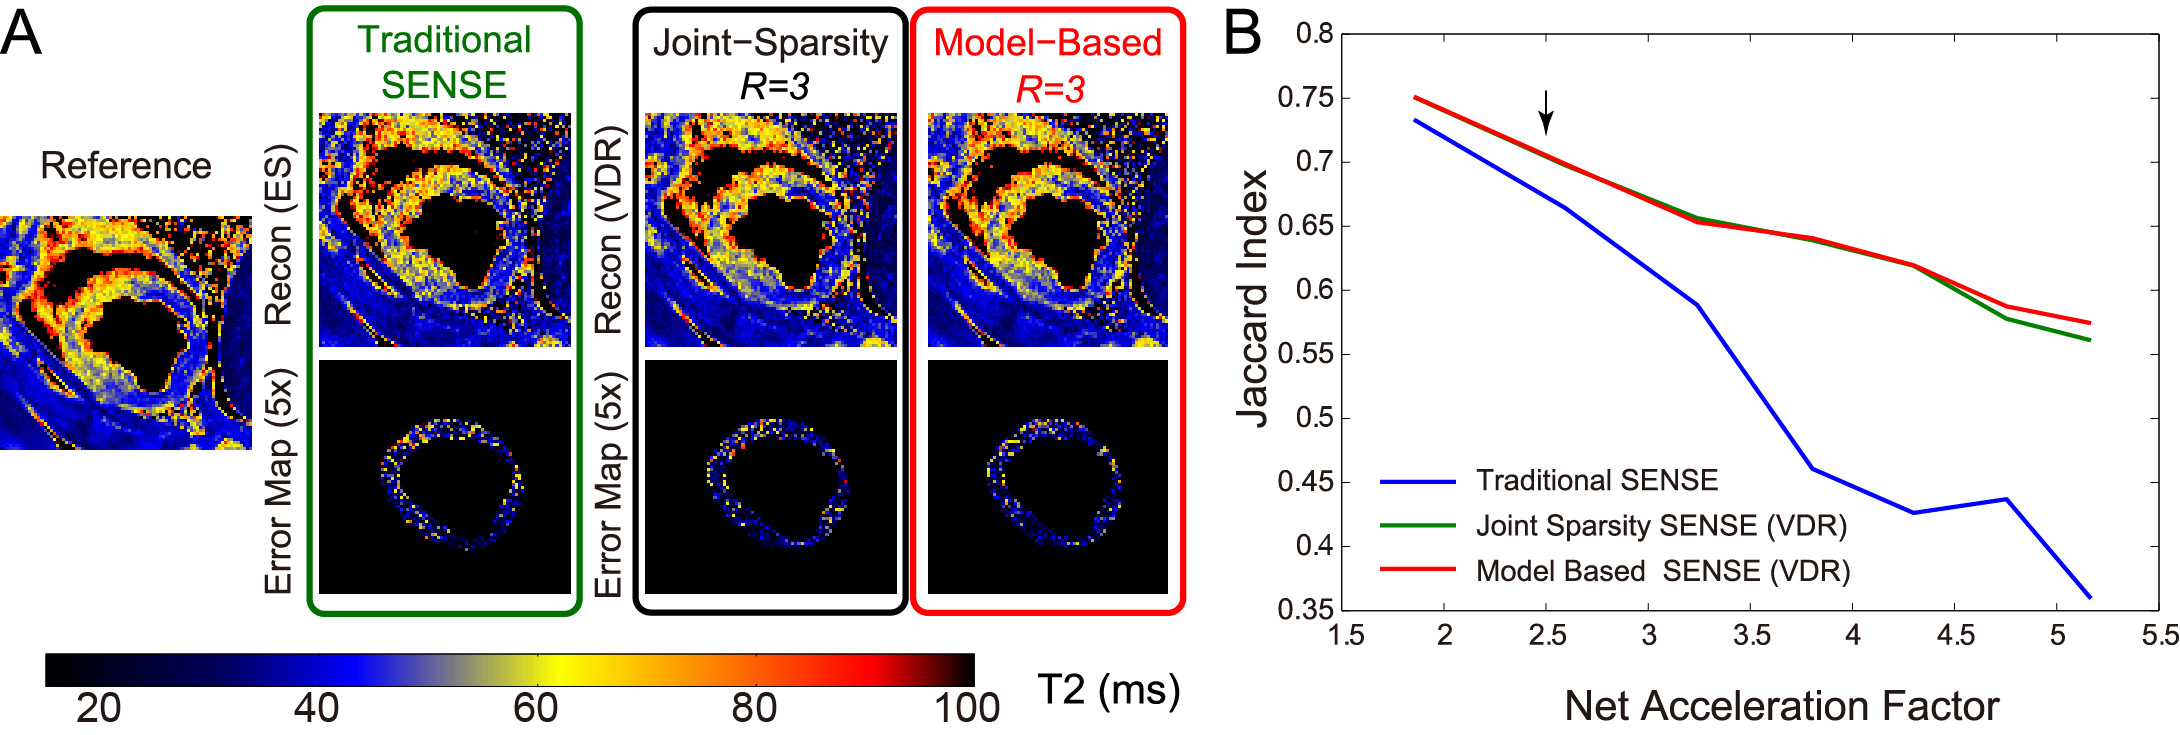
Image analysis: T2 was determined by linear regression of the log-transformed data. A 3D ROI was drawn manually and included the left ventricular myocardium (LV)spanning the whole heart. Four metrics were used to compare the performance of each reconstruction scheme on pixel in the ROI: 1) root mean square error (RMSE) of image intensity, 2) RMSE of T2, 3) bias of the mean T2, and 4) standard deviation (SD) of T2. For the swine with acute MI, the T2 values of normal cardiac tissue were assumed Gaussian-distributed1. A second Gaussian distribution (edematous tissue, with elevated T2) was fit and a threshold was chosen based on the optimal separation of the two distributions. The threshold was used to calculate the Jaccard index between the reference and the reconstructed images, with higher index values indicating data more consistent with reference data.
Results
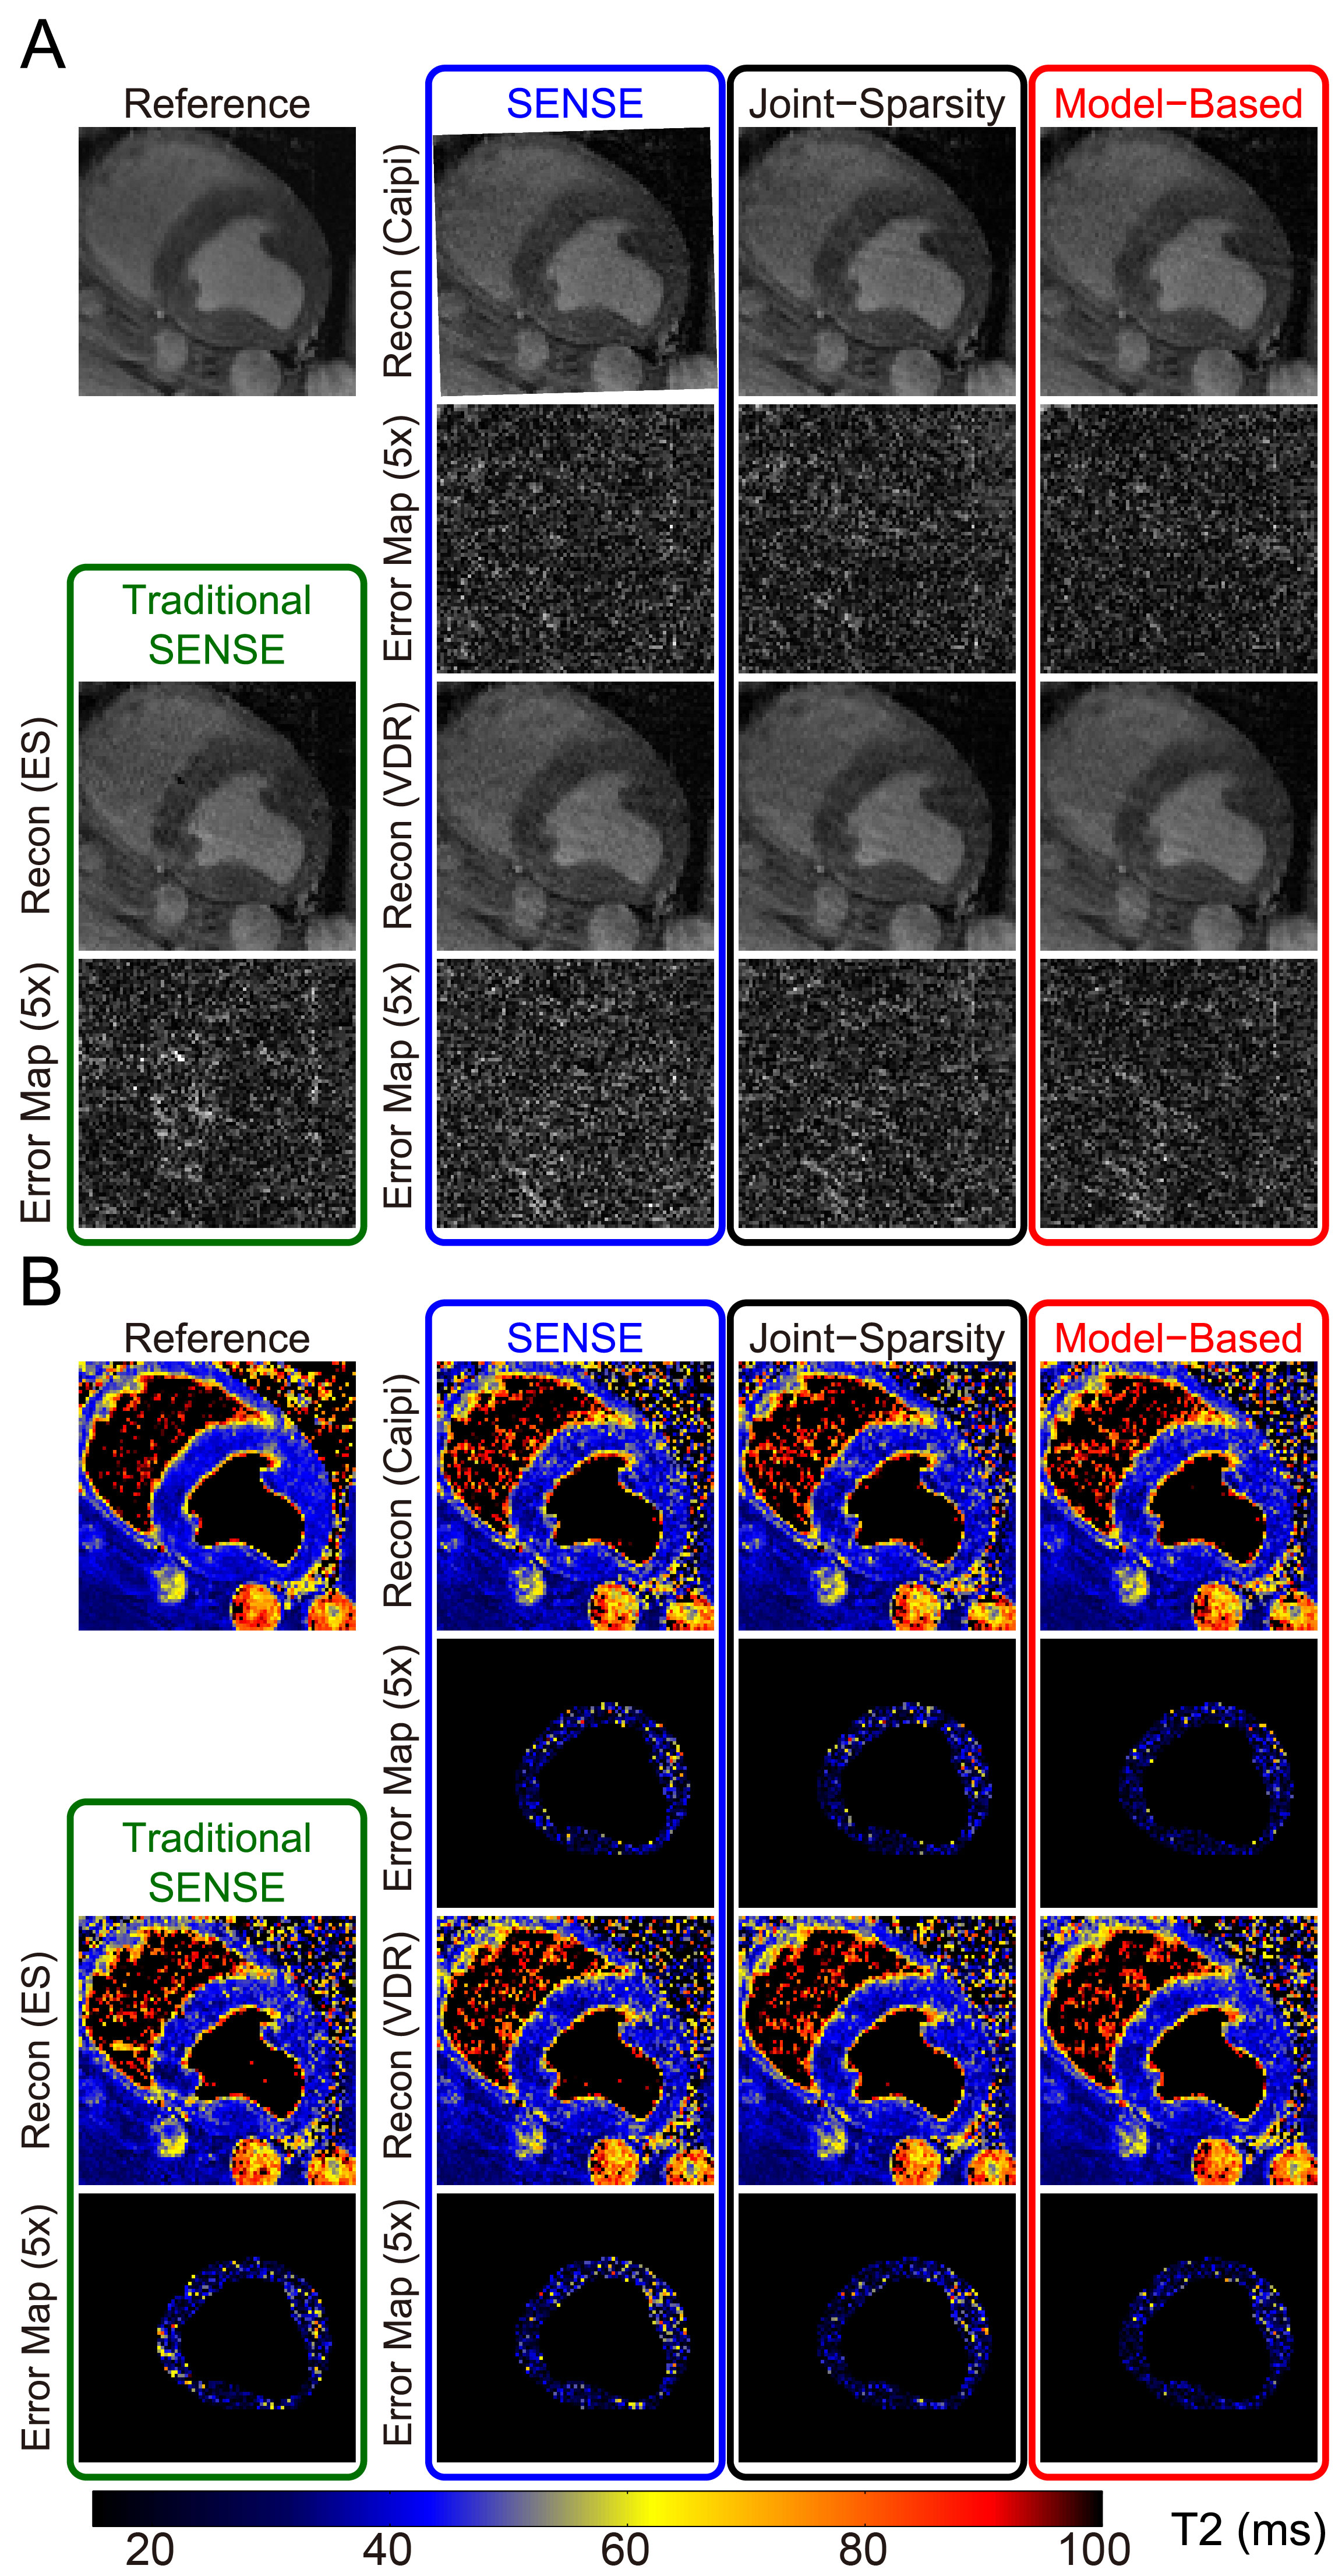
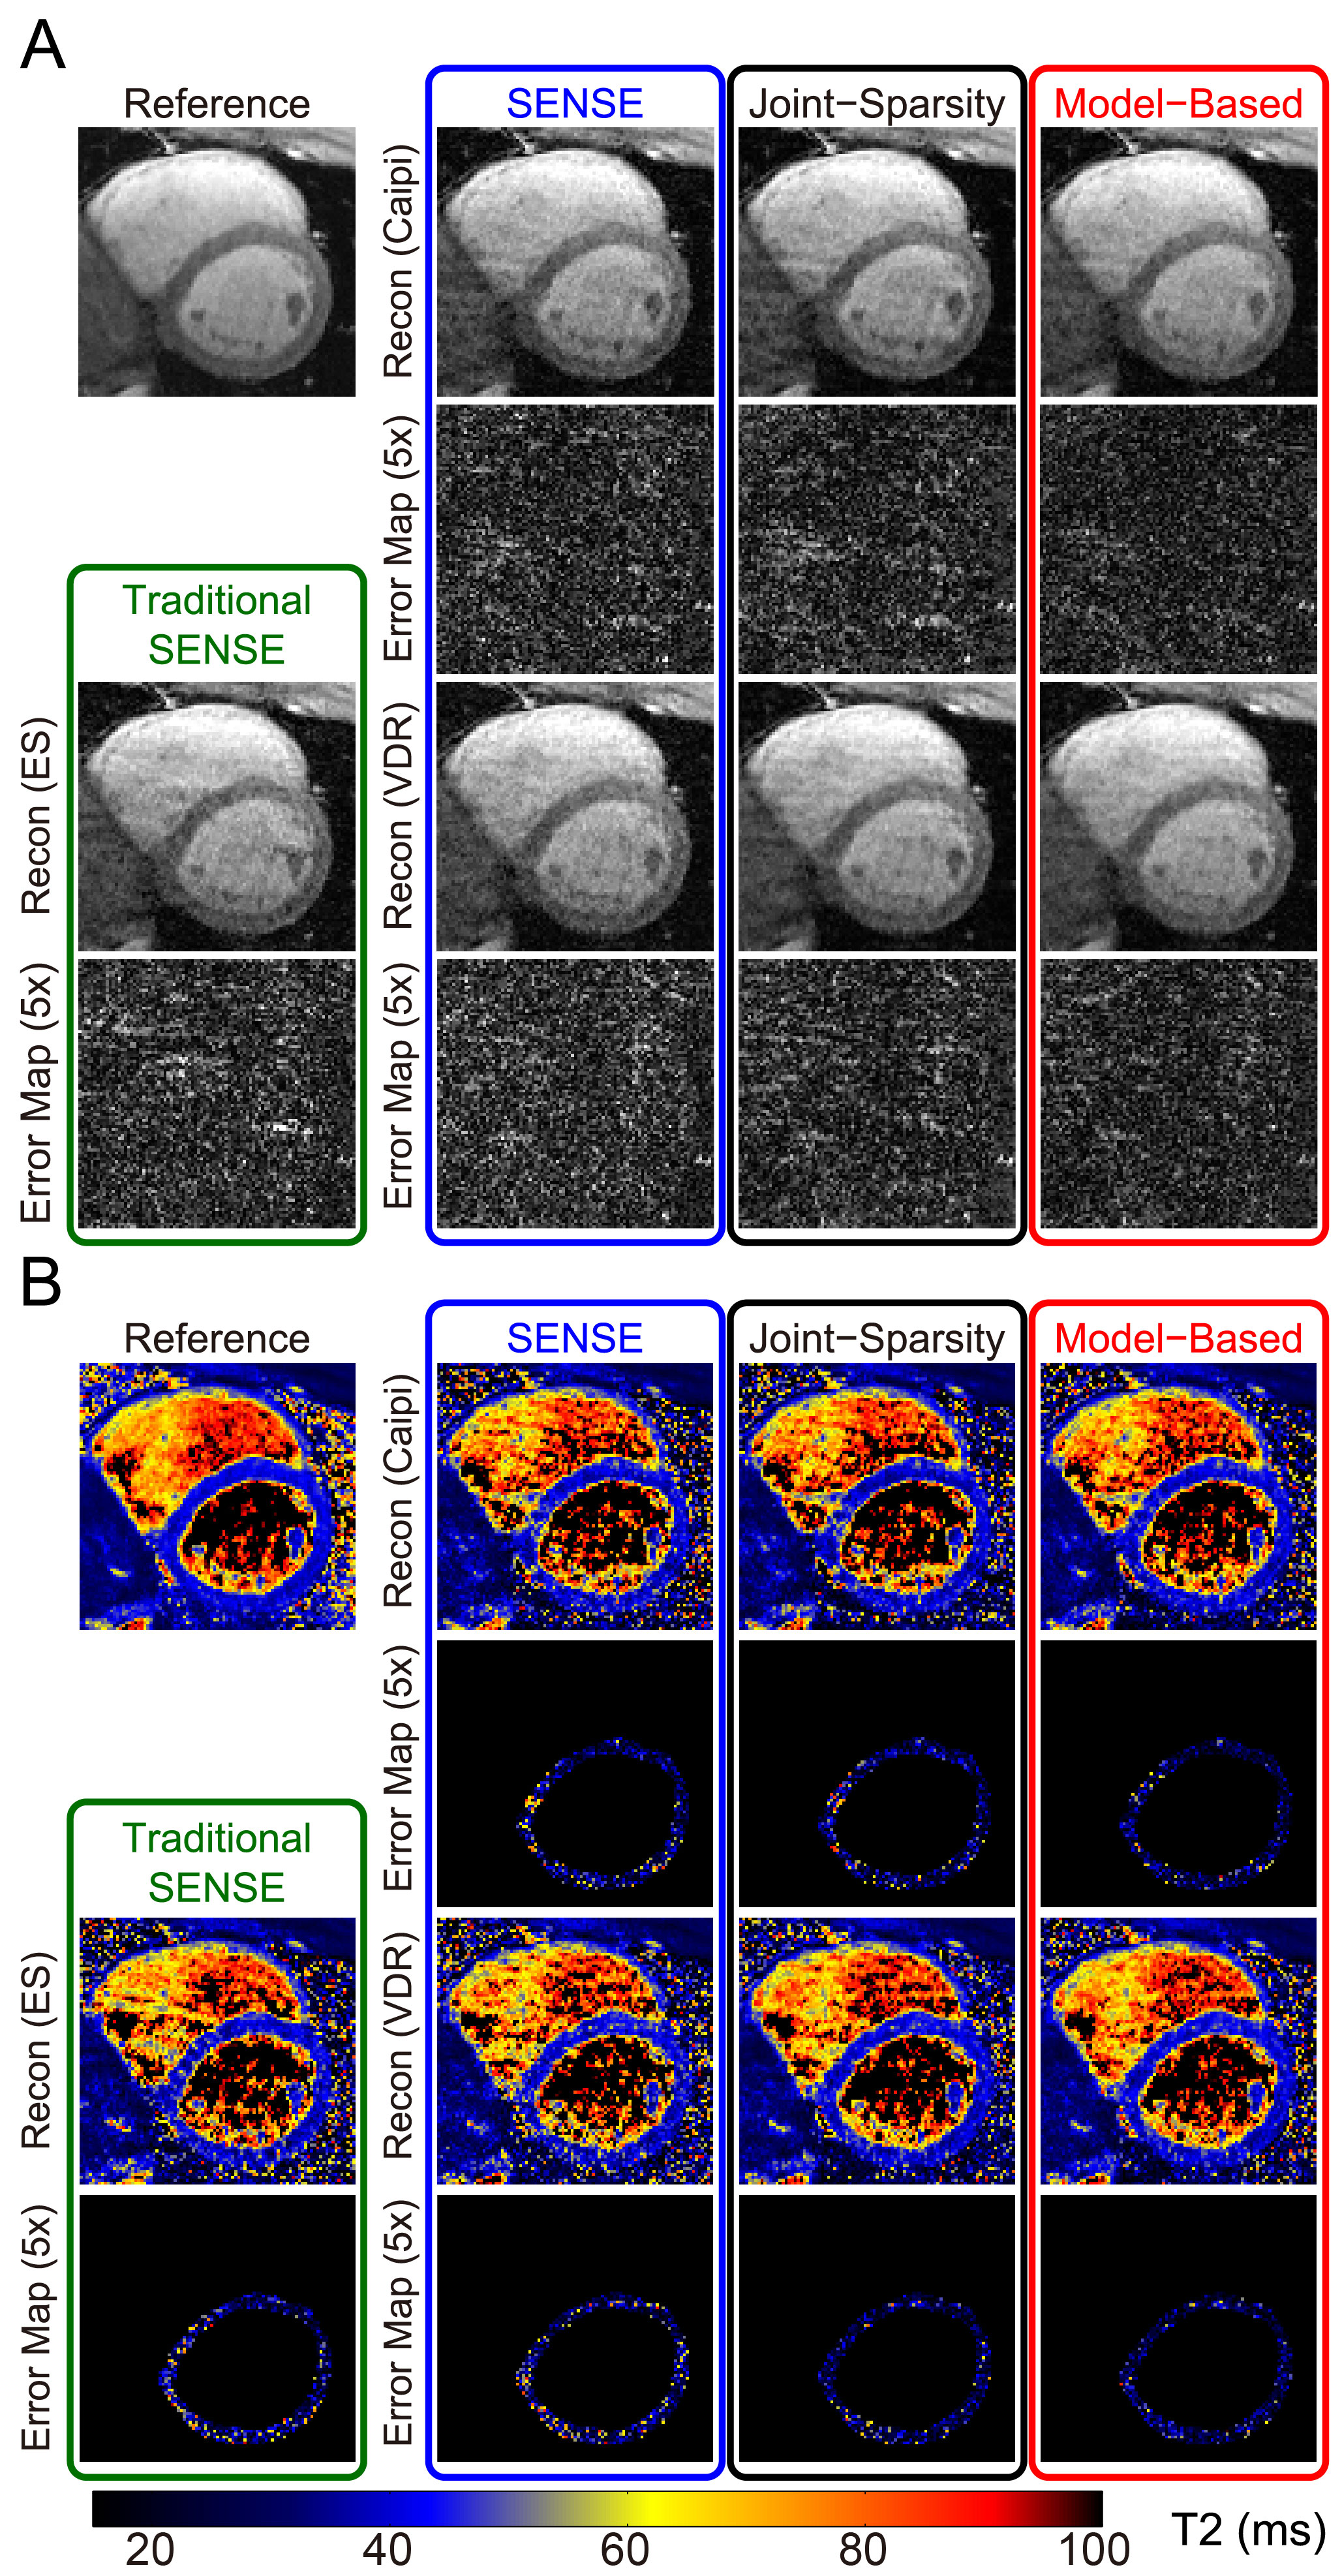
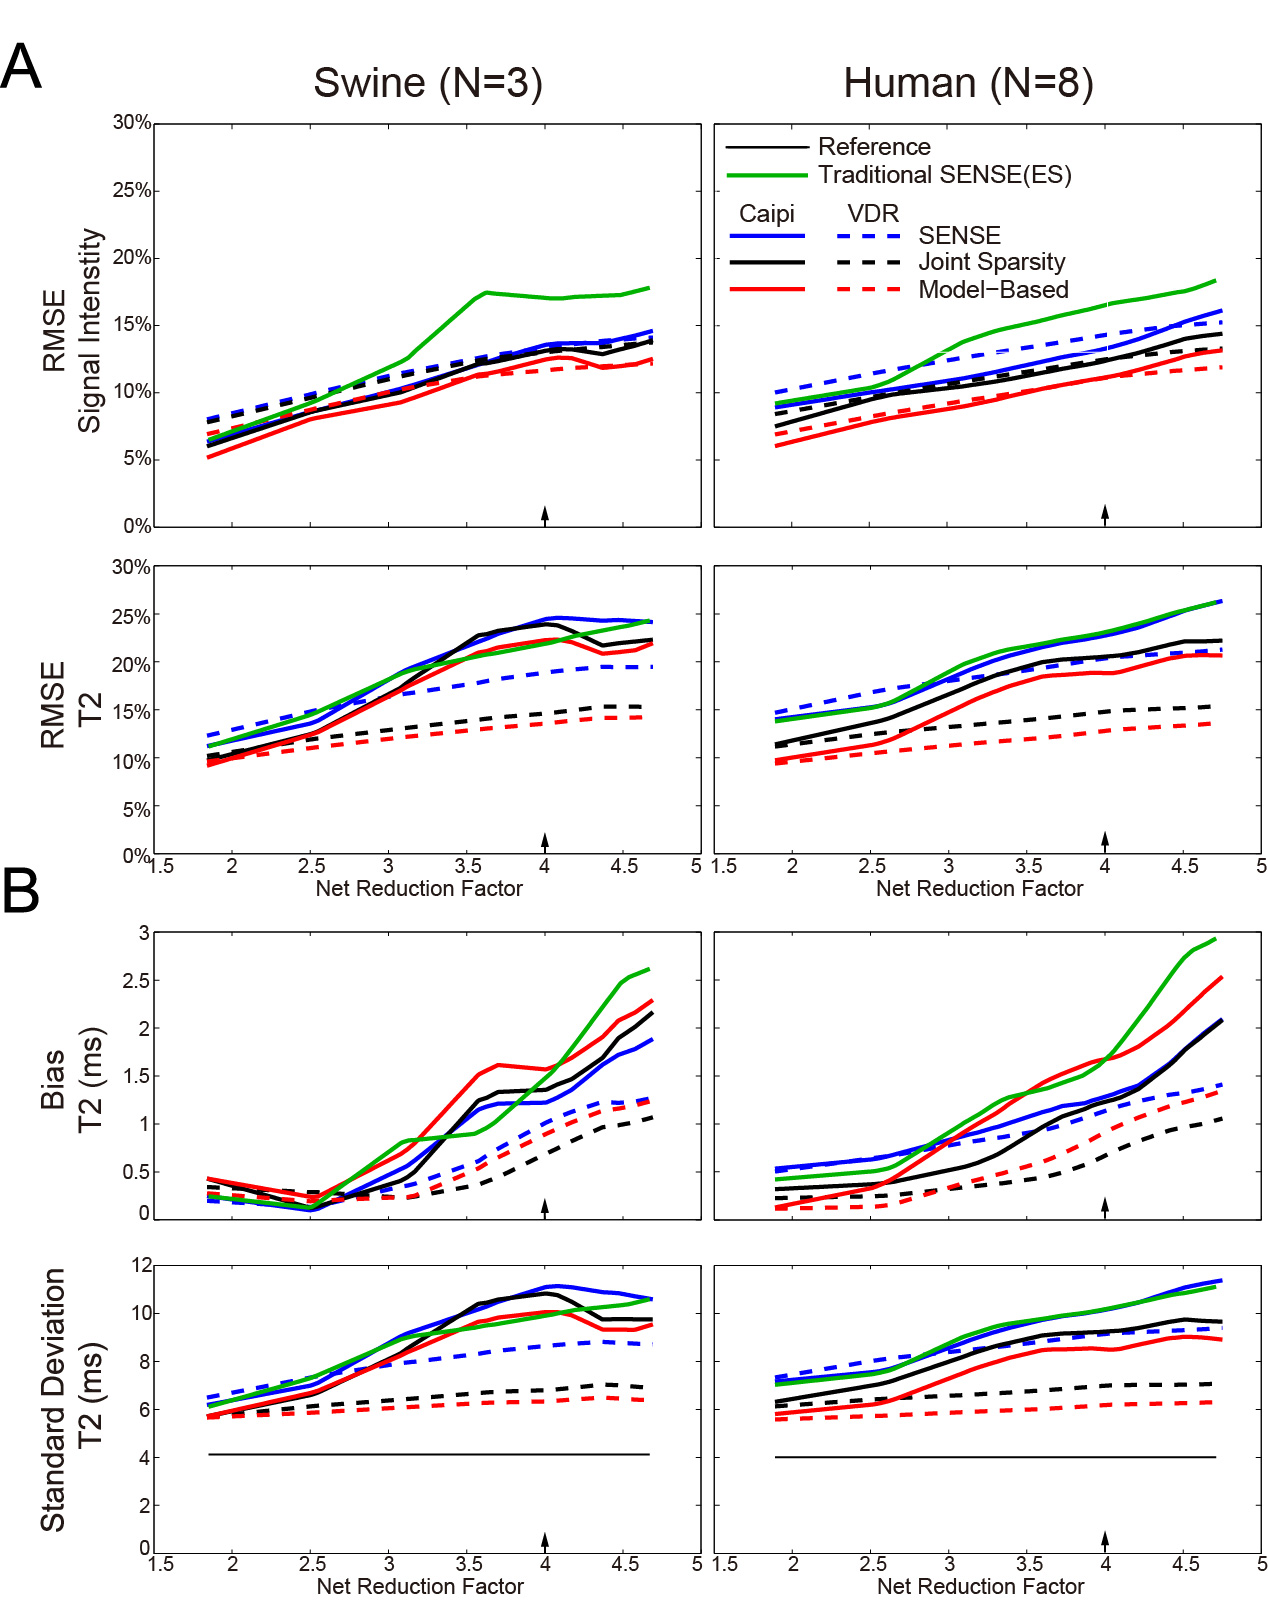
Figures 2 and 3 show representative images and T2 maps from swine and a normal subject obtained with different reconstruction strategies using an acceleration rate R=3. Figure 4 demonstrates the changes in performance metrics vs. net reduction factor for both swine and human. Figure 5A demonstrates a subset of T2 maps from the swine with acute MI and Figure 5B shows the Jaccard index vs. net reduction factor for the same animal.Discussion
Similar trends in performance metrics were observed for both human and swine data. T2 maps were generally more sensitive to distortion due to parallel imaging than source images themselves as shown by the lager RMSEs observed for T2 vs. those observed for images at any R. For both naïve swine and normal subjects, VDR sampling with JS-SENSE or MB-SENSE outperformed other methods at higher acceleration. Using data from swine with acute MI, we demonstrate that VDR sampling with JS-SENSE or MB-SENSE had a higher Jaccard index compared to equally spaced undersampling with traditional SENSE reconstruction. The incorporation multiple volumes into a single reconstruction results in reduced changes to the segmentation of myocardial tissues (i.e. edematous myocardium), one of the endpoints of cardiac tissue characterization with parametric mapping.Conclusion
This work suggests that: 1) parametric maps (of T2) may be more susceptible to distortions introduced by parallel imaging than the image data on which they are based, suggesting more stringent limits on undersampling factors when mapping, and 2) strategies that simultaneously reconstruct all undersampled volumes in a single process produce can produce lower errors and reduced bias when measuring T2. Since parallel imaging is a mainstay of cardiac tissue characterization with mapping8, additional attention should be given to its effects on the final parametric maps.Acknowledgements
No acknowledgement found.References
[1] Brittain J.H. et. al. Coronary angiography with magnetization-prepared T2 contrast. Magn Reson Med. 1995;33(5):689-696.
[2] Ding H. et. al. Three-dimensional whole-heart T2 mapping at 3T. Magn Reson Med.2015;74(3):803-816.
[3] Pruessmann K. P. et. al. SENSE: sensitivity encoding for fast MRI. Magn Reson Med. 1999;42(5):952-962.
[4] Majumdar A. and Rabab K. W. Accelerating multi-echo T2 weighted MR imaging: analysis prior group-sparse optimization. J Magn Reson. 2011;210(1):90-97.
[5] Samsonov A. Accelerated MR Parameter Mapping Using Robust Model-Consistency Reconstruction. Proc. Intl. Soc. Mag. Reson. Med. 2015(23):3711.
[6] Tsao J. et. al. Optimizing spatiotemporal sampling for k-t BLAST and k-t SENSE: Application to high-resolution real-time cardiac steady-state free precession. Magn Reson Med. 2005;53(6):1372-1382.
[7] Lustig M., David D. and John M. P. Sparse MRI: The application of compressed sensing for rapid MR imaging. Magn Reson Med. 2007;58(6):1182-1195.
[8]Messroghli D.R. et. al. Modified Look-Locker inversion recovery (MOLLI) for high-resolution T1 mapping of the heart. Magn Reson Med. 2004;52(1):141-146
Figures