3107
Whole-heart T1 mapping using a 2D fat image navigator with 100% scan efficiencyGiovanna Nordio1, Gastao Cruz1, Claudia Prieto1, Torben Schneider1,2, Rene M. Botnar1, and Markus Henningsson1
1Division of Imaging Sciences and Biomedical Engineering, King’s College London, London, United Kingdom, London, United Kingdom, 2Philips Healthcare, Guildford Surrey, United Kingdom
Synopsis
In this study a whole-heart saturation-recovery T1-mapping technique in combination with a fat image navigator (fat-iNAV) is proposed. Myocardial fat is imaged by the fat-iNAV to estimate respiratory motion. Each of the T1-weighted images are subsequently motion corrected prior to reconstruction of the T1 map. Fat-iNAV motion correction let to an improvement in myocardial borders delineation and accuracy of the myocardial T1 values, while there was a general underestimation of myocardial T1 in the non-motion corrected T1 maps (1115.4±110ms vs 998.6±101ms). Further work will investigate non-rigid motion correction and undersampled reconstruction for T1 mapping.
Introduction
Free-breathing 3D quantitative myocardial T1 mapping allows for volumetric coverage of the heart and can benefit from higher signal-to-noise ratio (SNR) enabling higher spatial resolution than a 2D acquisition. Several techniques for 3D T1 mapping have been proposed using an inversion recovery pulse to generate T1 weighting.1,2 However these techniques are heart rate dependent and they use a respiratory gating approach, which prolongs the scan time. Due to the long scan time of 3D T1 mapping, avoiding the use of respiratory gating is desirable. Here we propose a high resolution 3D saturation recovery T1 mapping (3D SASHA)3 technique combined with a fat image navigator (fat-iNAV), which permits to acquire the whole heart during free breathing with 100% scan efficiency and with higher image resolution than achievable with 2D T1 mapping.Methods
A recently developed sampling strategy was used to allow a segmented k-space 3D SASHA acquisition.3 First the segments of the “infinity” image, without any magnetization preparation, were acquired, followed by interleaved segmented acquisitions with preceding saturation pulse and increasing saturation delays (Figure 1a). For motion estimation a 2D low-resolution image navigator using fat selective RF excitation (fat-iNAV) was acquired before each 3D SASHA k-space segment.4 The fat-iNAV was chosen as fat signal recovers faster than the water signal used for T1 mapping and consequently it is less affected by the extensive contrast differences between T1 weighted images with different saturation delays. Furthermore, the fat-iNAV does not perturb the water magnetization required for the high-resolution 3D SASHA sequence, avoiding any effect on T1 estimates. To compensate for the low SNR of the fat-iNAV with the shortest delay time, the position between the navigator and saturation pulse was swapped (Figure1b). Five healthy subjects were scanned on a 1.5T Philips Ingenia MR scanner. The acquisition parameters used for the 3D steady-state free precession (SSFP) SASHA imaging technique include: TR/TE=3.2/1.6; FA=35°; subject specific mid-diastolic trigger delay; image resolution=2x2x4mm3; FOV=300x300x90mm3 10 start-up echoes; low-to-high k-space ordering. The acquisition parameters of the image navigator were: gradient echo TFEPI acquisition; TFE factor=3; EPI factor=15; image resolution=3x3x40mm3; FA=30°; FOV=300x300x30mm3; SENSE with a factor of 2; binomial 1:2:1 RF fat-selective excitation; linear profile order. The fat-iNAV parameters were optimized for shortest scan time (46ms) in order to minimize the time delay between motion estimation and the 3D high resolution SASHA acquisition. 2D foot-head and right-left translational motion was estimated from the fat-iNAV, and used to align each k-space segment before reconstruction of the T1 weighted images in a beat-to-beat fashion (Figure 2). Subsequently a three parameter fitting model was used to reconstruct the T1 maps offline using customized software (MATLAB, R2014a, The MathWorks; Natick, USA).Results and Discussions
$$The total scan time was 11±0.9 minutes with 100% scan efficiency. The fat-iNAV allowed for estimation and correction of respiratory motion in each of the single T1-weighted images (Figure 3). After motion correction the myocardial borders were better delineated (Figure 3a, yellow arrows). The fat-iNAV was not affected by the contrast change between the different T1 weighted images (Figure 3b). The fat-iNAV used to estimate respiratory motion and the reconstructed T1 maps without and with motion correction of three healthy volunteers are shown in Figure 4. For all volunteers the myocardial T1 values measured on the non-motion corrected T1 map (NMC T1 map) are underestimated compared to the translational motion corrected T1 map (MC T1 map), as shown in Figure 5. The average myocardial T1 between of all subjects for the NMC T1 map and the MC T1 map are 998.6±101ms and 1115.4±110ms, respectively. The T1 values measured on the MC T1 maps are in good agreement with the literature3,5 , with myocardial T1 values in the range of 1150-1200ms. Motion estimated from the fat-iNAV is robust as image contrast should be less affected by the different saturation times compared to a water signal based navigator due to the short T1 of fat. Fat-iNAV permits translational motion correction of the single T1 weighted images and to produce a T1 map with 100% scan efficiency. Improvement in myocardial delineation and accuracy of the measured T1 values was obtained after motion correction, while a significant underestimation of myocardial (P<0.01) and blood (P<0.05) T1 was observed in NMC T1 maps.Conclusion
We successfully demonstrate the feasibility of combining a free-breathing whole-heart 3D saturation-recovery T1 mapping acquisition with an interleaved fat image navigator for beat-to-beat motion correction with 100% scan efficiency. Future works will investigate non-rigid motion correction and undersampled reconstruction to further improve the image quality as well as to shorten scan time and or improve spatial resolution.Acknowledgements
This work was supported by the EPSRC Centre for Doctoral Training in Medical Imaging (EP/L015226/1), Philips Healthcare, by EPSRC grants EP/P001009/1 and EP/P007619/1, and FONDECYT N°1161051.References
1 S. Weingartner et al., MRM 2015; 2 H. Clique et al., MRM 2014; 3 G. Nordio et al., SCMR 2017; 4 M. Henningsson et al., MRM 2013; 5 Chow et al; MRM 2012Figures
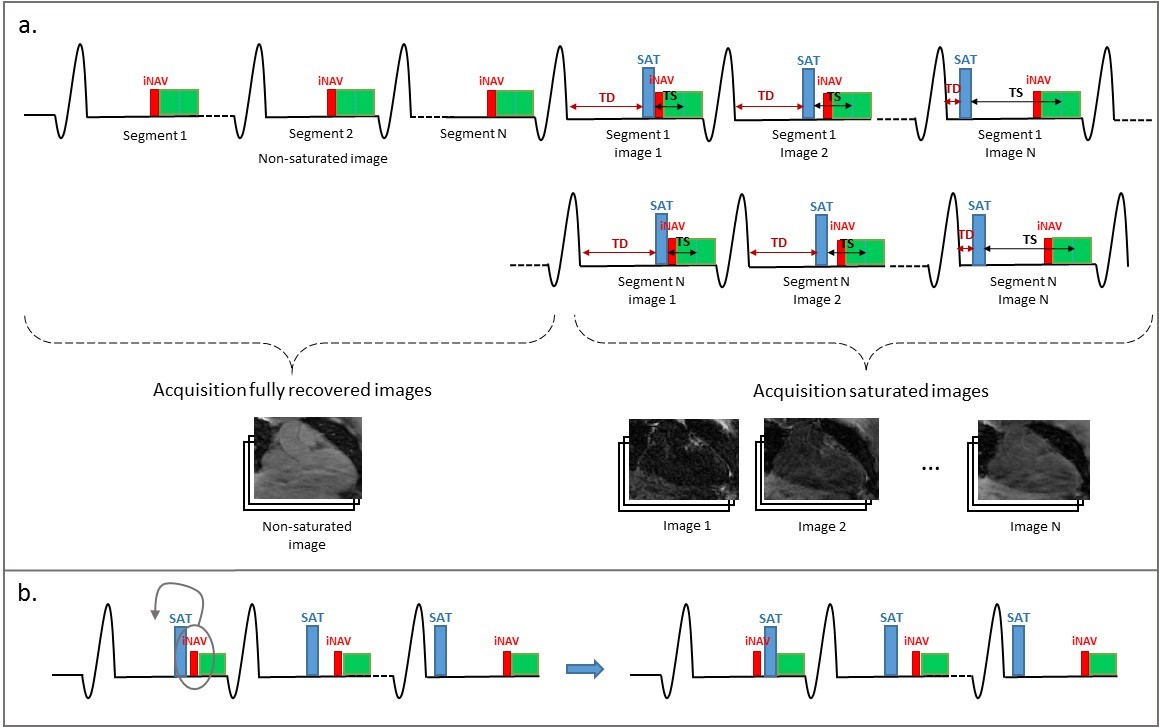
Figure 1:
Schematic diagram of the 3D SASHA imaging sequence: a) First all images without
magnetization preparation are acquired. This is followed by an interleaved saturation
recovery acquisition with varying saturation times (TS). b) For the shortest TS
the position between the saturation pulse (SAT) and the fat image navigator (fat-iNAV)
is swapped.
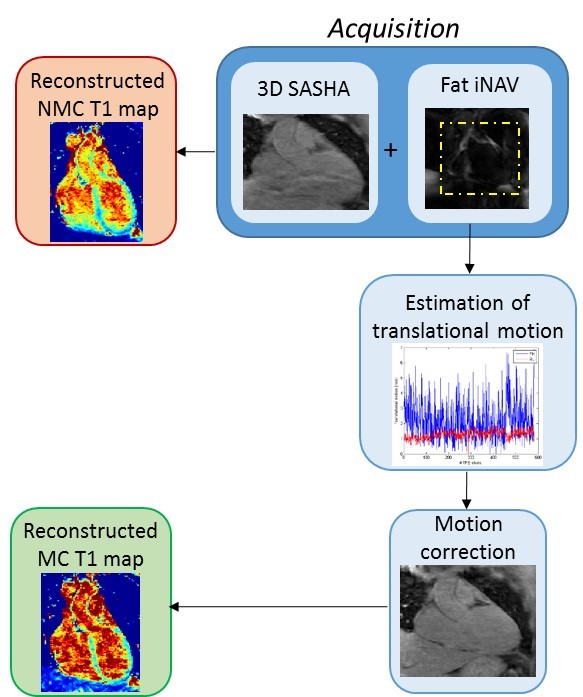
Figure 2:
Pipeline of the proposed technique. The acquisition combines 3D SASHA acquisition
with fat image navigator (fat-iNAV). From the fat-iNAV the respiratory motion
is estimated and then used to correct each segment of the T1-weighted image. A motion
corrected (MC) and a non-motion corrected (NMC) T1 map are subsequently reconstructed.
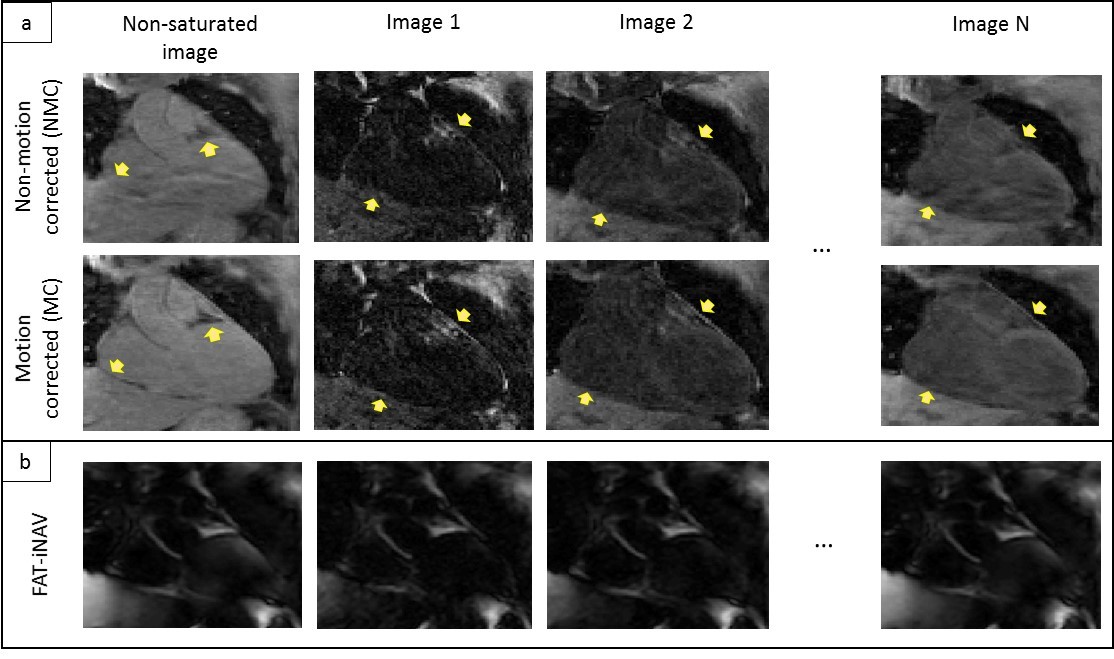
Figure 3:
a) T1-weighted images before and after fat-iNAV translational motion
correction. A visible improvement of myocardial border delineation can be
observed after motion (yellow arrow). b) Fat-iNAV with different : the contrast
is maintained constant between the fat-iNAV.

Figure 4:
Three representative healthy subjects acquired with the proposed imaging
technique. a) Fat image navigator used to estimate respiratory motion. b) Corresponding estimated translational motion (food-head
(FH) in blue, and left-right (RL) in red). c) Reconstructed no--motion
corrected (NMC) and motion corrected (MC) T1 maps and corresponding myocardial
and blood T1 values.
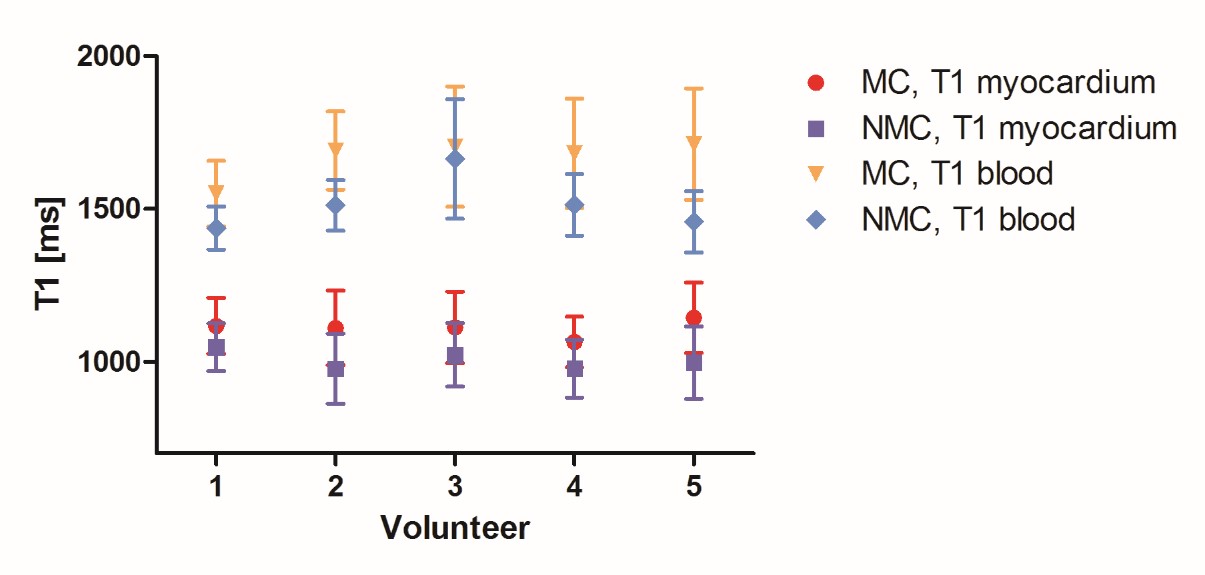
Figure 5:
Mean and standard deviation of the myocardial and blood T1 for all five subjects.
T1 values were measured in the motion-corrected (MC) and non-motion corrected
(NMC) T1 maps.