3106
The Effect of Mixing Time on Diffusion Spectrum Imaging of the Ex-vivo Porcine Heart1Institute for Biomedical Engineering / University and ETH Zurich, Zurich, Switzerland
Synopsis
Higher order diffusion imaging has revealed new insights into myocardial microstructure. At the b-values required for diffusion kurtosis or diffusion spectrum imaging, translation into human in-vivo application requires Stimulated Echo Acquisition Mode imaging (STEAM) at prolonged mixing-times. In this study the effect of mixing time on diffusion parameters is investigated covering the range of current spin-echo and STEAM aproaches. Results show that fractional anisotropy increases and mean diffusivity decreases with mixing-time. Diffusional kurtosis was found to decrease with mixing-time by varying amounts along fiber, sheet and sheet-normal direction which needs to be considered when comparing spin-echo imaging with STEAM acquisitions.
Introduction
Higher order diffusion imaging such as diffusion kurtosis (DKI) imaging provides new insights into myocardial microstructure1 and dynamics2 and facilitates novel contrast mechnisms to assess cardiac hypertrophy in conjunction with aortic stenosis3. Translation into an in-vivo setting, however, is hampered by the requirement for strong gradients. The b-values required (b≥2000s/mm2)1,3 are currently only achievable with Stimulated Echo Acquisition Mode (STEAM) sequences employing a mixing time (TM) of one heart beat (~1sec). The objective of the present study was to investigate the effect of different TMs on diffusion properties in the ex-vivo porcine heart using diffusion spectrum imaging (DSI).Methods
Data acquisition
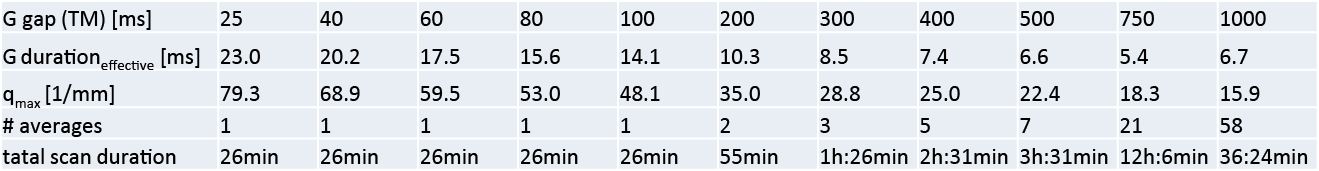
One porcine heart was perfusion- and immersion-fixed with a 4% PFA2 in phosphate-buffered saline solution within 20min after excision. Imaging was performed on a 3T clinical system (Philips Healthcare, Best, The Netherlands) equipped with an 8-channel head coil and a gradient system delivering 80mT/m @ 100mT/m/ms. DSI data was acquired using a single shot echo planar imaging (EPI) STEAM sequences with a half sphere sampling pattern: bmax=10015s/mm2 and an edge length of 15 along each dimension. Imaging parameters were as follows: 2 slices, resolution: 2.5×2.5×8mm3, TR: 2s, TE: 81ms. An unweighted reference image was interleaved every 20th acquisition and the order of diffusion encoding was optimized to minimize gradient duty cycle4. Timings of the unipolar diffusion encoding gradients are reported in Table 1. Complex averaging was employed to avoid bias due to noise floor5. Over the course of the entire experiment temperature was monitored via optical fiber thermometry inside the sample at 10sec intervals.
Data analysis
Diffusion tensors were estimated upon manual masking of the myocardium including data with a bmax<2000s/mm2. Pixels for which the tensors first eigenvector deviated from the circumferential course by more than 30° were discarded. Mean Diffusivity (MD), Fractional Anisotropy (FA) as well as the tensors’ eigenvalues and eigenvectors (v1/v2/v3) were derived from the diffusion tensors. Displacement probability distribution functions (PDF) along v1/v2/v3, i.e. fiber, sheet and sheet normal direction, were computed and the Full Width at Half Maximum (FWHM) calculated upon Hamming filtering and zero filling (1.5 times) of q-space. Diffusional kurtosis K was calculated by fitting: $$log\left(\frac{S\left(b\right)}{S\left(0\right)}\right)=-bD+\frac{Kb^2D^2}{6}$$ to the resampled signal along v1,v2 and v3 (bmax<5000s/mm2)3. S(0) denotes the unweighted reference image.
Results
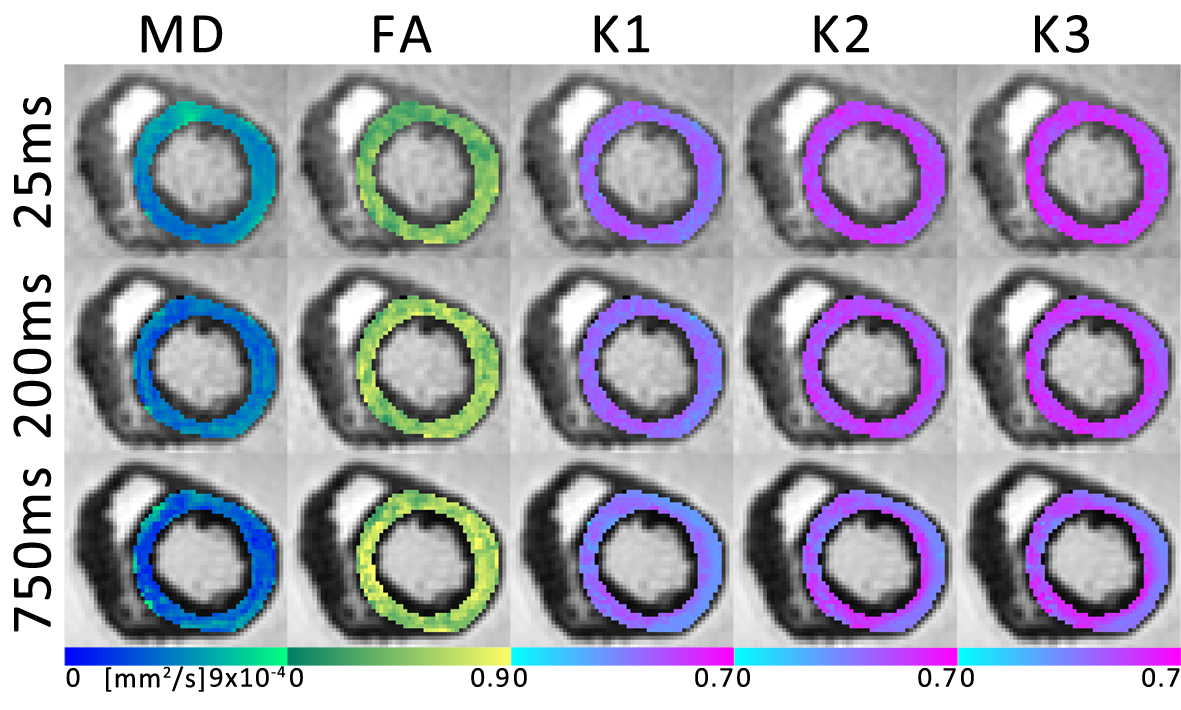
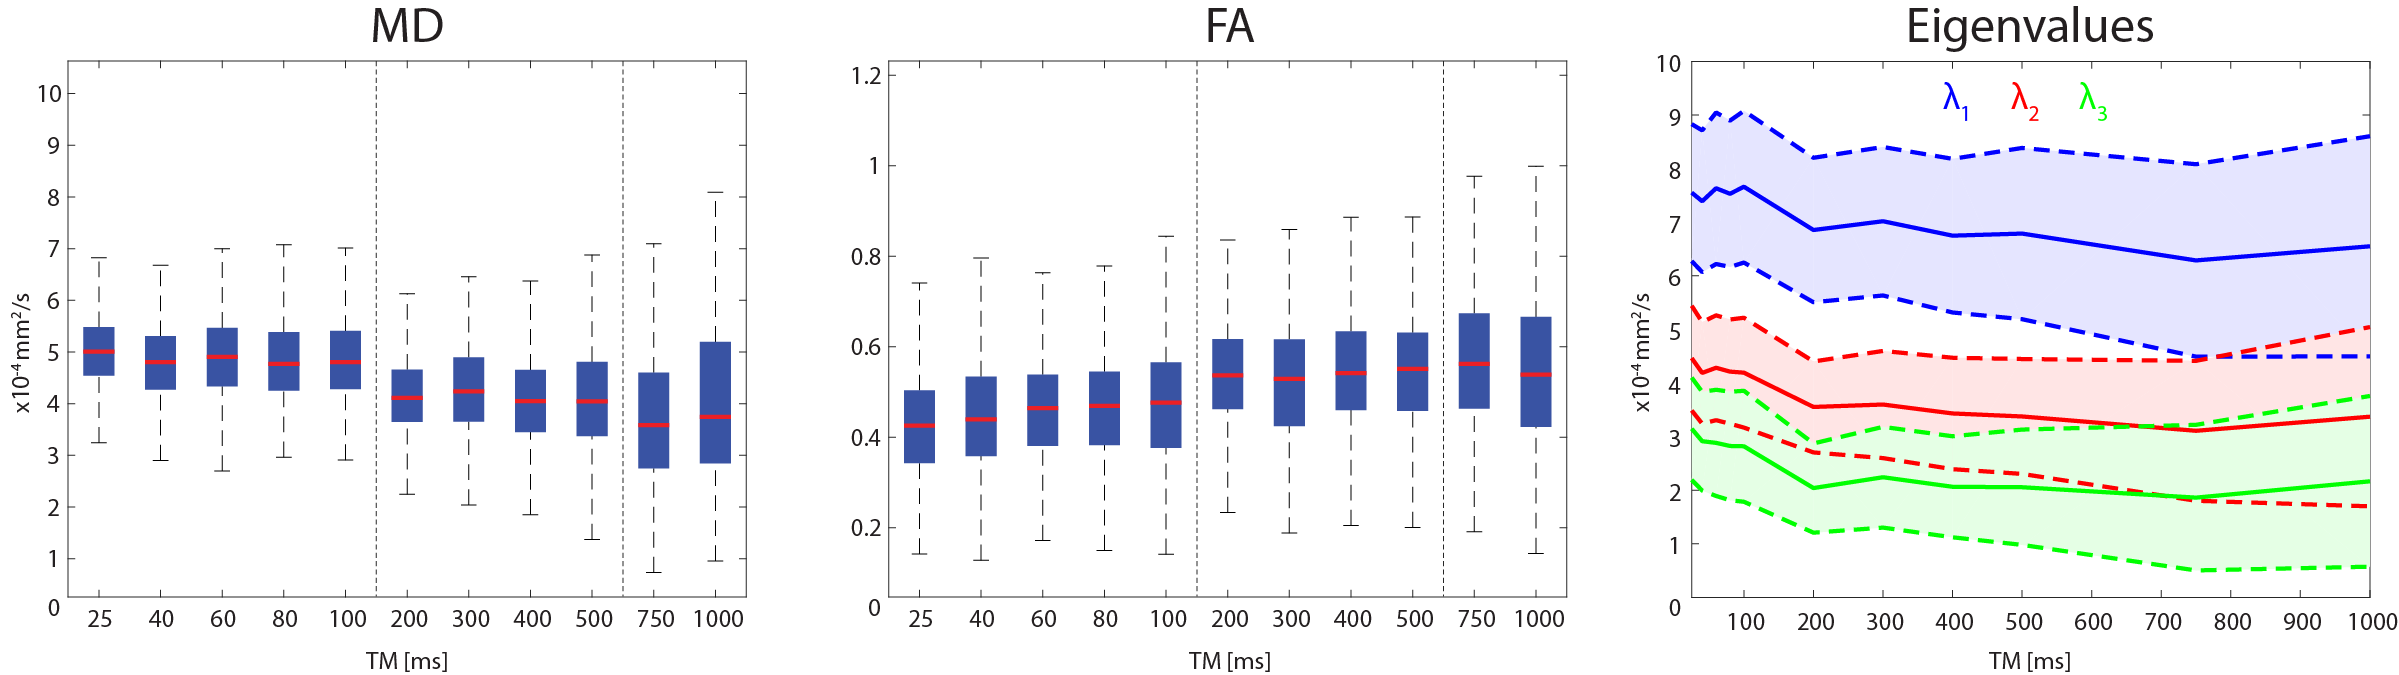
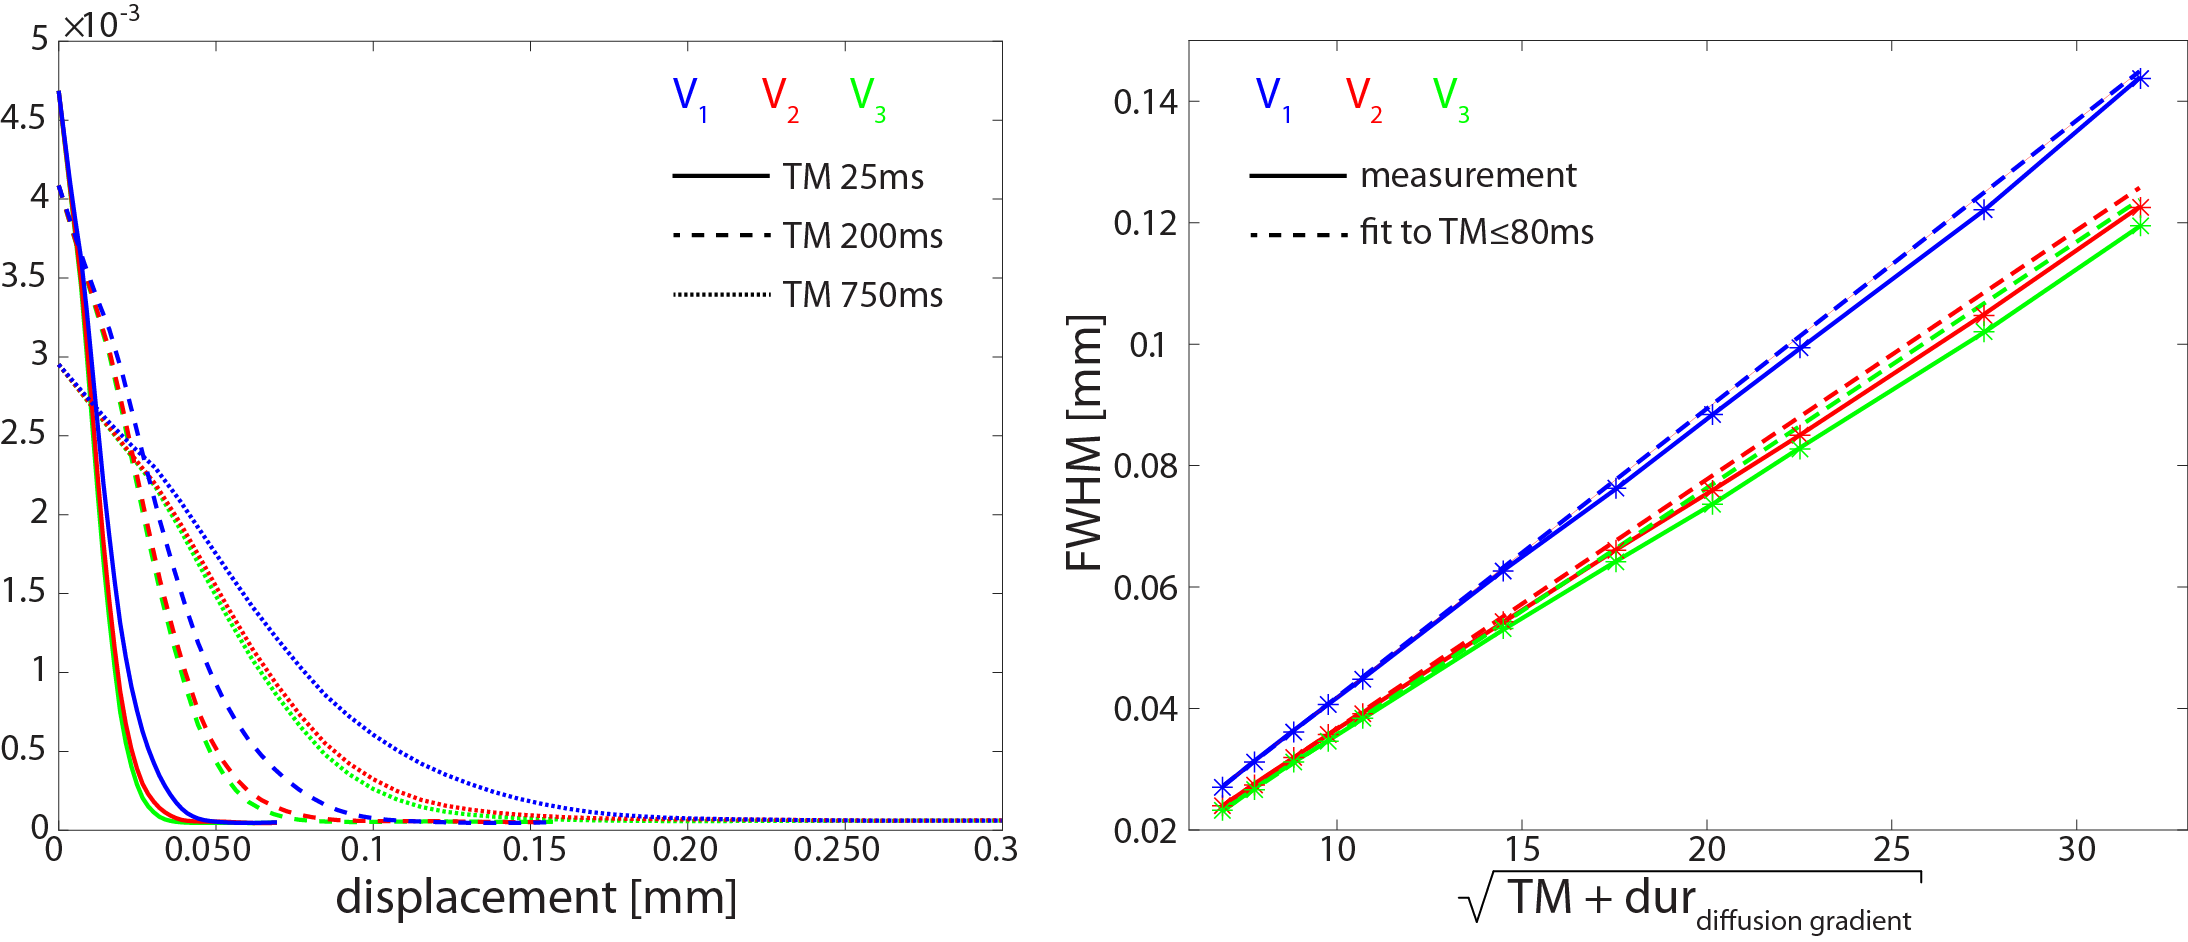
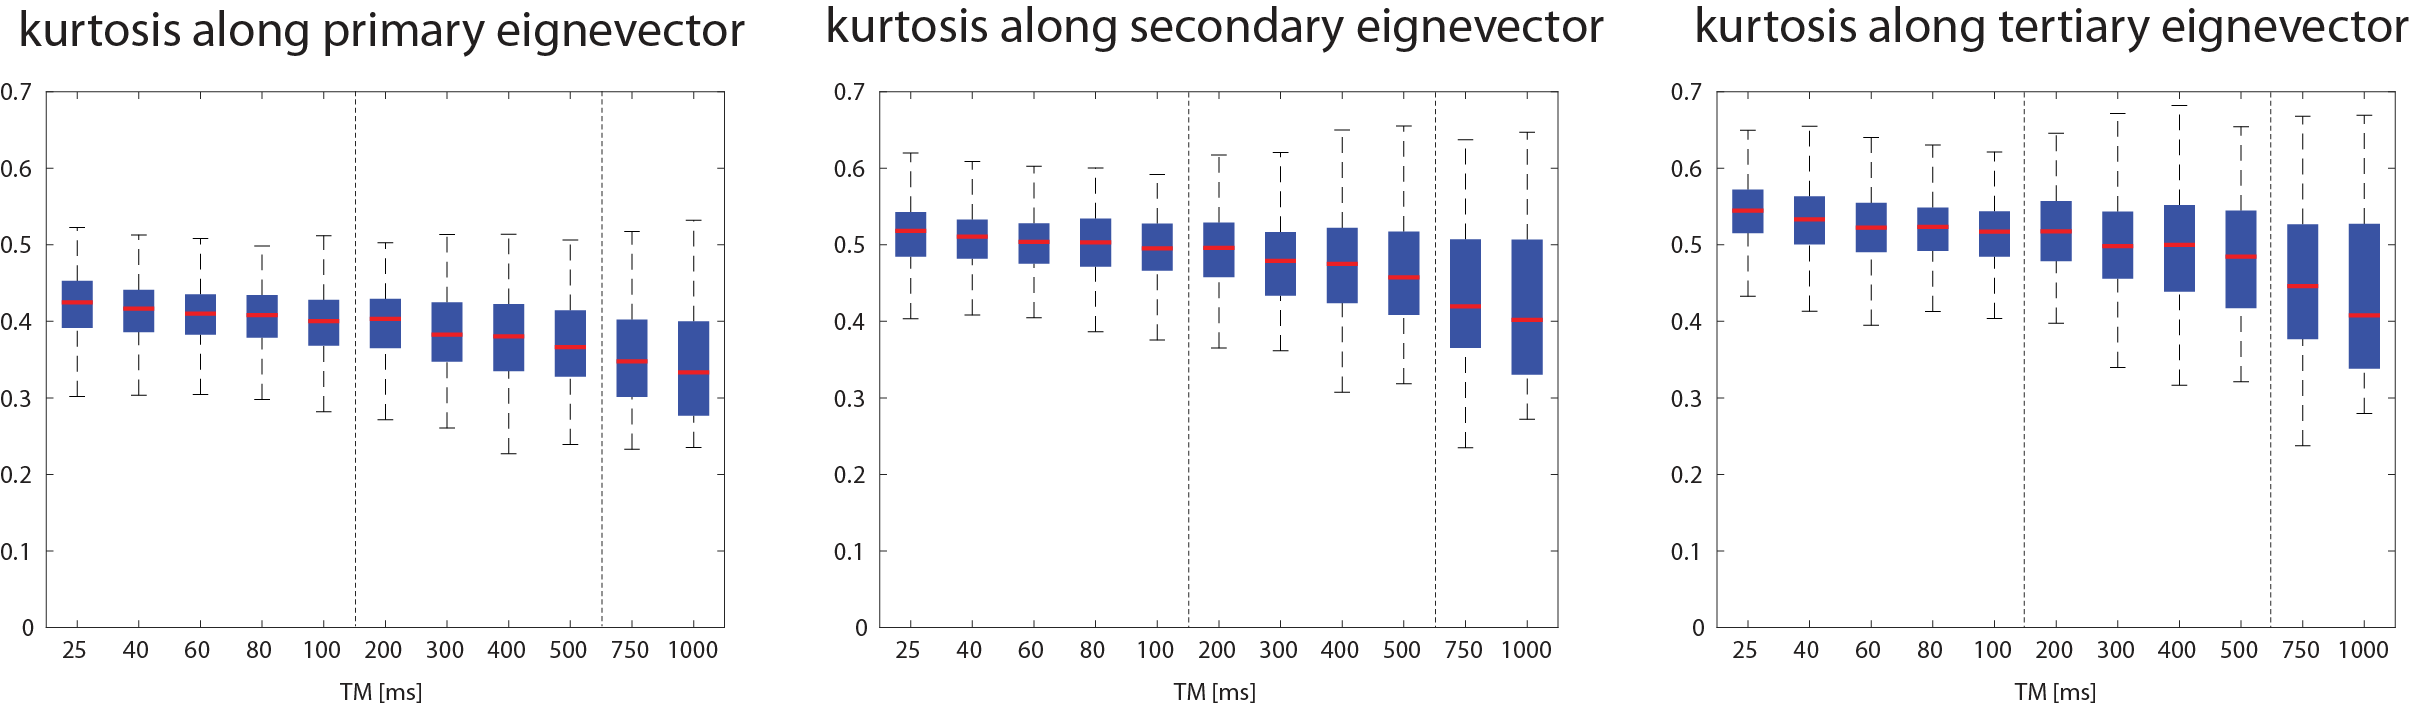
The sample tempe rature over ~60h of the experiments remained stable between min:22.7°C and max:23.9°C°. Figure 1 presents example parameter maps for MD, FA and kurtosis along v1/v2/v3 for different TMs. The MD, FA as well as the tensors’ eigenvalues across the myocardium are shown in Figure 2 as function of different TM. A decrease of MD by 28% and an increase of FA by 32% were found. The largest change in apparent diffusivity was detected between a TM of 100ms and 200ms. Correspondingly example PDFs and their FWHM as function of the square root of TM plus duration of the diffusion gradient is shown in Figure 3. A deviation from a linear dependency is found along all eigenvectors but predominantly for v2/v3. Figure 4 illustrates the fitted kurtosis along v1, v2 and v3. The kurtosis along v1 is lowest and decreases by 0.09 (21.5%) over the range of TMs, followed by the kurtosis along v2 decreasing by 0.12 (22%) and the highest Kurtosis along v3 decreasing by 0.14 (25.2%).Discussion
Previous work6 has reported a decrease in MD by 16% for a TM of 412ms and an increased FA by 48% using STEAM-DTI in non-fixated ex-vivo calf hearts and most significant changes were present within TM≤200ms similar to this study. Due to the necessary use of tissue fixation, the apparent diffusivity is found to be lower by a factor of three. In this study a reduction in diffusional kurtosis was found over the range of TMs representing a more Gaussian shaped PDF in the long TM limit as theoretically discussed7. Reduction in kurtosis was more pronounced along sheet normal direction and least along myofiber direction representing the different densities of semipermeable membranes along and across the myocardial sheet structure. Furthermore, the results indicate that differences in TM play a major role when comparing in-vivo spin echo (TM<100ms) to STEAM imaging (TM of one heart beat) for which a decrease of MD (-26%) and an increase of FA (+55%) are reported8.Conclusion
Increasing mixing time for cardiac diffusion weighted imaging changes apparent diffusivity towards more Gaussian shaped 3D displacement probability functions with reduced kurtosis and more anisotropic apparent diffusivities of reduced magnitude.Acknowledgements
No acknowledgement found.References
1. Mazzoli V, Froeling M, Nederveen AJ et al. Cardiac diffusion MRI beyond DTI; ISMRM 2014
2. Lohezic M, Teh I, Bollensdorff C et al. Interrogation of living myocardium in multiple static deformation states with diffusion tensor and diffusion spectrum imaging. Prog Biophys Mol Biol. 2014;115(2-3):213-25
3. McClymont D, Teh I, Carruth E et al. Evaluation of Non-Gaussian Diffusion in Cardiac MRI; MRM 2016; doi: 10.1002/mrm.26466
4. Vos SB, Tax CMW, Luijten PR, et al. The importance of correcting for B0-drift-induced global signal decrease in diffusion MRI. MRM 2016; doi: 10.1002/mrm.26124
5. Scott A, Nielles-Vallespin S, Ferreira PF, et al. The effects of noise in cardiac diffusion tensor imaging and the benefits of averaging complex data; NMR in Biomed 2016 ;29(5):588-99
6. Kim S, Chi-Fishman G, Barnett AS et al. Dependence on diffusion time of apparent diffusion tensor of ex vivo calf tongue and heart; MRM 2005; 54(6):1387-96
7. JensenJH, Helpern JA MRI quantification of non-Gaussian water diffusion by kurtosis analysis.; NMR Biomed. 2010;23(7):698-710
8. von Deuster C, Stoeck CT, Genet M, et al. Spin echo versus stimulated echo diffusion tensor imaging of the in vivo human heart. Magn Reson Med. 2015;doi: 10.1002/mrm.25998
Figures