3105
Identifying tissue changes of “normal-appearing” myocardium in pediatric myocarditis patients using quantitative T1 and T2 mapping techniques1Shandong Medical Imaging Research Institute, Ji'nan, People's Republic of China, 2Shandong Medical Imaging Research Institute, 3Siemens Healthcare, MR Collaborations NE Asia, Beijing, People's Republic of China, 4Siemens SSMR, APPL, 5Siemens Healthcare, Application Development, Erlangen, Germany, 6Shandong Provincial Qianfoshan Hospital
Synopsis
This study aimed to identify diffuse myocardial tissue changes in pediatric myocarditis patients by applying T1 and T2 mapping techniques. The correlations between T1 and T2 values and cardiac function were assessed. Abnormal post-contrast T1 values and extracellular volume (ECV) of “normal appearing” myocardium in pediatric myocarditis patients were found and were correlated with left ventricular cardiac function and stroke volume (SV) in children with chronic myocarditis.
Introduction
Myocarditis is an inflammation of the myocardium and has been identified as a significant cause of sudden death in children. Traditional cardiac magnetic resonance (CMR) imaging can only detect and quantify focal myocardial tissue changes in myocarditis; however, some patients with myocarditis only present with diffuse, as opposed to focal, myocardial changes on imaging and thus can be misdiagnosed. T1 and T2 mapping techniques have the potential to identify diffuse myocardial tissue changes of myocarditis. In this study we identified the “normal-appearing” myocardium—myocardium without edema or fibrosis visible on conventional MRI. We attempted to determine if T1 and T2 mapping techniques could identify diffuse tissue changes specific to myocarditis in pediatric patients, and we then evaluated whether there were correlations between T1 and T2 quantitative mapping values and left ventricular (LV) cardiac function in these same patients.Methods
Sixteen children with acute myocarditis (AM, 9 male, 7 female; mean age, 8.5 years; range, 2-14 years), 11 children with chronic myocarditis (CM, 8 male, 3 female; mean age, 6 years; range, 3-13 years) and 13 healthy children (8 male, 5 female; mean age, 11 years; range, 6-13 years) were included in this study. Images were acquired on a MAGNETOM Skyra 3T MR scanner (Siemens Healthcare, Erlangen, Germany) with an 18-channel body matrix coil. T2-weighted imaging and LGE imaging were performed to distinguish myocardium with focal myocardial edema and fibrosis from “normal-appearing” myocardium. T1 mapping was performed with a prototype 3(3)5 Modified Look-Locker Inversion Recovery (MOLLI) sequence in the horizontal long-axis (HLA) and 3 short-axis (SA) orientations before and 15 minutes after gadolinium-based contrast administration with the following parameters: TR/TE=2.4/1.1ms, FA=35°, FOV=300×225mm2, acquisition matrix=256×192mm2, voxel size=1.4x1.4x8.0mm³. T2 maps were acquired using a prototype steady-state free-precession (SSFP) sequence with three different T2 preparation times with the following parameters: TE=0 ms, 25 ms, 55 ms, TR=3 x RR, FA=50°, FOV=300x225mm2, acquisition matrix=256x384mm2, voxel size= 0.9x0.9x8.0mm³. Extracellular volume (ECV) was calculated using native and post-contrast T1 values of the LV myocardium, and blood pool as well as the hematocrit (HCT). SSFP cine images were acquired to evaluate LV cardiac function. Linear regression analyses were used to compare T1 values, T2 values and ECVs between the AM, CM, and NC groups as well as between the pediatric myocarditis patients with and without focal myocardial edema or fibrosis on conventional MRI. Correlations between post-T1 values, ECV, and LV cardiac function were also evaluated using multiple linear regression analyses.Results
Regional myocardial edema or fibrosis was observed in six AM children (37.5%) and four CM children (36.4%). Compared with the NC group, significantly lower post-contrast T1 values of “normal-appearing” myocardium were observed in the AM group (SA: 738.7±49.6 ms VS 788.6±65.7 ms, P=0.008) and the CM group (HLA: 705.9±69.9 ms VS 777.7±66.6 ms, P=0.007; SA: 723.6±66.2 ms VS 788.6±65.7 ms, P=0.004), after adjustments were made for sex, age, heart rate, and HCT. The ECV of “normal-appearing” myocardium in the CM group was also found to be significantly higher than that in the NC group (SA: 30.3±3.0 VS 27.0±2.6, P=0.008). Significantly lower post-contrast T1 values were observed in pediatric myocarditis patients with focal myocardial edema or fibrosis than those without focal tissue changes (SA: 707.5±48.2 ms VS 745.5±57.3 ms, P=0.033). In the CM group, a significant linear correlation was found between post-contrast T1 values and LVEF (SA: HR, 9.2; 95% CI, 2.4-16.1, P=0.034), between post-contrast T1 values and SV (HLA: HR, 5.4; 95% CI, 2.9-7.9, P=0.013; SA: HR, 5.1; 95% CI, 1.0-9.3, P=0.050), and between ECV and SV (SA: HR, -0.1; 95% CI, -0.3, 0.0; P=0.044), after adjustments were made for age, sex, heart rate, and HCT.Discussion
Previous studies focused on measuring global T1 and T2 myocardial values in patients with myocarditis, but few studies focused on measuring these values of “normal-appearing” myocardium in myocarditis patients. Such “normal-appearing” myocardium might develop potential chronic inflammation, which has been confirmed histologically, and ultimately can precipitate dilated cardiomyopathy (DCM), which can only be cured with cardiac transplant. In our study, we found abnormal post-contrast T1 values and ECVs associated with “normal appearing” myocardium in AM and CM children that may represent the pathological changes leading to chronic inflammation and DCM. Therefore, T1 and T2 mapping techniques may increase the overall sensitivity of CMR in monitoring disease progression and the efficacy of therapies targeting fibrosisConclusion
Myocardial post-contrast T1 values and ECVs are associated with LVEF and SV in the CM group and thus may be able to detect diffuse myocardial tissue changes in pediatric myocarditis patients whose disease would be otherwise missed by traditional CMR.Acknowledgements
No acknowledgement found.References
No reference found.Figures
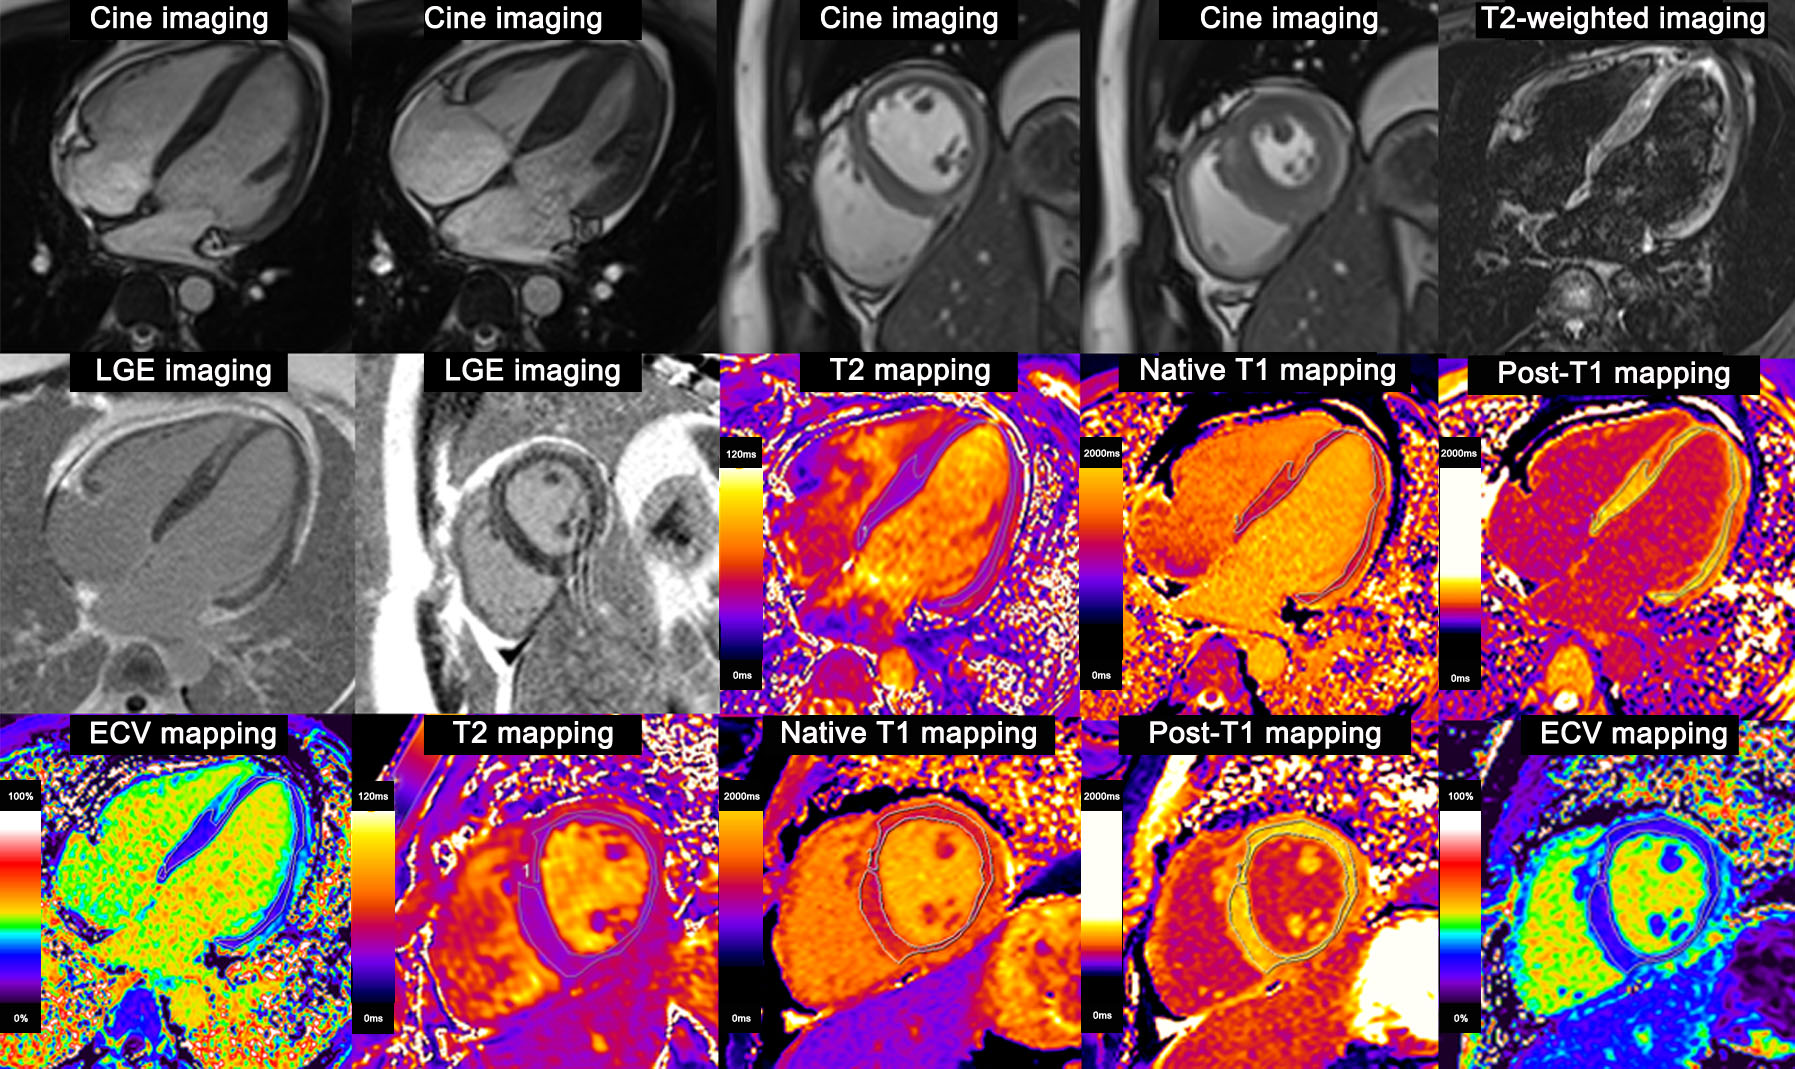
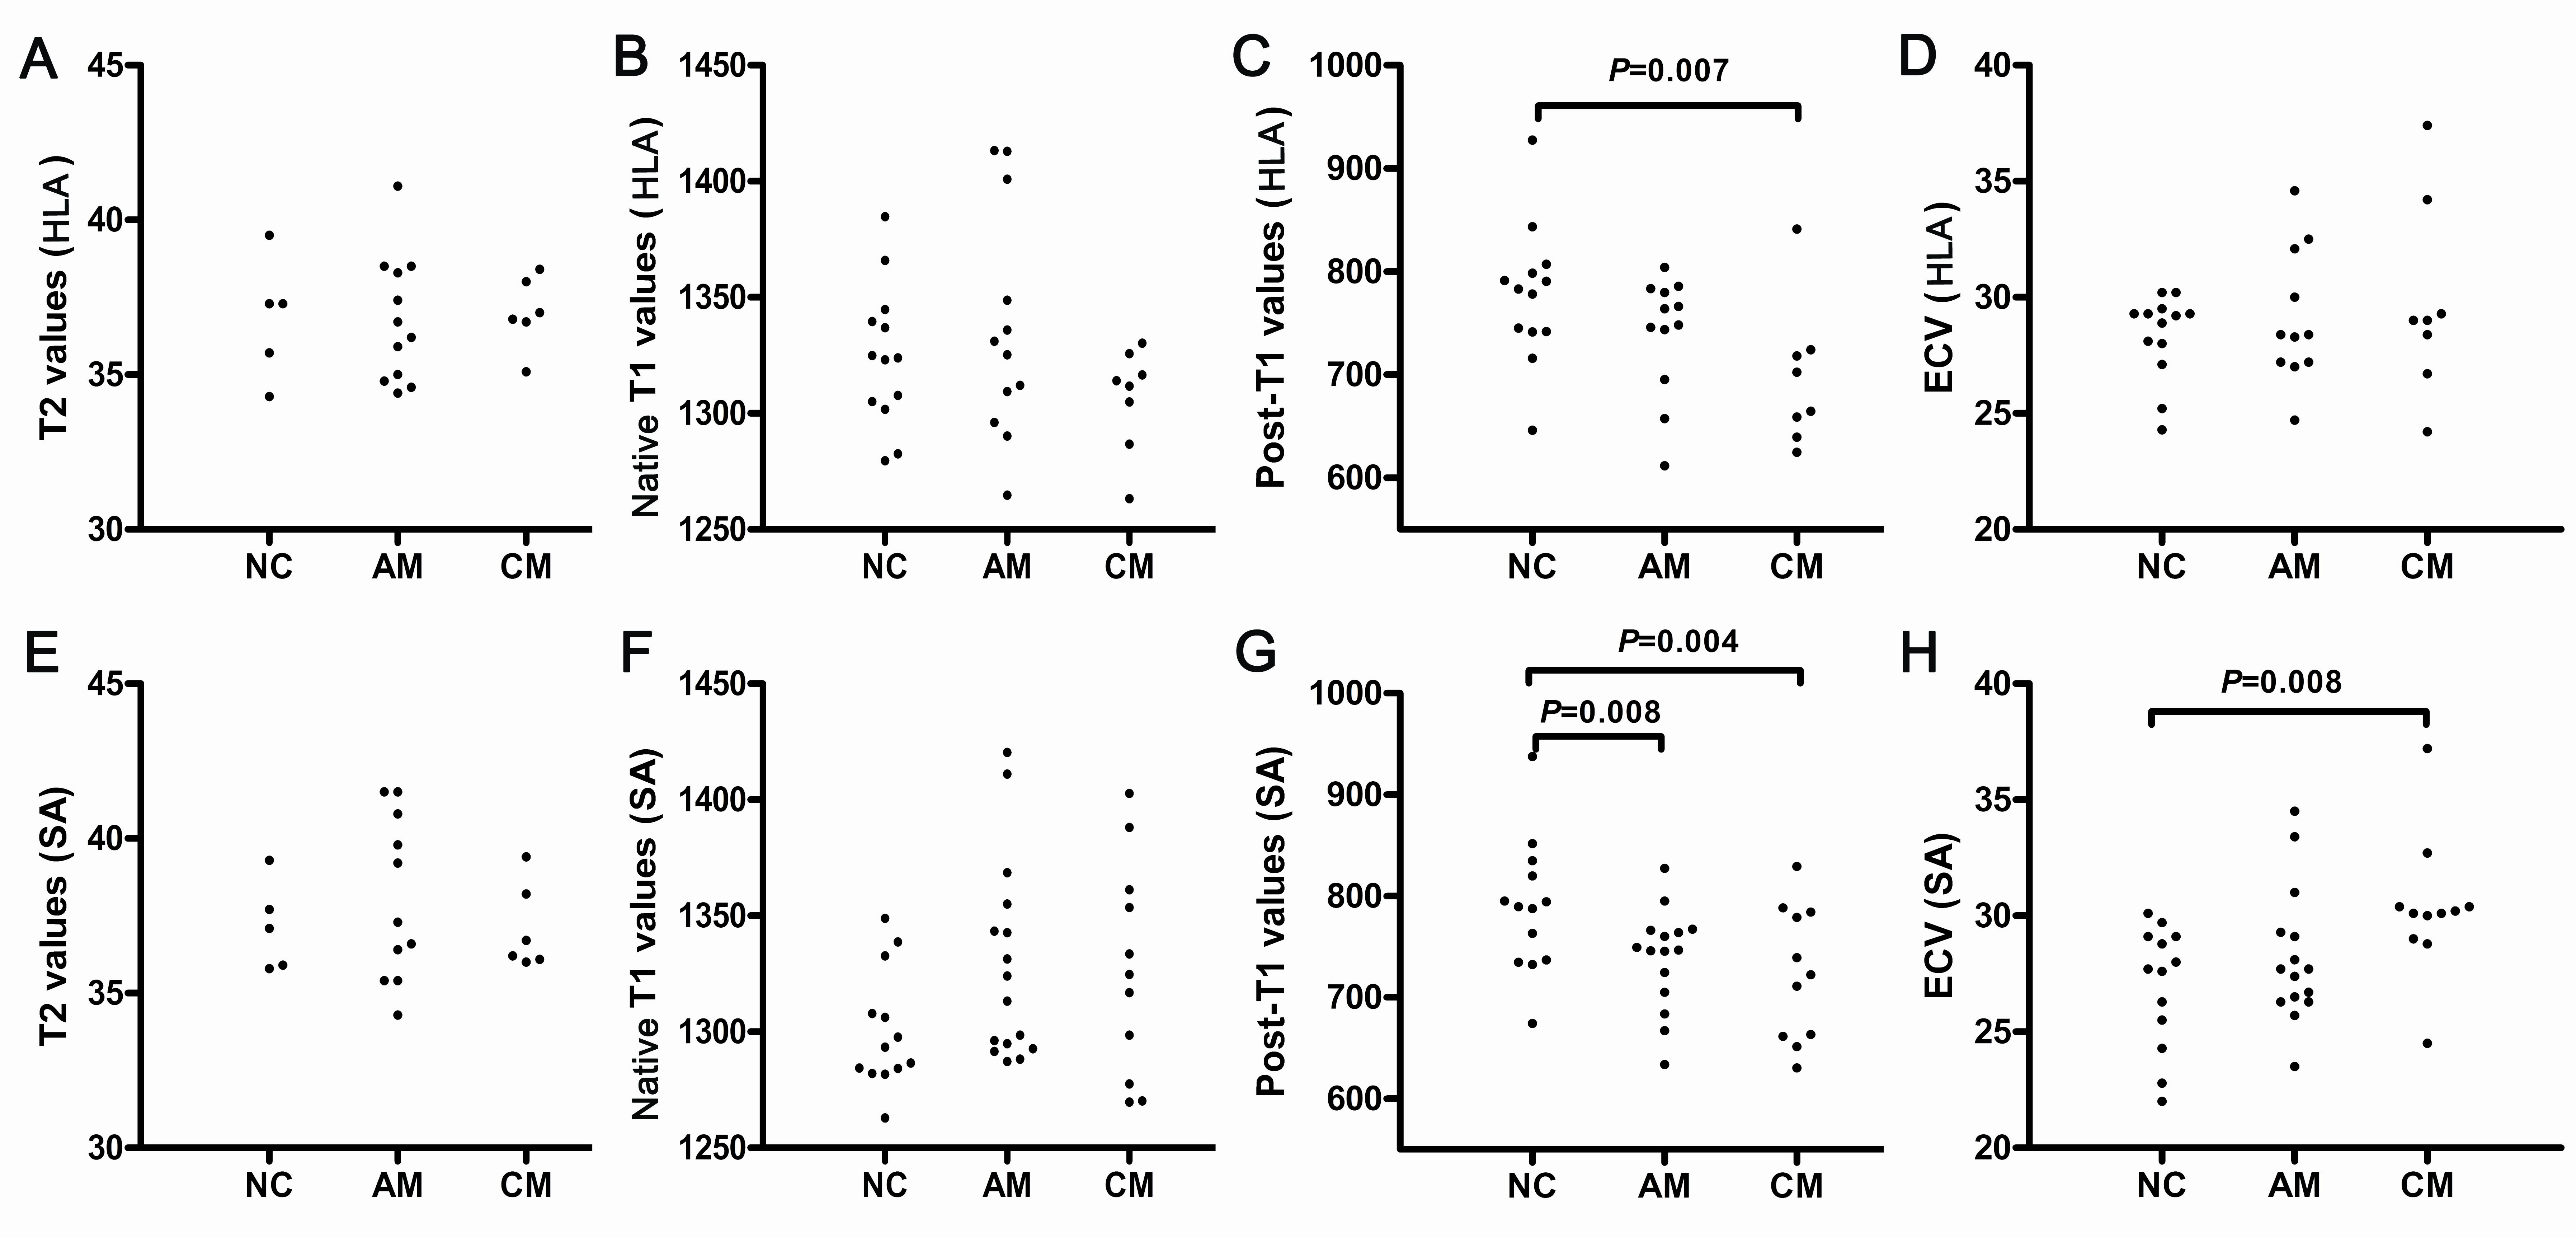
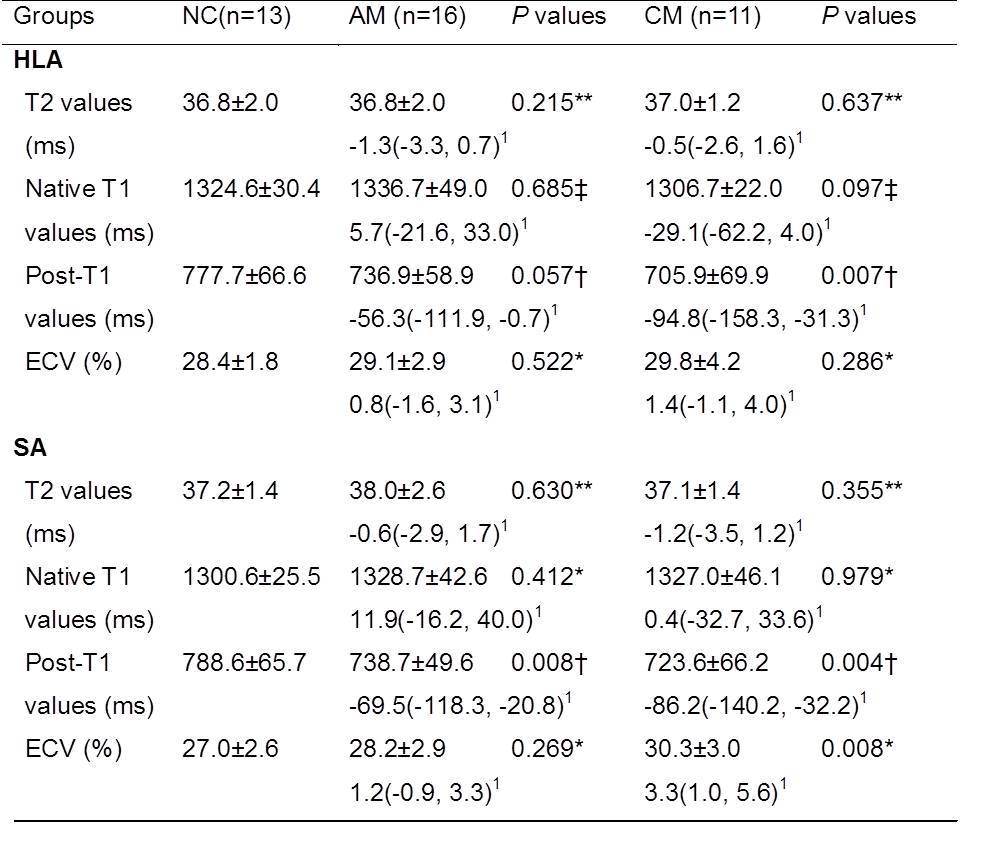
Table 1: T1 and T2 values of “normal-appearing” myocardium in AM, CM, and NC groups. P values indicate the statistical significance of the difference between the AM and CM groups vs the NC group.
Values are presented as mean ± SD 1adjusted hazard ratio (95% confidence intervals); *P values adjusted for: none; †P values adjusted for: age and heart rate; ‡P values adjusted for: age, heart rate, and hematocrit; **P values adjusted for: age, heart rate, hematocrit, and sex. NC, normal control; AM, acute myocarditis; CM, chronic myocarditis; HLA, horizontal long axis; SA, short axis; ECV, extracellular volume.
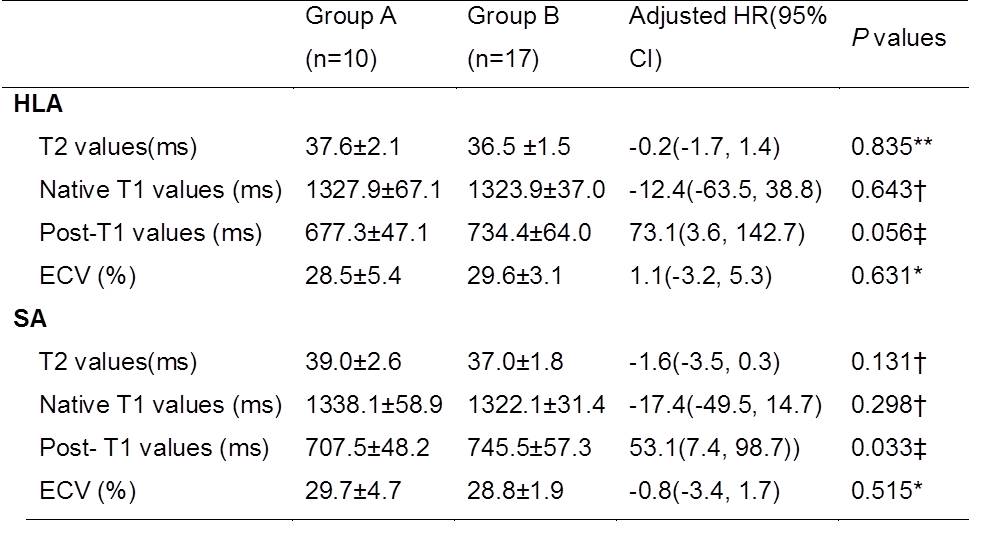
Table 2: T1 and T2 values of “normal-appearing” myocardium in pediatric myocarditis patients with and without focal myocardial edema or fibrosis on conventional MRI.
Values are presented as mean ± SD. Group A: children with edema or fibrosis; Group B: children without edema or fibrosis. *P values adjusted for: none; ‡P values adjusted for: sex and heart rate;†P values adjusted for: age, hematocrit, and sex; **P values adjusted for: age, heart rate, hematocrit, and sex. HR, hazard ratio; CI, confidence interval; HLA, horizontal long axis; SA, short axis; ECV, extracellular volume.
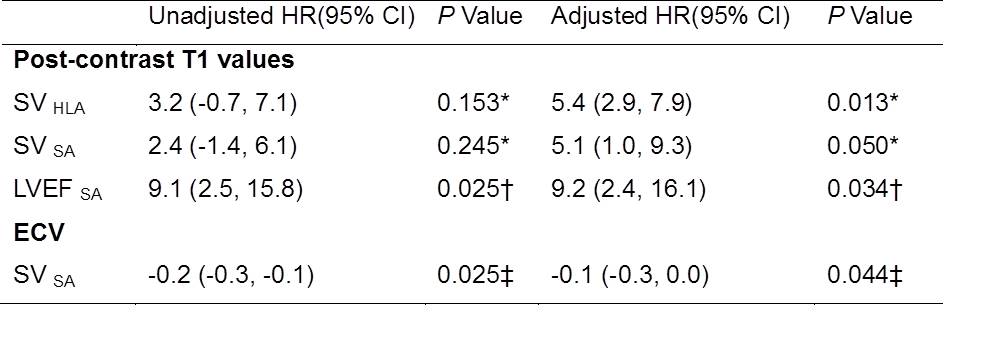
Table 3:Linear correlation between post-contrast T1 values, ECV, and LV cardiac function in the CM group.
*P values adjusted for: age, heart rate, and hematocrit; †P values adjusted for: age and hematocrit; ‡P values adjusted for: heart rate and hematocrit. ECV, extracellular volume; LV, left ventricular; CM, chronic myocarditis; HR, hazard ratio; CI, confidence interval; HLA, horizontal long axis; SA, short axis; LVEF: left ventricle ejection fraction.