3104
A comparison of STEAM and spin echo diffusion tensor CMR in hypertrophic cardiomyopathy patients1NIHR Cardiovascular Biomedical Research Unit, Royal Brompton Hospital, LONDON, United Kingdom, 2National Heart Lung and Blood Institute, NIH, Bethesda, MD, United States
Synopsis
Diffusion tensor (DT) cardiovascular magnetic resonance (CMR) can provide myocardial microstructural information using either motion compensated spin echo (SE) or stimulated echo acquisition mode (STEAM) sequences. Here we present the first DT-CMR data from a cohort of hypertrophic cardiomyopathy patients using SE, and compare parameters obtained from SE and STEAM sequences at 3T in two phases of the cardiac cycle. We demonstrate that whilst reliability measures, diffusivity, and anisotropy differ between the sequences, both approaches are able to detect the sheetlet microstructure that is integral to wall thickening during cardiac contraction and shown to be aberrant in this condition.
Introduction
Diffusion tensor (DT) CMR is increasingly used to
provide non-invasive measures of myocardial microstructure1-4.
Stimulated echo acquisition mode (STEAM) DT-CMR data acquired at peak systole
and in diastasis has demonstrated novel measures of microstructural dysfunction
in patients with hypertrophic cardiomyopathy patients (HCM)3, 4.
Recently, second order
motion compensated spin-echo imaging (SE) has been proposed as an SNR
efficient, strain insensitive alternative to STEAM and has shown promising
results in healthy volunteers at 1.5T with high-performance gradient systems
when imaging is performed in systole5. Here
we present dual phase DT-CMR data in a hypertrophic cardiomyopathy (HCM) cohort,
acquired using both STEAM and SE sequences at 3T.Methods
Eight
patients with HCM underwent CMR imaging including DT-CMR at 3T (Siemens,
Skyra). STEAM and SE data were acquired
using bmain=450smm-2 and bref =150smm-2,
in 6 directions with a voxel size of 2.8x2.8x8mm3 (1.4x1.4x8mm3
reconstructed), SENSE x2, field of view 360x135mm2. STEAM imaging
used TE=23ms, TR=2RR-intervals (7 images per breath hold) and SE imaging used
TE=75ms, TR=1RR-interval (14 images per breath hold). At least 8 STEAM or 16 SE
averages of satisfactory quality were acquired at a mid-ventricular slice. DT-CMR data were processed using custom
MATLAB software. Results
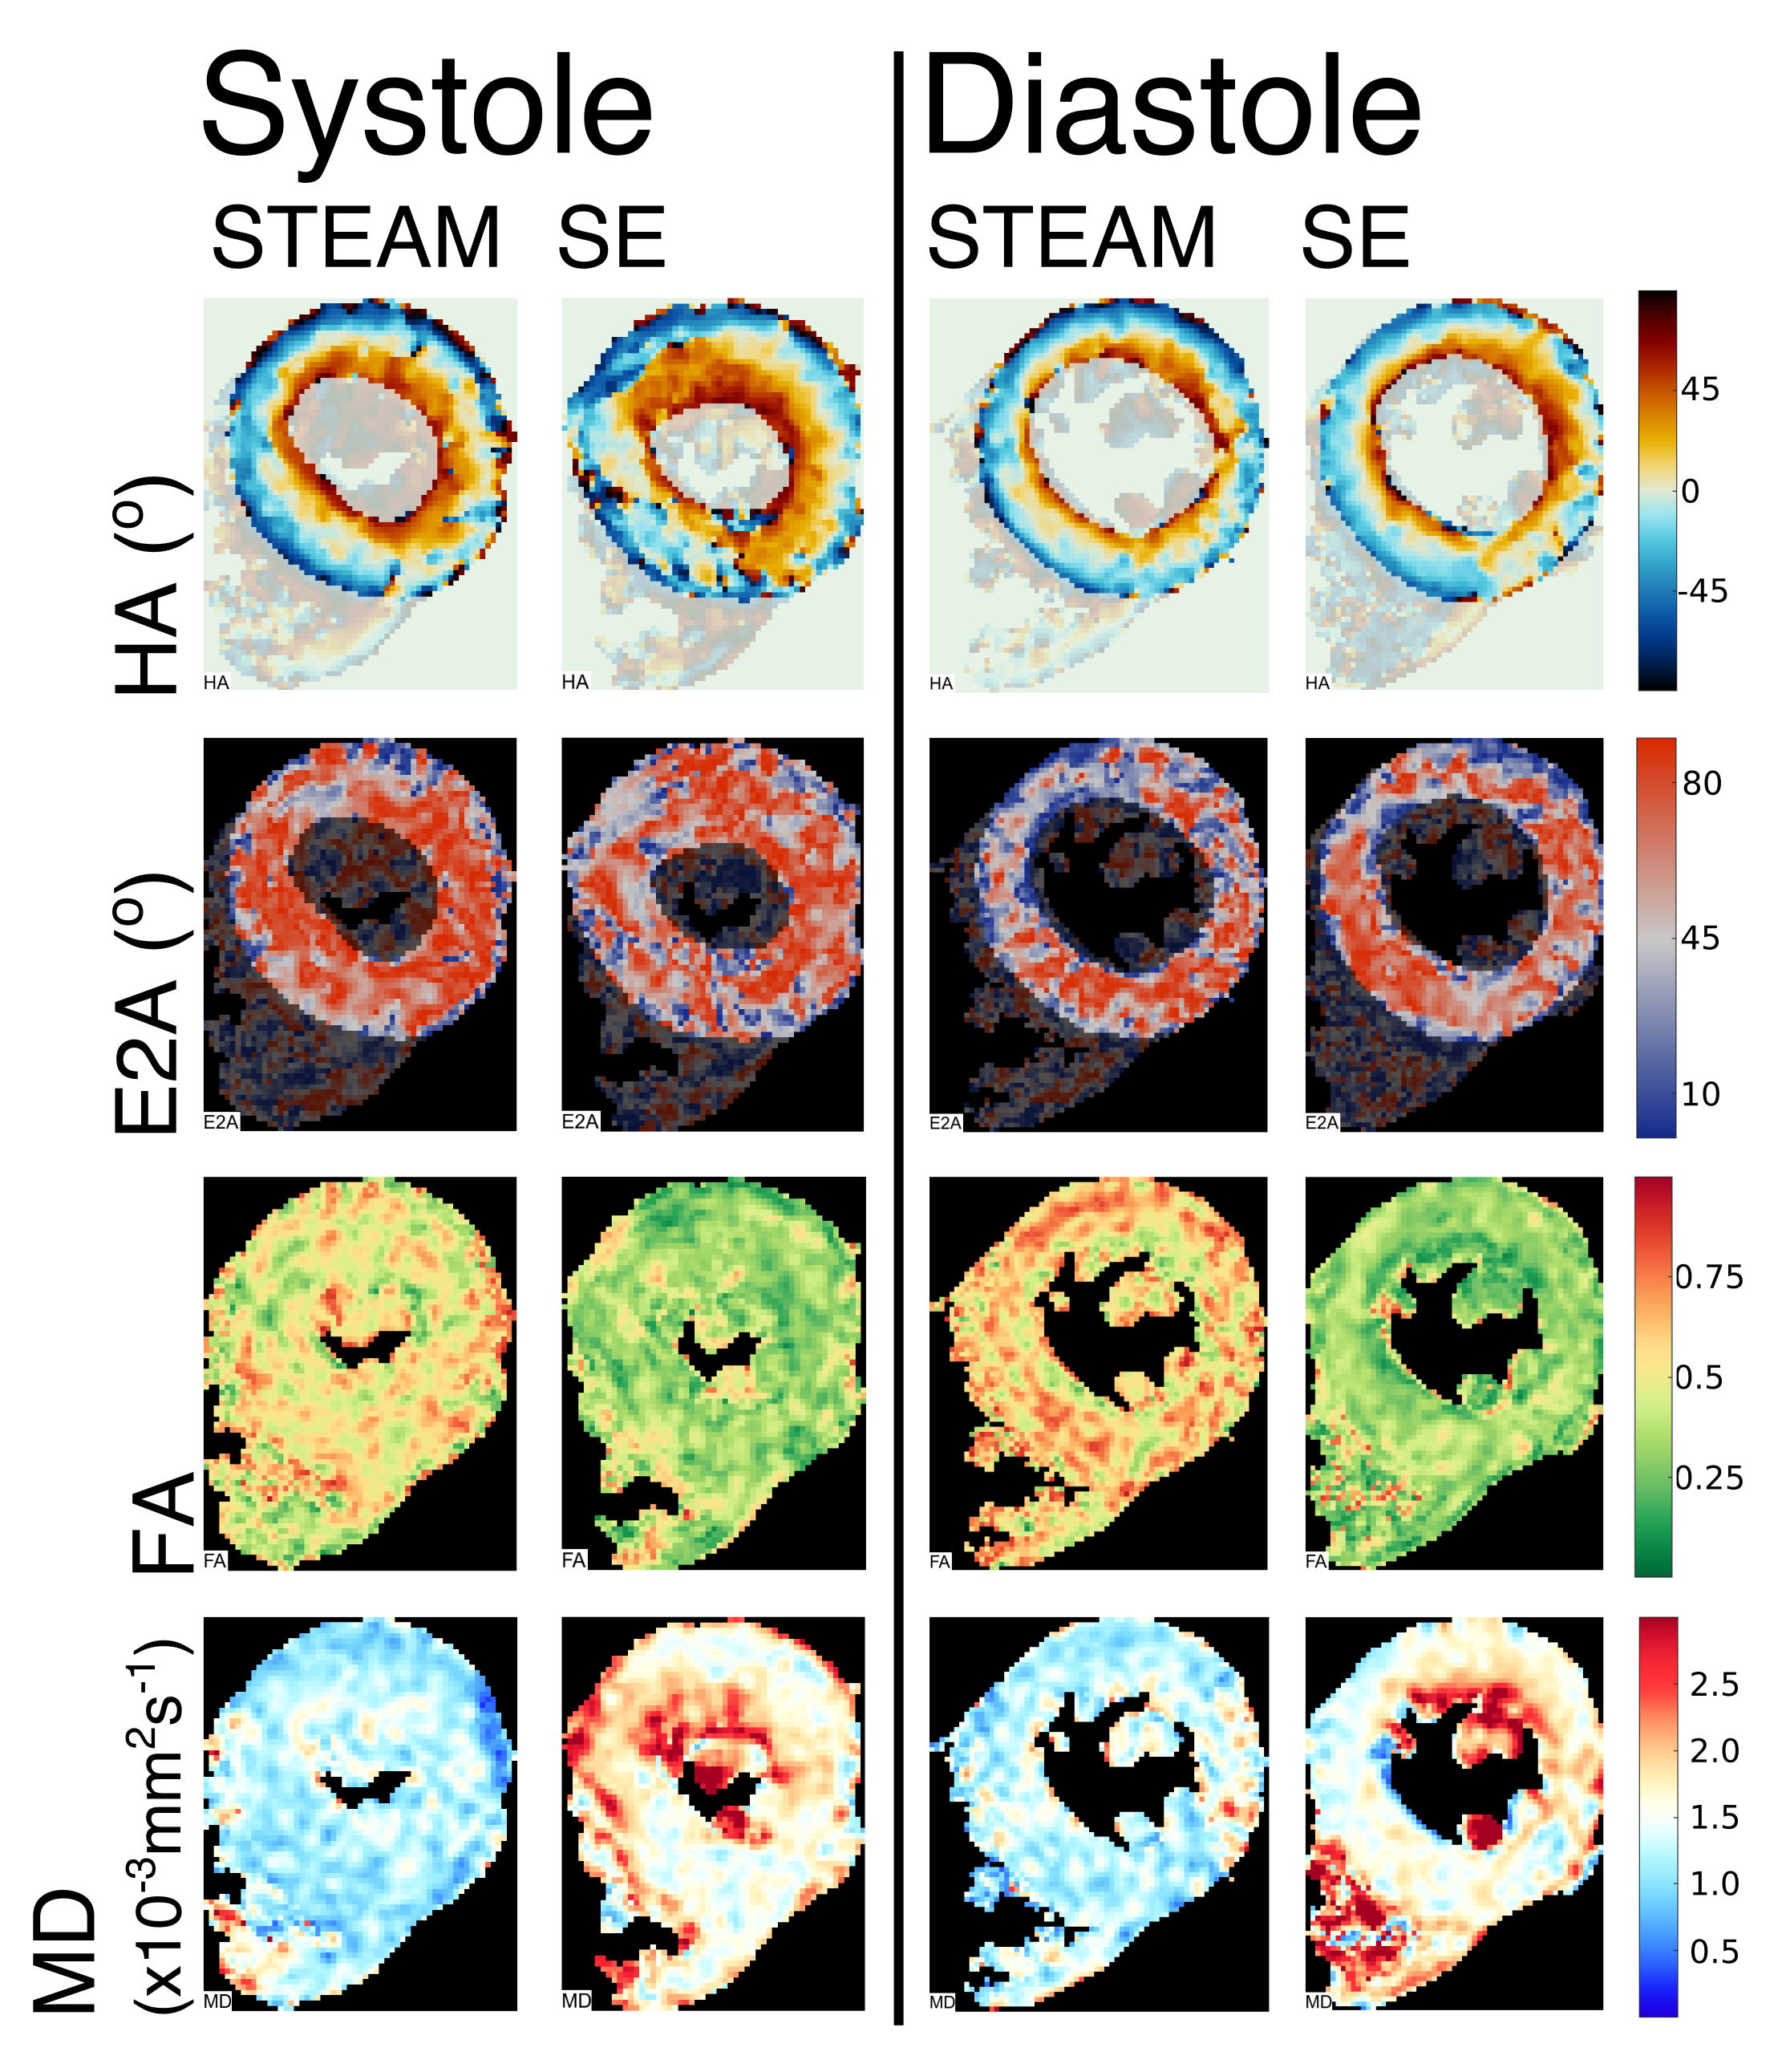
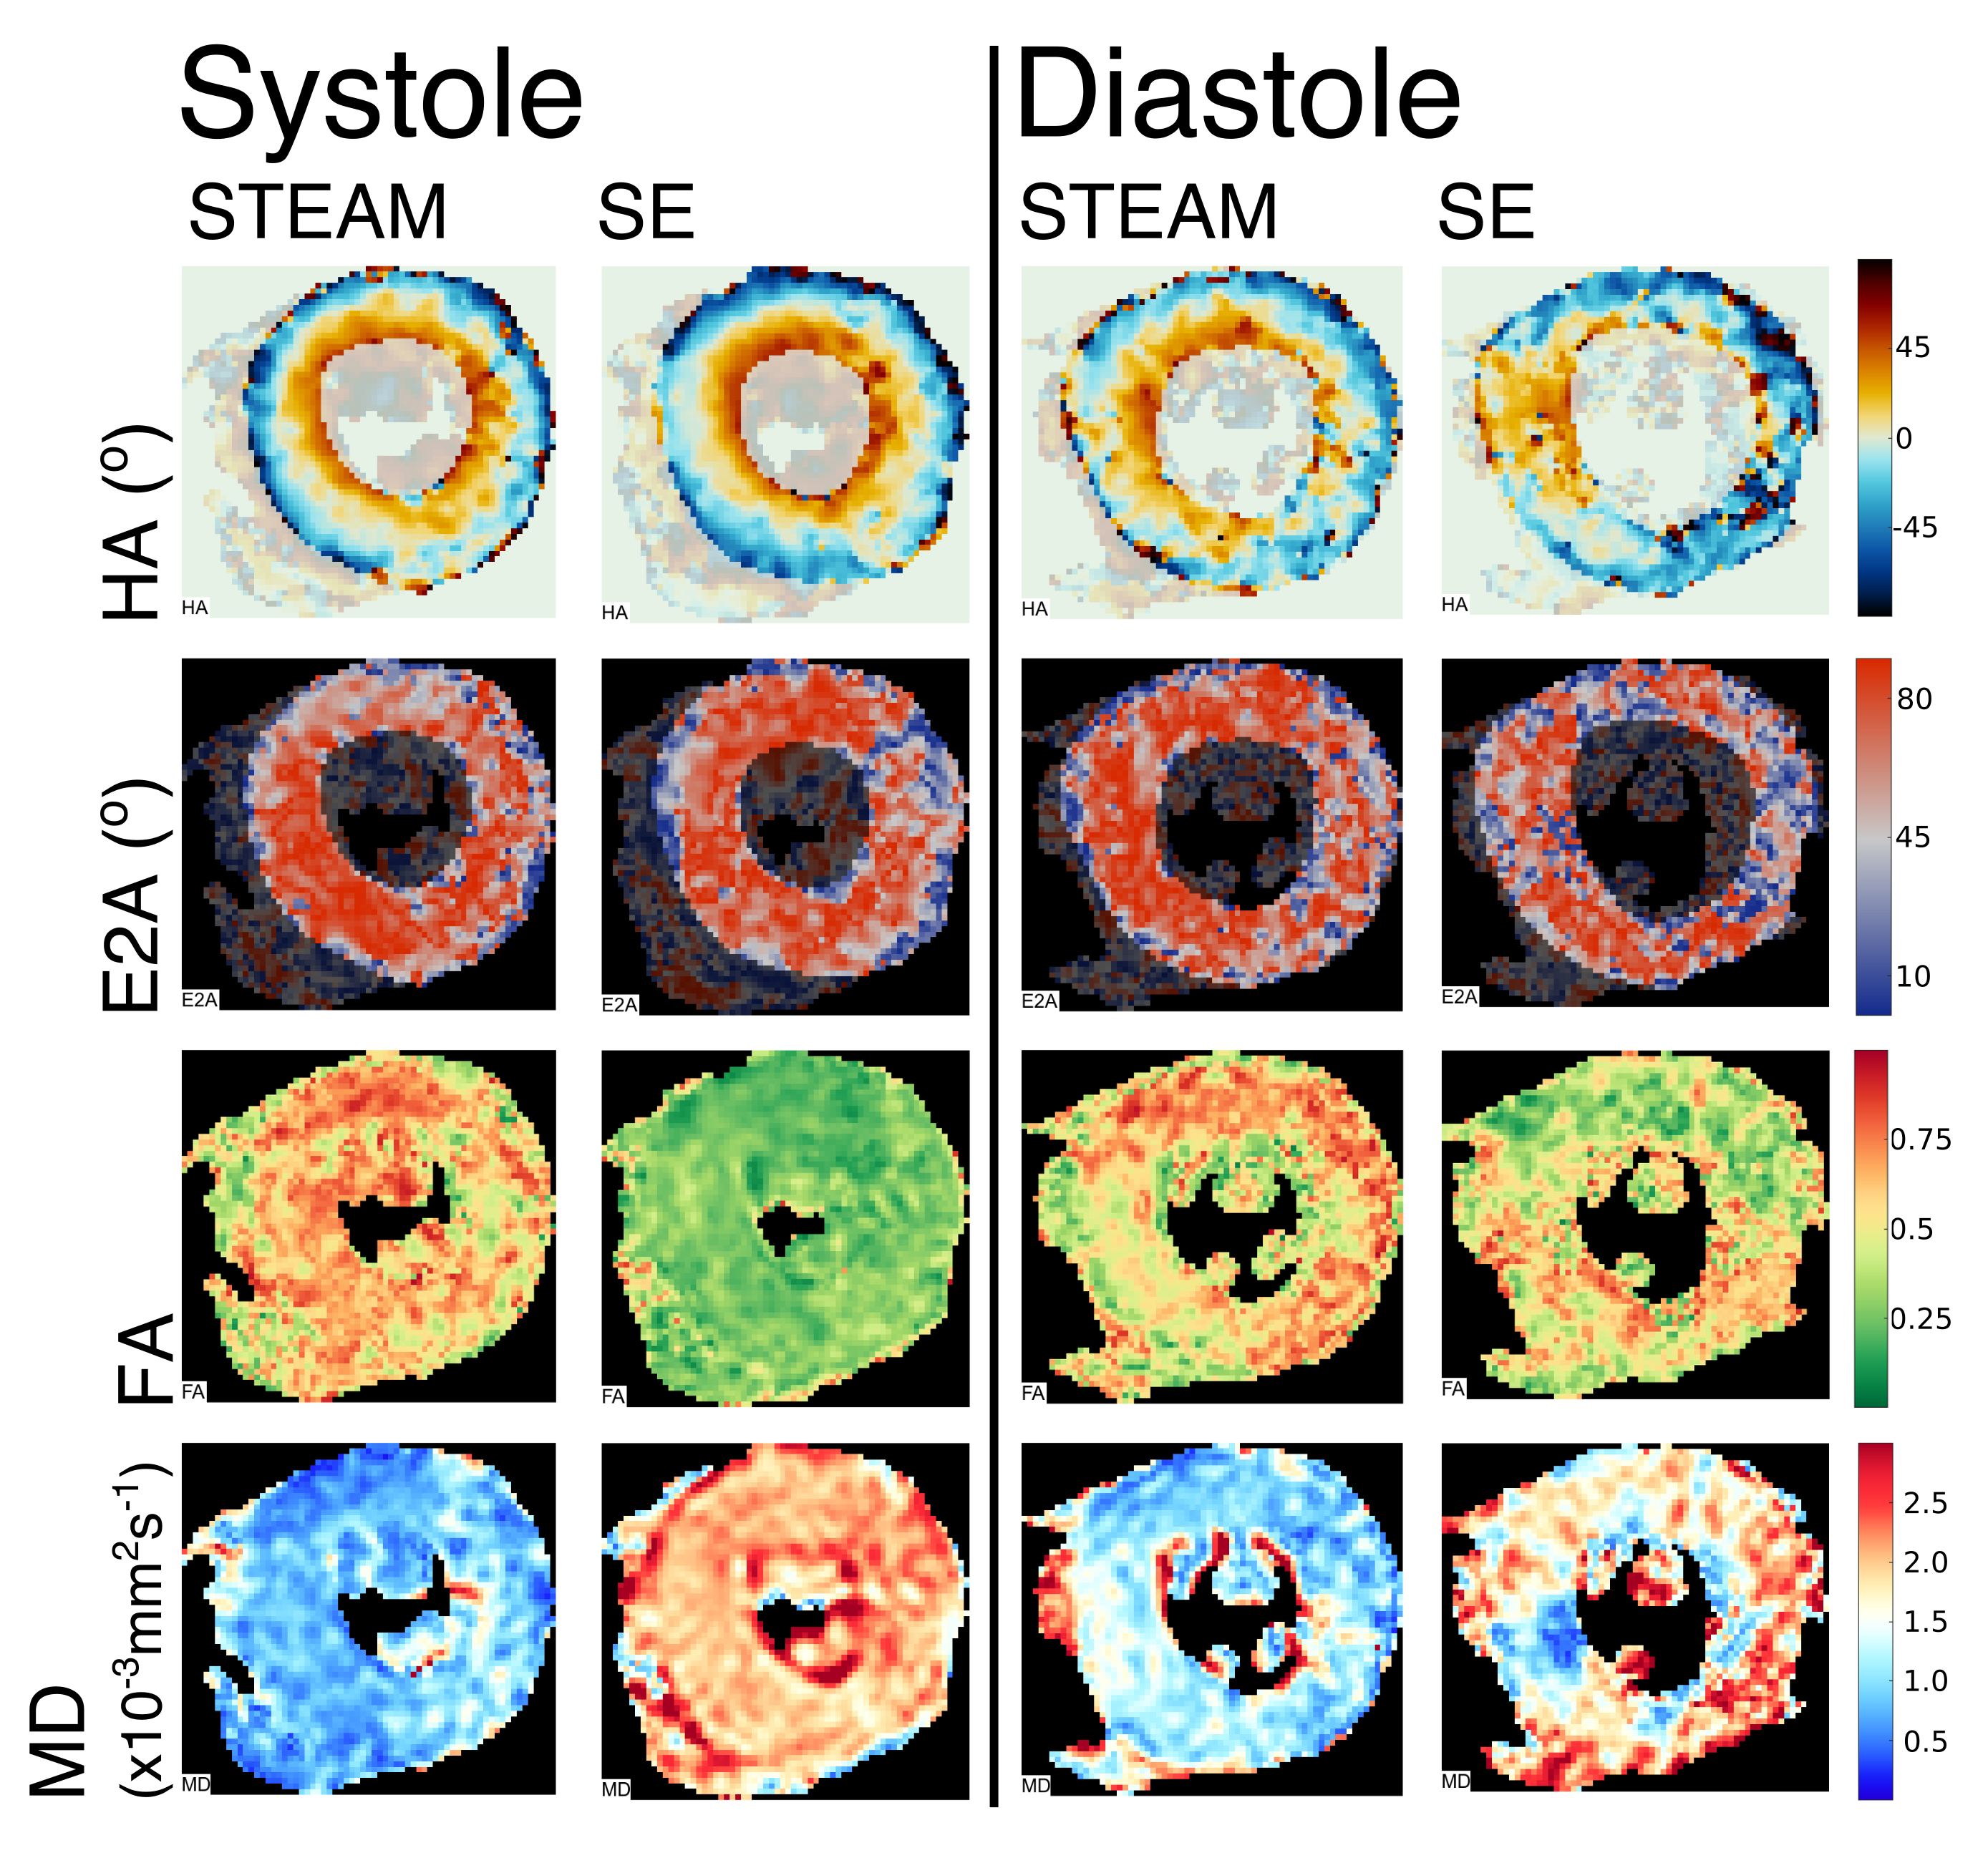
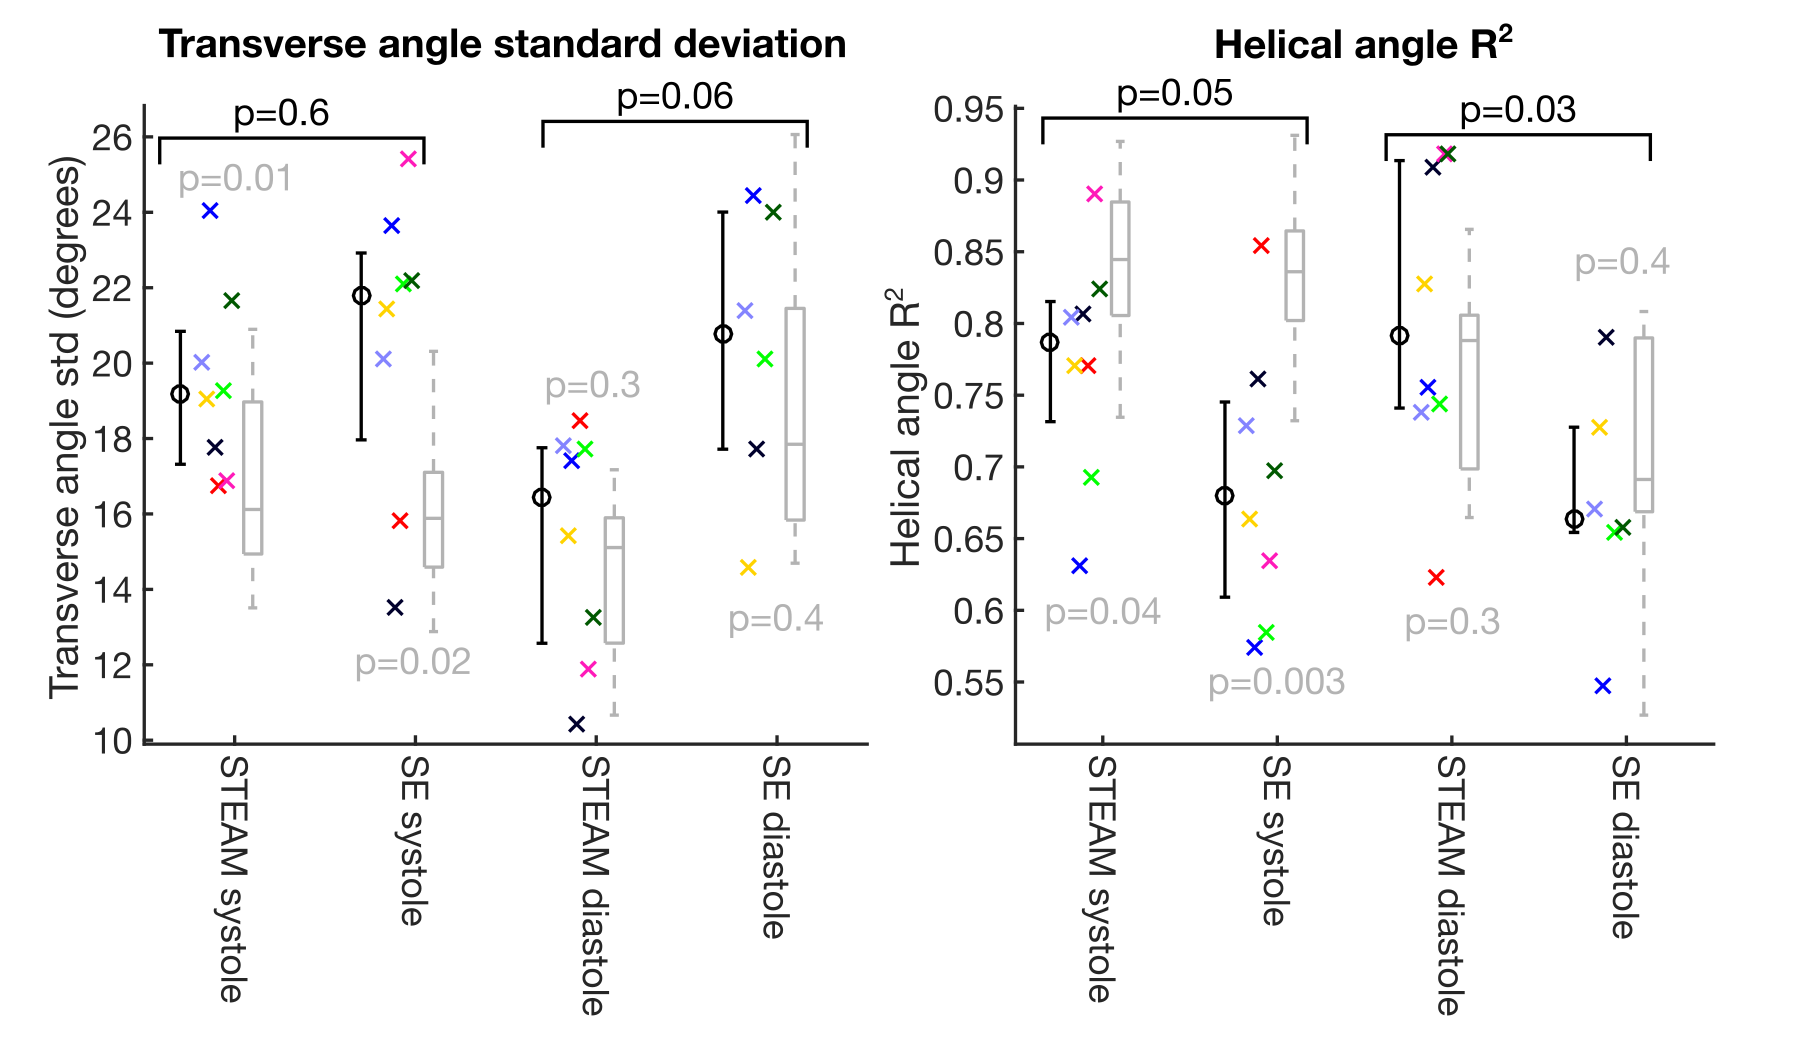
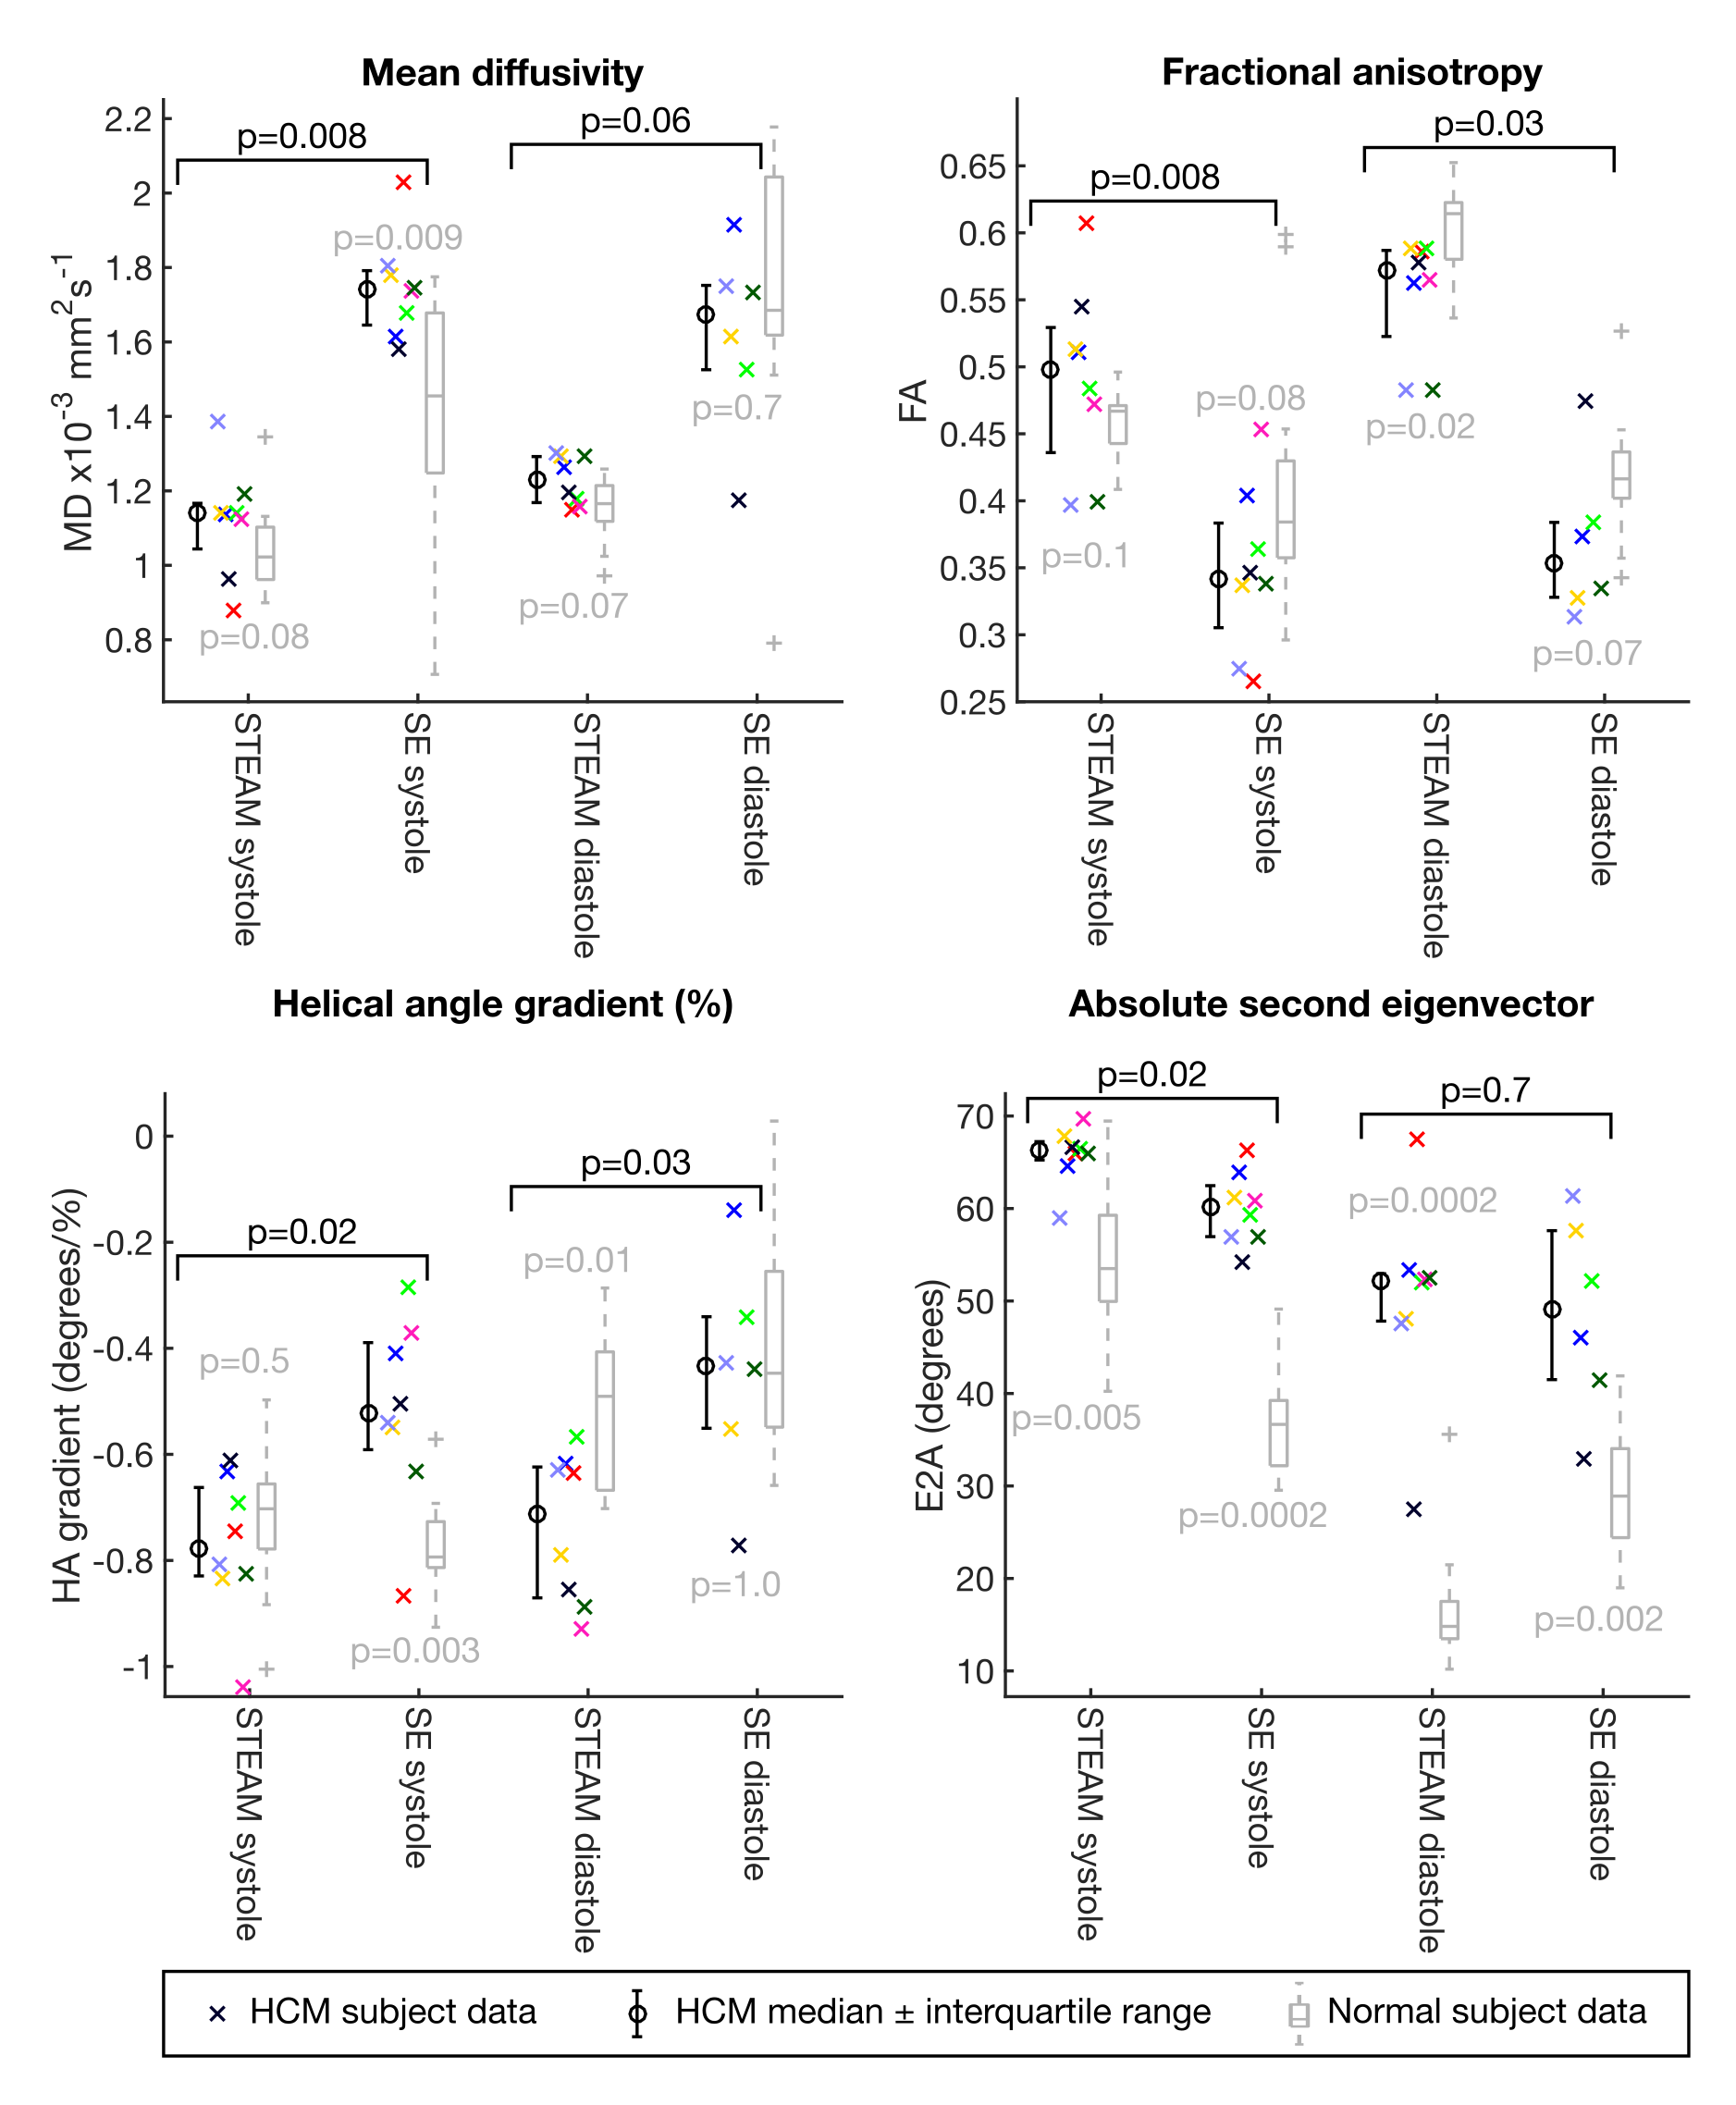
Patient demographics were five male, median age 63, [range 30-74 years]. Median maximum wall thickness was 20mm [16-31mm] and median ejection fraction was 77%. All patients had late gadolinium confirmed fibrosis in hypertrophied regions of myocardium. The median number of breath-holds required was 11 in SE and 10 in STEAM for systole and 14 for SE and 10 for STEAM in diastole. Subsequently on visual analysis, 2 SE diastole datasets were rejected due to poor-quality images as a result of mis-triggering and bulk motion signal loss. Figure 1 shows an example of good quality dual phase DT-CMR parameter maps, while figure 2 shows an example where poor quality SE diastole images due to variable duration of diastasis were rejected. Figure 3 plots the standard deviation of the transverse angle (TA) and R2 of the linear regression of helix angle (HA) with transmural depth, reflecting the reliability of the data. The HA R2 was significantly greater in STEAM acquisitions at both systole and diastole (p≤0.05). Table 1 summarises the left-ventricular DT-CMR parameters and Figure 4 plots these values alongside reference data for healthy volunteers. SE generated higher mean diffusivity (p=0.008 in systole) and lower fractional anisotropy (FA) values (both p<0.05) in both systole and diastole. HA gradient was steeper for STEAM (both p<0.05). There was no significant difference in diastolic E2A measurements derived from SE or STEAM, though both were significantly higher than the healthy reference values (p<0.01). In systole, E2A was greater when using STEAM (p=0.02) and both were significantly greater than normal reference values (p<0.01).Discussion
In this HCM cohort SE acquisitions required more breath-holds, were more susceptible
to mis-triggering and bulk motion signal loss leading to data rejection and reduced
confidence in the DT-CMR parameters. Whilst these factors may increase acquisition
duration, SE may be more broadly applicable, for example in patients with
arrhythmia.
An increase in MD and reduction in FA using SE is a consequence of the
shorter SE diffusion time and is consistent with a previous comparison in
healthy subjects5.
Both sequences were able to infer the failure of diastolic relaxation
known to exist in HCM, via an increased diastolic E2A3,4.
Both sequences are able to indicate a state of hypercontraction in systole, as
indicated by the higher E2A in HCM than in healthy volunteers, which is a
consequence of a more wall perpendicular sheetlet orientation in
systole3,4.
Conclusion
These findings demonstrate the ability of both sequence types to identify abnormal sheetlet arrangements throughout the cardiac cycle, suggesting that their use could be tailored to a spectrum of HCM patients e.g. use of SE in HCM patients with arrhythmias, or STEAM in patients who are able to hold their breath for more reliable results.Acknowledgements
This work was supported by the National Institute of Health Research Cardiovascular Biomedical Research Unit at the Royal Brompton Hospital and Imperial College, London.References
1. Reese TG, Weisskoff RM, Smith RN, et al. Imaging myocardial fiber architecture in vivo with magnetic resonance. Magn Reson Med. 1995;34(6):786-91.
2. Stoeck CT, von Deuster C, Genet M et al. Second-order motion-compensated spin echo diffusion tensor imaging of the human heart. Magn Reson Med. 2016;75(4):1669-76
3. Nielles-Vallespin S, Khalique Z, Ferreira P et al. Myocardial microstructural dynamics by in-vivo diffusion tensor
CMR: preclinical validation and clinical translation in DCM and HCM. J Am Coll Cardiol. 2016 - "in press"
4. Ferreira PF, Kilner PJ, McGill LA et al. In vivo cardiovascular magnetic resonance diffusion tensor imaging shows evidence of abnormal myocardial laminar orientations and mobility in hypertrophic cardiomyopathy. J Cardiovasc Magn Reson. 2014;16:87.
5. von
Deuster C, Stoeck CT, Genet M,
et al. Spin echo versus stimulated echo diffusion tensor imaging of the in vivo
human heart. Magn
Reson Med. 2016;76(3):862-72.
Figures