3102
Cine T1 Mapping: Look-Locker inversion recovery for phase resolved T1-Mapping with B1+ Correction At 3T1Electrical and Computer Engineering, University of Minnesota, Minneapolis, MN, United States, 2Center for Magnetic Resonance Research, University of Minnesota, Minneapolis, MN, United States, 3Computer Assisted Clinical Medicine, Heidelberg University, Mannheim, Germany, 4Department of Cardiology, University of Minnesota, Minneapolis, MN, United States
Synopsis
Conventionally, evaluation of myocardial T1-times is limited to a single snapshot of the cardiac cycle, leaving much of the dependence between functional and tissue characterization unstudied. Here, we propose an ECG-triggered steady-state Look-Locker technique that allows for functional, cardiac phase-resolved native T1-mapping. Integratedly acquired phase-resolved B1+-maps are used for T1-time correction. High accuracy and good consistency of the T1-times across cardiac phases is shown in phantom scans. In-vivo T1-times show slight underestimation and similar precision compared to saturation-recovery T1-mapping. High visual image quality at all cardiac phases is obtained at temporal resolutions up to 40ms in a single breath-hold.
Background
Quantitative assessment of myocardial T1-mapping has potential for characterizing the staging of various cardiomyopathies1. However, its variation through the cardiac cycle remains largely unstudied. Commonly-used myocardial T1-mapping techniques employ single-shot imaging, limiting temporal resolution to a single-snapshot of the cardiac cycle, typically during diastolic quiescence2. Initial studies using systolic imaging have indicated variations in T1-time3,4. Temporally-resolved quantitative assessment of T1-times at different cardiac phases may provide integrated functional and quantitative information. This may improve depiction of subtle lesions and reveal information in presence of abnormal contractility, e.g. in restrictive cardiomyopathy or restrictive pericarditis5. In this study, we sought to develop a steady-state Look-Locker imaging sequence for cardiac phase-resolved myocardial T1-mapping in a single breath-hold, while compensating for transmit field inhomogeneities.Methods
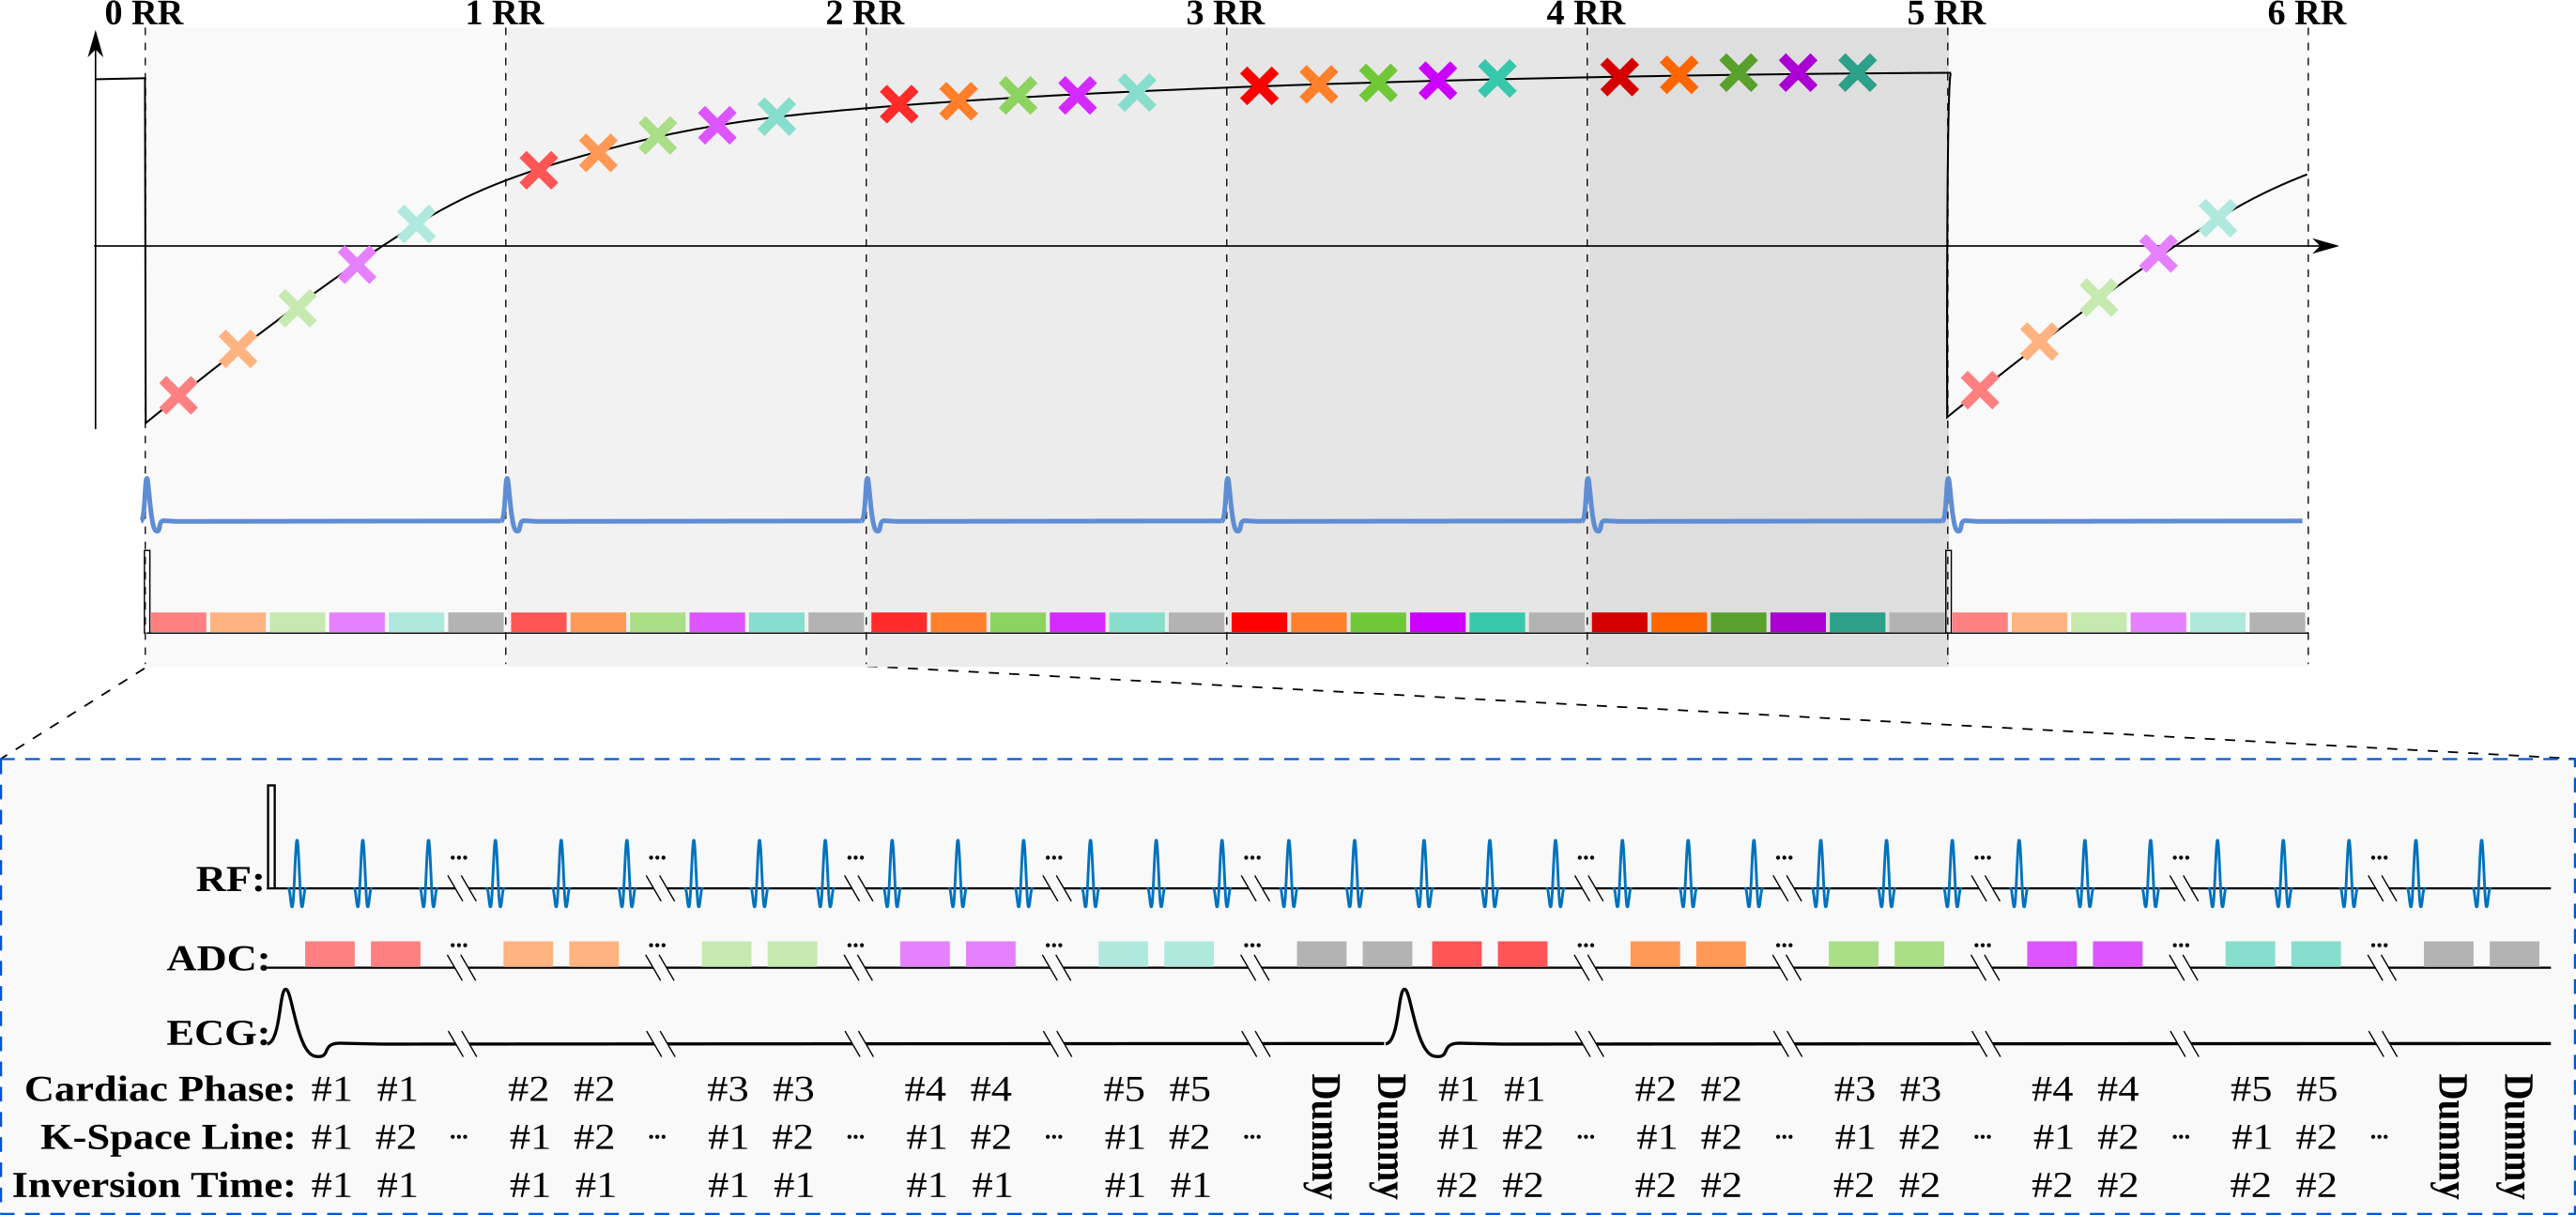
Sequence: In the proposed Look-Locker CINE (LLCine) sequence, T1-quantification is based on magnetization readout during the approach to pulsed steady-state. Initially, magnetization is driven to steady-state using FLASH excitations, and an inversion pulse is applied (Fig. 1). Then imaging pulses are played continuously, while the pulsed inversion-recovery curve is sampled with segmented k-space sampling for each cardiac phase. After reaching steady-state again, magnetization is re-inverted, and the next k-space segment is acquired. This recovery to pulsed steady-state spans several heartbeats. Hence, multiple time points on the inversion-recovery curve are sampled, allowing for spatially- and temporally-resolved quantification of T1-time throughout cardiac cycle. Dummy pulses without signal acquisition fill the end of cardiac cycles after acquiring the last cardiac phase, to maintain pulsed steady-state, and minimize effects of R-R interval variability. Reconstruction: Apparent relaxation during continuous FLASH excitations is described6 by T1*
$$M_z(t)=M_0\left(1–B\cdot e^{-\frac{t}{T_1^*}}\right)$$ $$B=1-\cos(\alpha_{inv})$$ $$\frac{1}{T_1^*} = \frac{1}{T_1} - \frac{\log( \cos( \alpha ) ) }{T_R}$$
Hence, actual T1 can be derived from this sequence, given TR and excitation flip angle (FA). Efficiency of the rectangular inversion pulse (B in Eq. 2 above) can be used to estimate B1+-inhomogeneities and calculate the actual FA as:
$$\frac{\alpha}{\alpha^{nom}}\approx\frac{\alpha_{inv}}{\alpha_{inv}^{nom}}$$ $$T_1=\left(\frac{1}{T_1}-\frac{\log(\cos(\frac{\arccos(1-B)}{\alpha_{inv}^{nom}}\cdot\alpha_{nom}))}{T_R}\right)^{-1}$$
Numerical Simulations: The conditioning of extracting T1 from T1* depends on TR and FA. Numerical simulations were performed to minimize T1-error sensitivity by optimizing these two parameters. Bloch-simulations for the proposed sequence were performed for TR=3.5,4, …15.0ms and FA=1°,2°,...20°. T1-times were then calculated from 1000 noisy simulations, and evaluated for accuracy and precision at all parameter values. Imaging: All imaging was performed at 3T (Siemens Magnetom Prisma) and the following imaging parameters were used in the remainder of the study: TR/TE/FA=5/2.5ms/3°, FOV=300x300mm2, resolution=1.9x1.9mm2, slice thickness=10mm, temporal resolution=40-60ms, breath-hold duration=19-23s. SAPPHIRE T1-mapping7 was performed for comparison. Phantom imaging was performed to test T1-mapping accuracy, and consistency of the T1 estimate across the cardiac phases. In-vivo imaging of a mid-ventricular short-axis slice was performed on 10 healthy subjects (4male, 32±15y/o). T1-times were evaluated using septal ROIs drawn for each cardiac phase. In-vivo precision was defined as T1-time variation within the ROIs.
Results
Numerical simulations indicate diminished precision and accuracy for short TR and high FA, both causing rapid apparent relaxation. T1-precision is also compromised with low FA due to insufficient signal. Optimal T1-sensitivity, at breath-hold scan-times was achieved at TR/FA=5ms/3°.
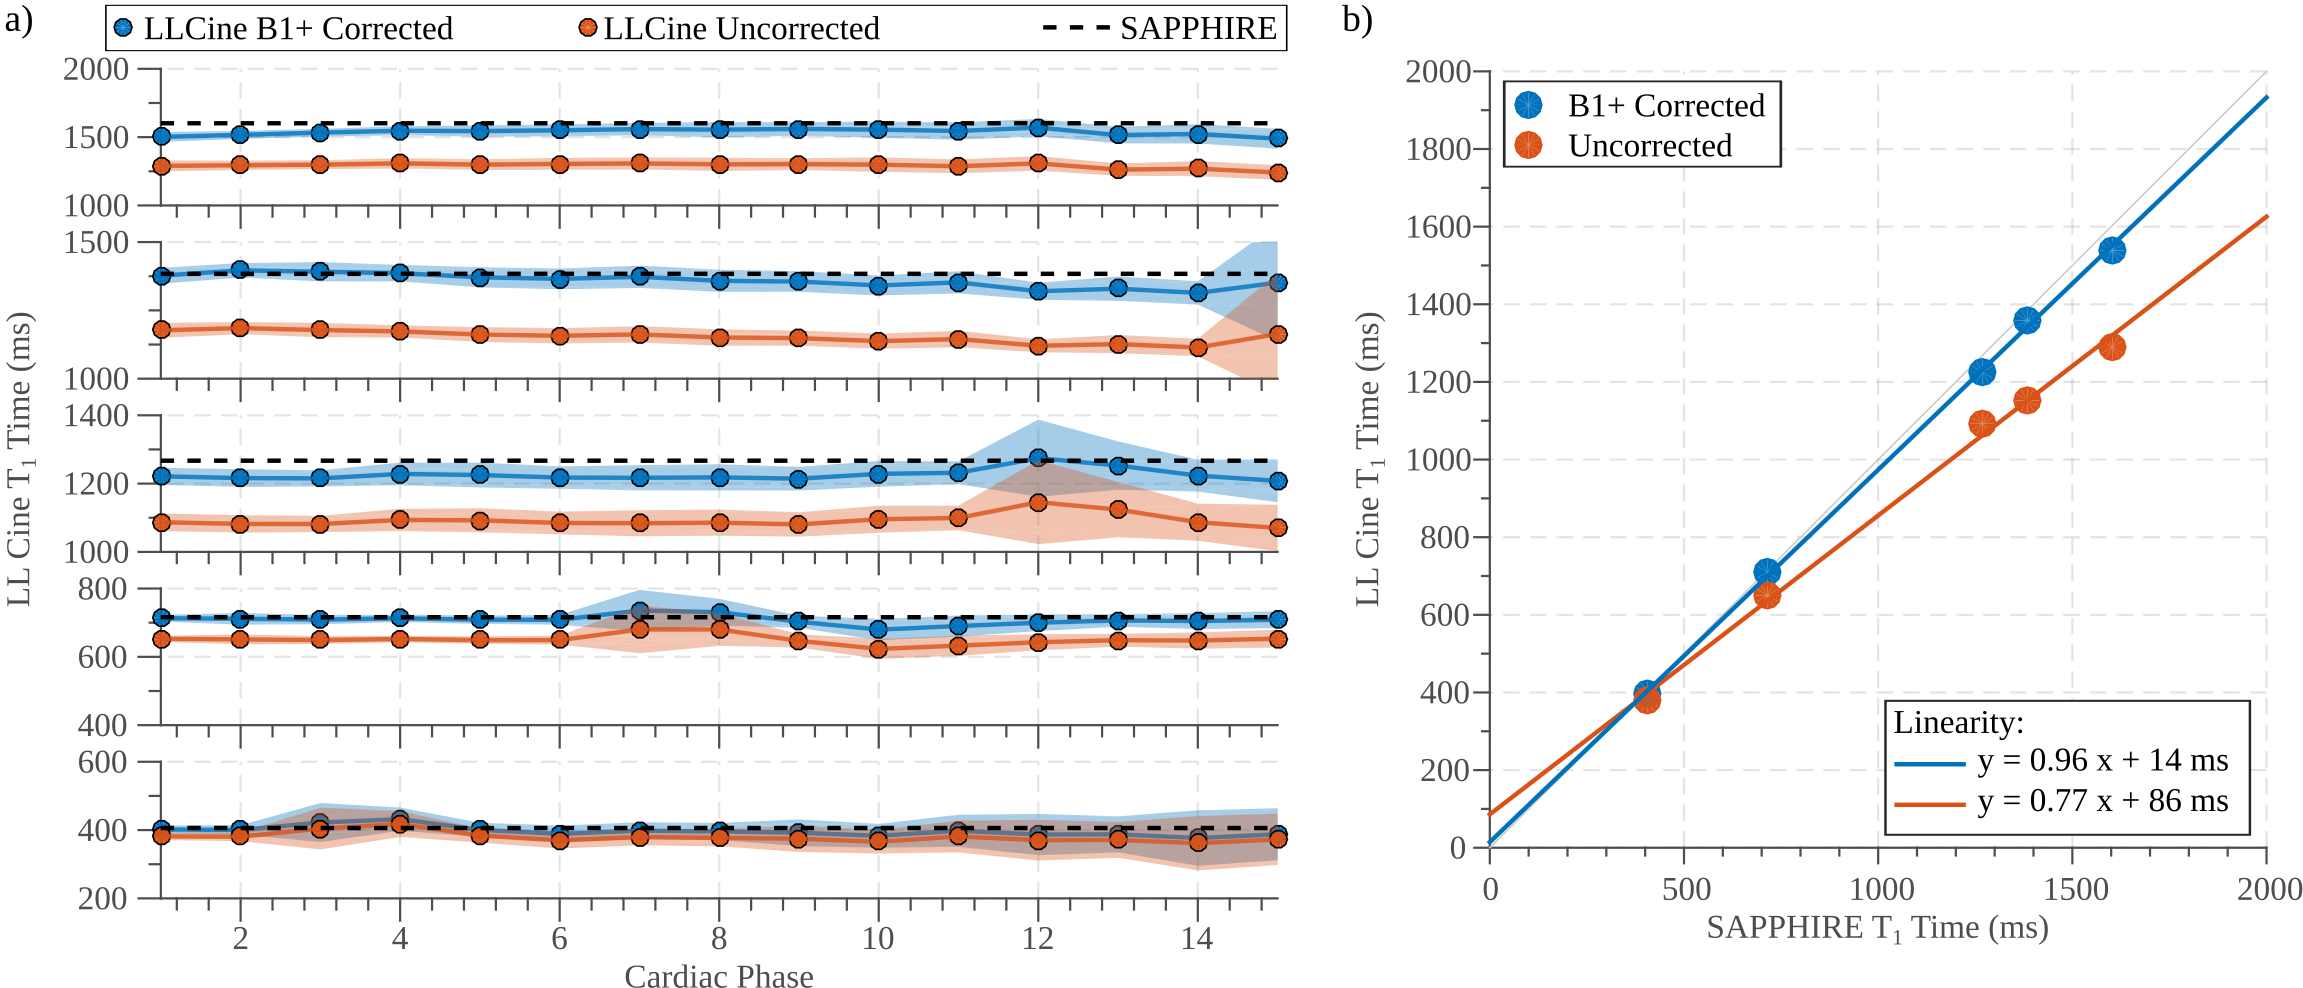
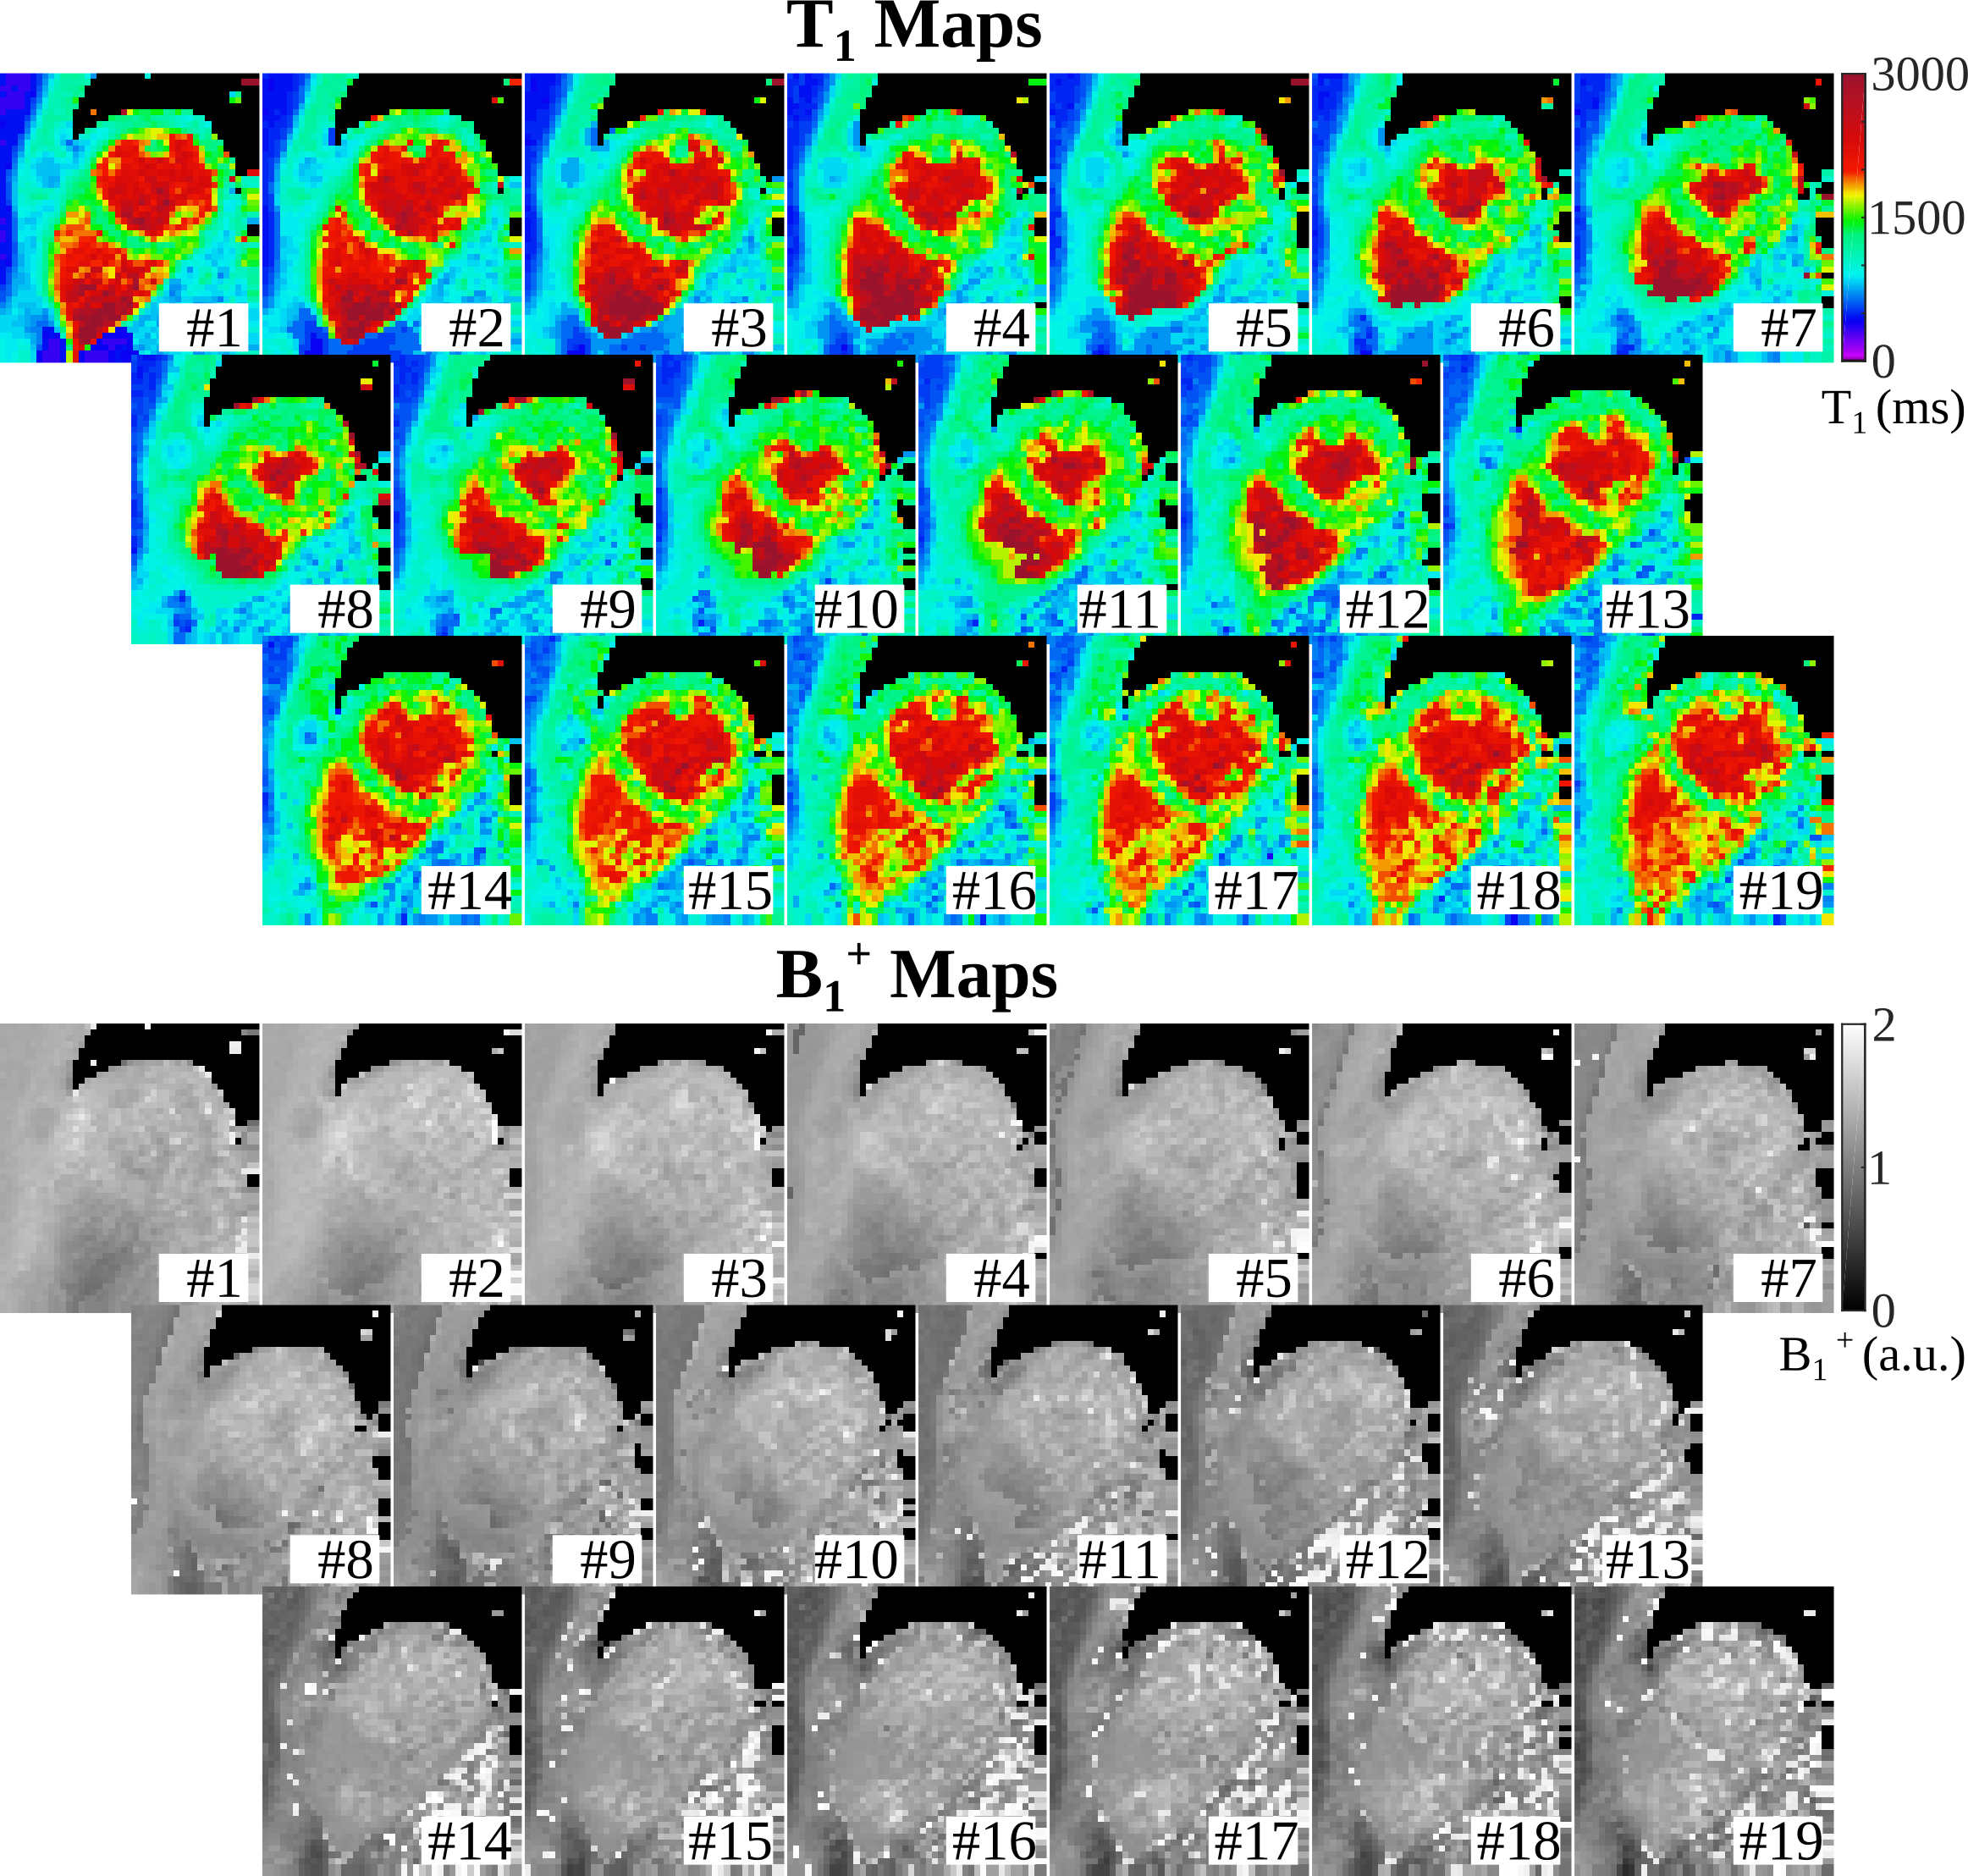
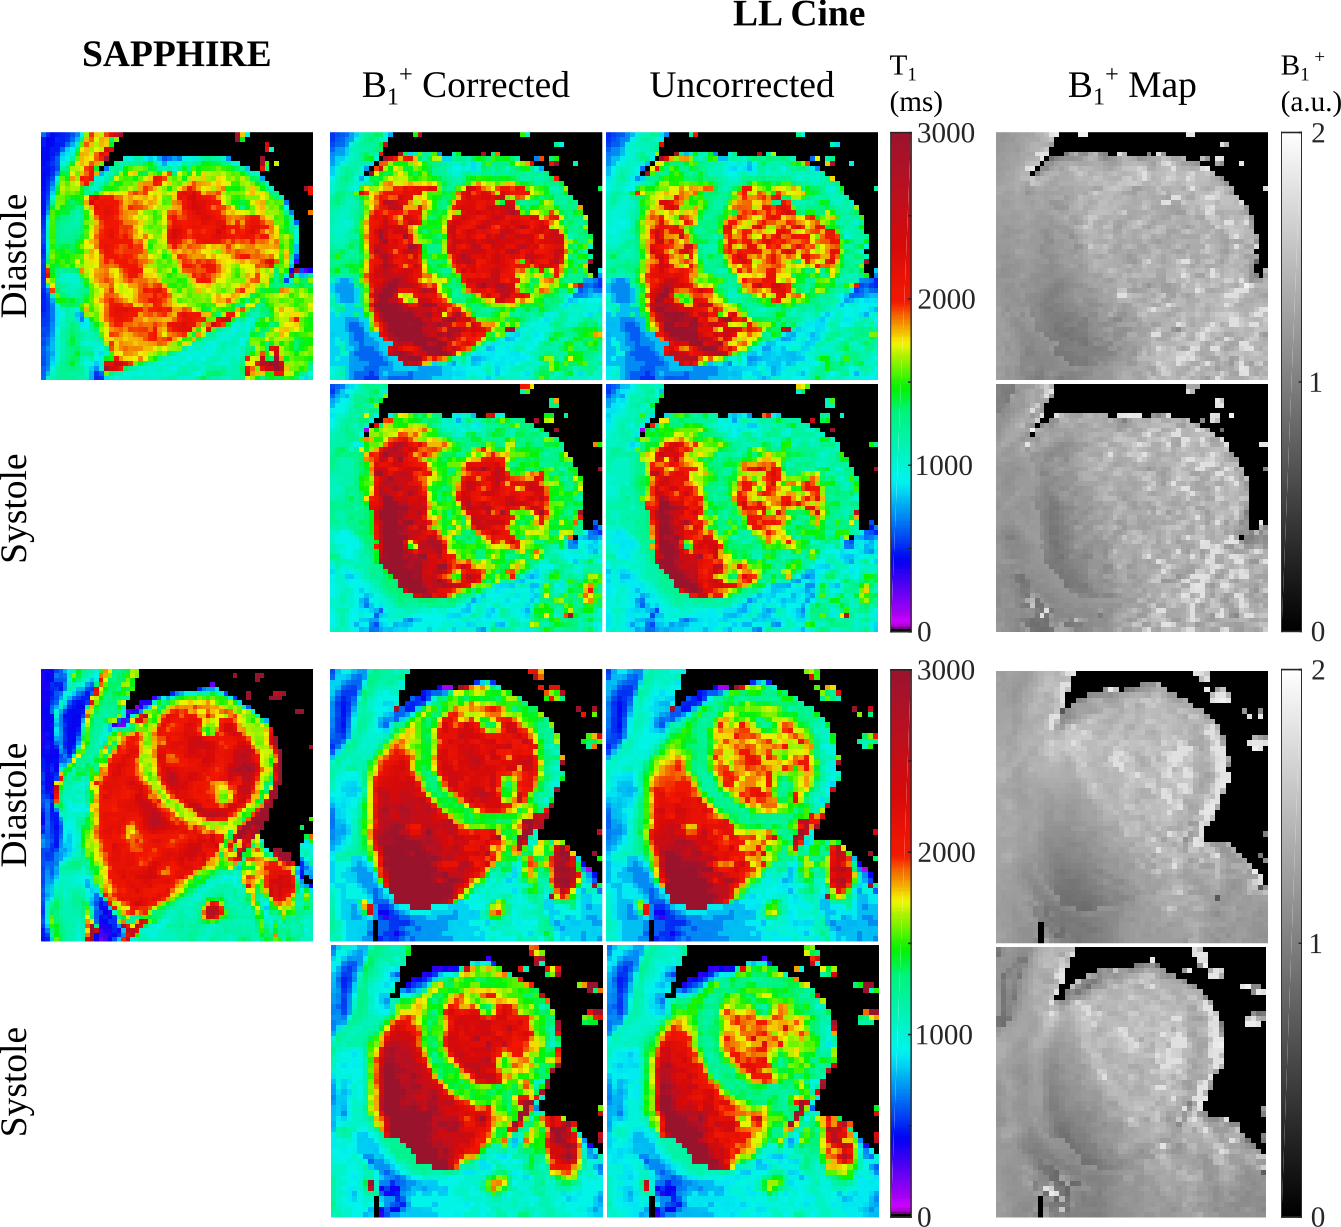
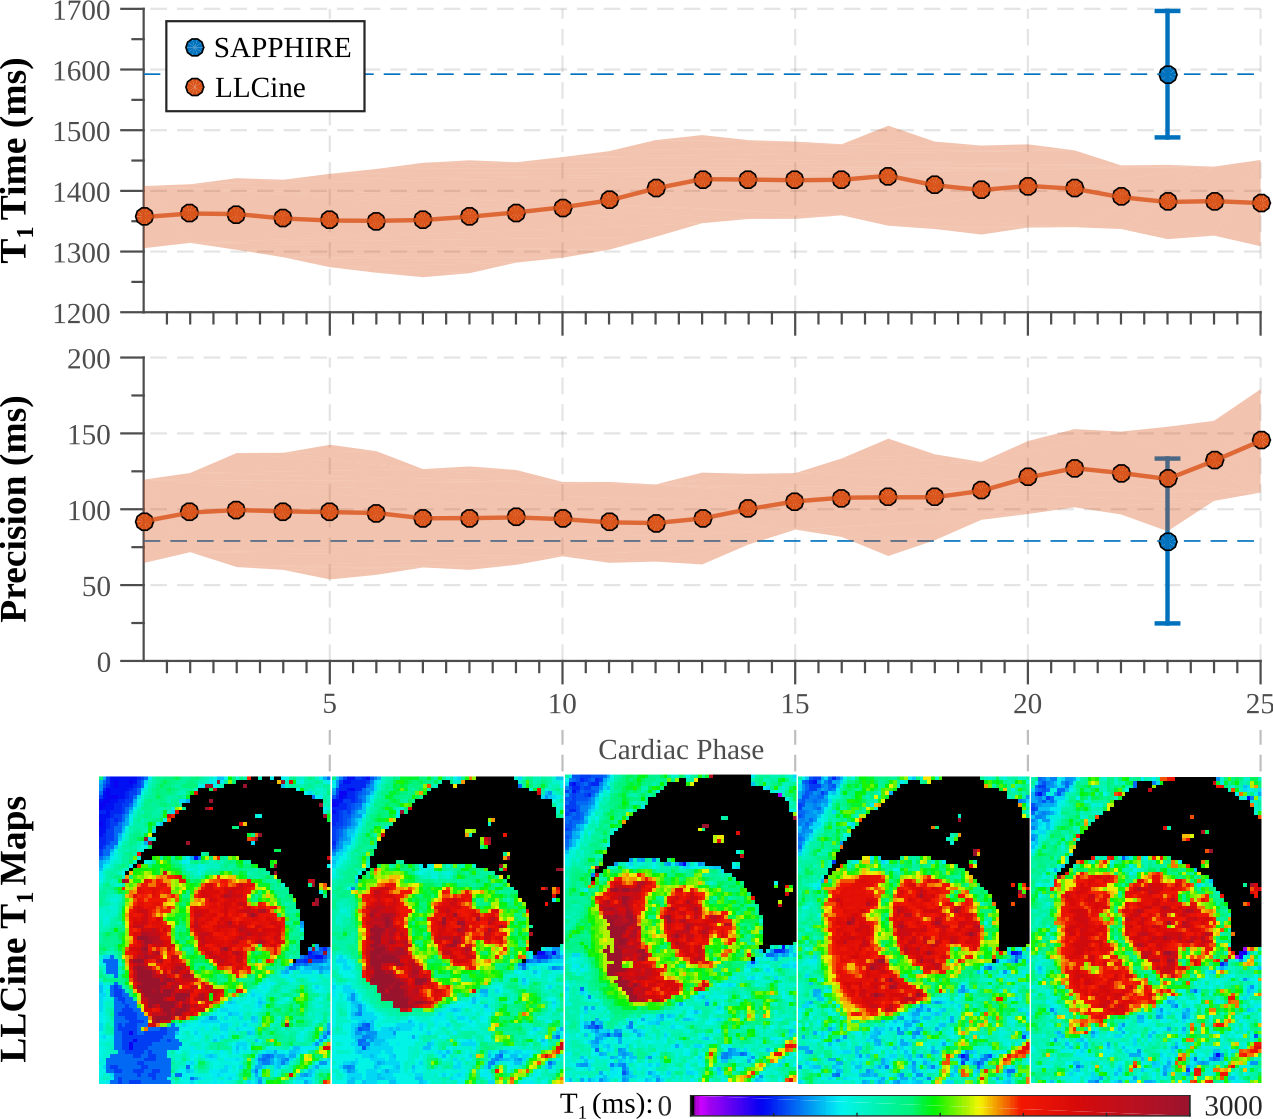
In phantom experiments (Fig. 2), LLCine is in good agreement with SAPPHIRE T1-mapping (NRMSE=3.1%) and highly consistent across phases (Coefficient-of-Variation (CoV)=2.1±0.9%). In-vivo T1-maps display a high level of homogeneity in the myocardium and good delineation towards the blood pool at all phases (Fig. 3). In-vivo T1-times after B1+-correction fall into the expected range at 3T, while uncorrected T1-maps exhibit underestimation (Fig. 4). Minor variations of the in-vivo T1-times are observed throughout the cardiac cycle (CoV=1.9%). In-vivo precision is comparable to SAPPHIRE T1-mapping, with slightly higher variability at late diastolic phases. B1+-maps generated by the proposed approach are visually homogeneous and largely T1-insensitive, with increased variability towards the end of cardiac cycle.
Discussion and Conclusion
This study demonstrates the feasibility of cardiac phase-resolved T1-mapping at temporal resolutions as fine as 40ms in a single breath-hold. The integrated phase-resolved B1+-maps were leveraged to correct for flip-angle deviations, in order to maximize accuracy.
The sequence parameters were numerically optimized for the expected T1 range at 3T. Hence, if tissue with T1-times other than native myocardium, e.g. post-contrast, is to be evaluated, a dedicated parameter optimization should be performed to allow for adequate recovery durations and accuracy.
In the proposed sequence, sample-points on the inversion-recovery curve are dependent on cardiac phase. Later cardiac phases lack acquisition of short inversion times, hence increased in-vivo variability was observed. However, since myocardium remains largely stationary during diastolic quiescence, temporal acquisition/reconstruction window can be increased in later phases, for improving SNR to mitigate this effect.
Acknowledgements
The project described was supported by NIH R00HL111410 and NIH P41EB015894.References
1. Jellis CL, Kwon DH. "Myocardial T1 mapping: modalities and clinical applications." Cardiovasc Diagn Ther. 2014 Apr;4(2):126-37.
2. Higgins DM, Moon JC. "Review of T1 Mapping Methods: Comparative Effectiveness Including Reproducibility Issues." Curr Cardiovasc Imaging Rep (2014) 7: 9252.
3. Ferreira VM, Wijesurendra RS, Liu A, Greiser A, Casadei B, Robson MD, Neubauer S, Piechnik SK. "Systolic ShMOLLI myocardial T1-mapping for improved robustness to partial-volume effects and applications in tachyarrhythmias." J Cardiovasc Magn Reson. 2015 Aug 28;17:77.
4. Reiter U, Reiter G, Dorr K, Greiser A, Maderthaner R, Fuchsjäger M. "Normal diastolic and systolic myocardial T1 values at 1.5-T MR imaging: correlations and blood normalization." Radiology. 2014 May;271(2):365-72.
5. Hamlin SA, Henry TS, Little BP, Lerakis S, Stillman AE. "Mapping the future of cardiac MR imaging: case-based review of T1 and T2 mapping techniques." Radiographics. 2014 Oct;34(6):1594-611.
6. Kaptein R, Dijkstra K, Tarr CE. “A single-scan Fourier transform method for measuring spin-lattice relaxation times.” J Magn Reson 1976; 24:295-300
7. Weingärtner S, Akçakaya M, Basha T, Kissinger KV, Goddu B, Berg S, Manning WJ, Nezafat R. "Combined saturation/inversion recovery sequences for improved evaluation of scar and diffuse fibrosis in patients with arrhythmia or heart rate variability." Magn Reson Med. 2014 Mar;71(3):1024-34.
Figures