3101
Improving precision of myocardial T1 mapping with 3-parameter fit model using tissue characteristic-based denoising1Department of Medicine, Beth Israel Deaconess Medical Center and Harvard Medical School, Boston, MA, United States, 2Department of Computer Science, Technical University of Munich, Munich, Germany
Synopsis
For the reconstruction of pixel-wise T1 maps, 3-parameter fit model is highly accurate, but is sensitive to noise. Therefore, it is desirable to develop a robust method to reduce sensitivity to noise when 3-parameter fit model is used. In this work, we propose a robust denoising method based on tissue characteristics to improve precision of myocardial T1 mapping. In phantom and in-vivo studies, denoising filtering provided similar T1 measurements with significantly improved precision. This technique will make 3-parameter fit model more favorable by reducing sensitivity to noise and will allow for more accurate and precise myocardial T1 mapping.
Purpose
Myocardial T1 mapping is a promising technique for detection of interstitial fibrosis.1 To estimate T1 time in each pixel, a set of T1-weighted images is acquired and fit to a physical model of the longitudinal magnetization recovery curve.2 Depending on the number of parameters when fitting the exponential signal, 2- or 3-parameter model fitting can be performed. 3-parameter fit model is highly accurate, but sensitive to noise.3 To reduce this sensitivity to noise, most T1 mapping techniques employ a 2-parameter fit model at the expense of accuracy. Therefore, it is desirable to develop a robust method to reduce sensitivity to noise when 3-parameter fit model is used. In this work, we propose a robust denoising method based on tissue characteristics, to improve precision of T1 mapping.Methods
Tissue characteristic-based denoising
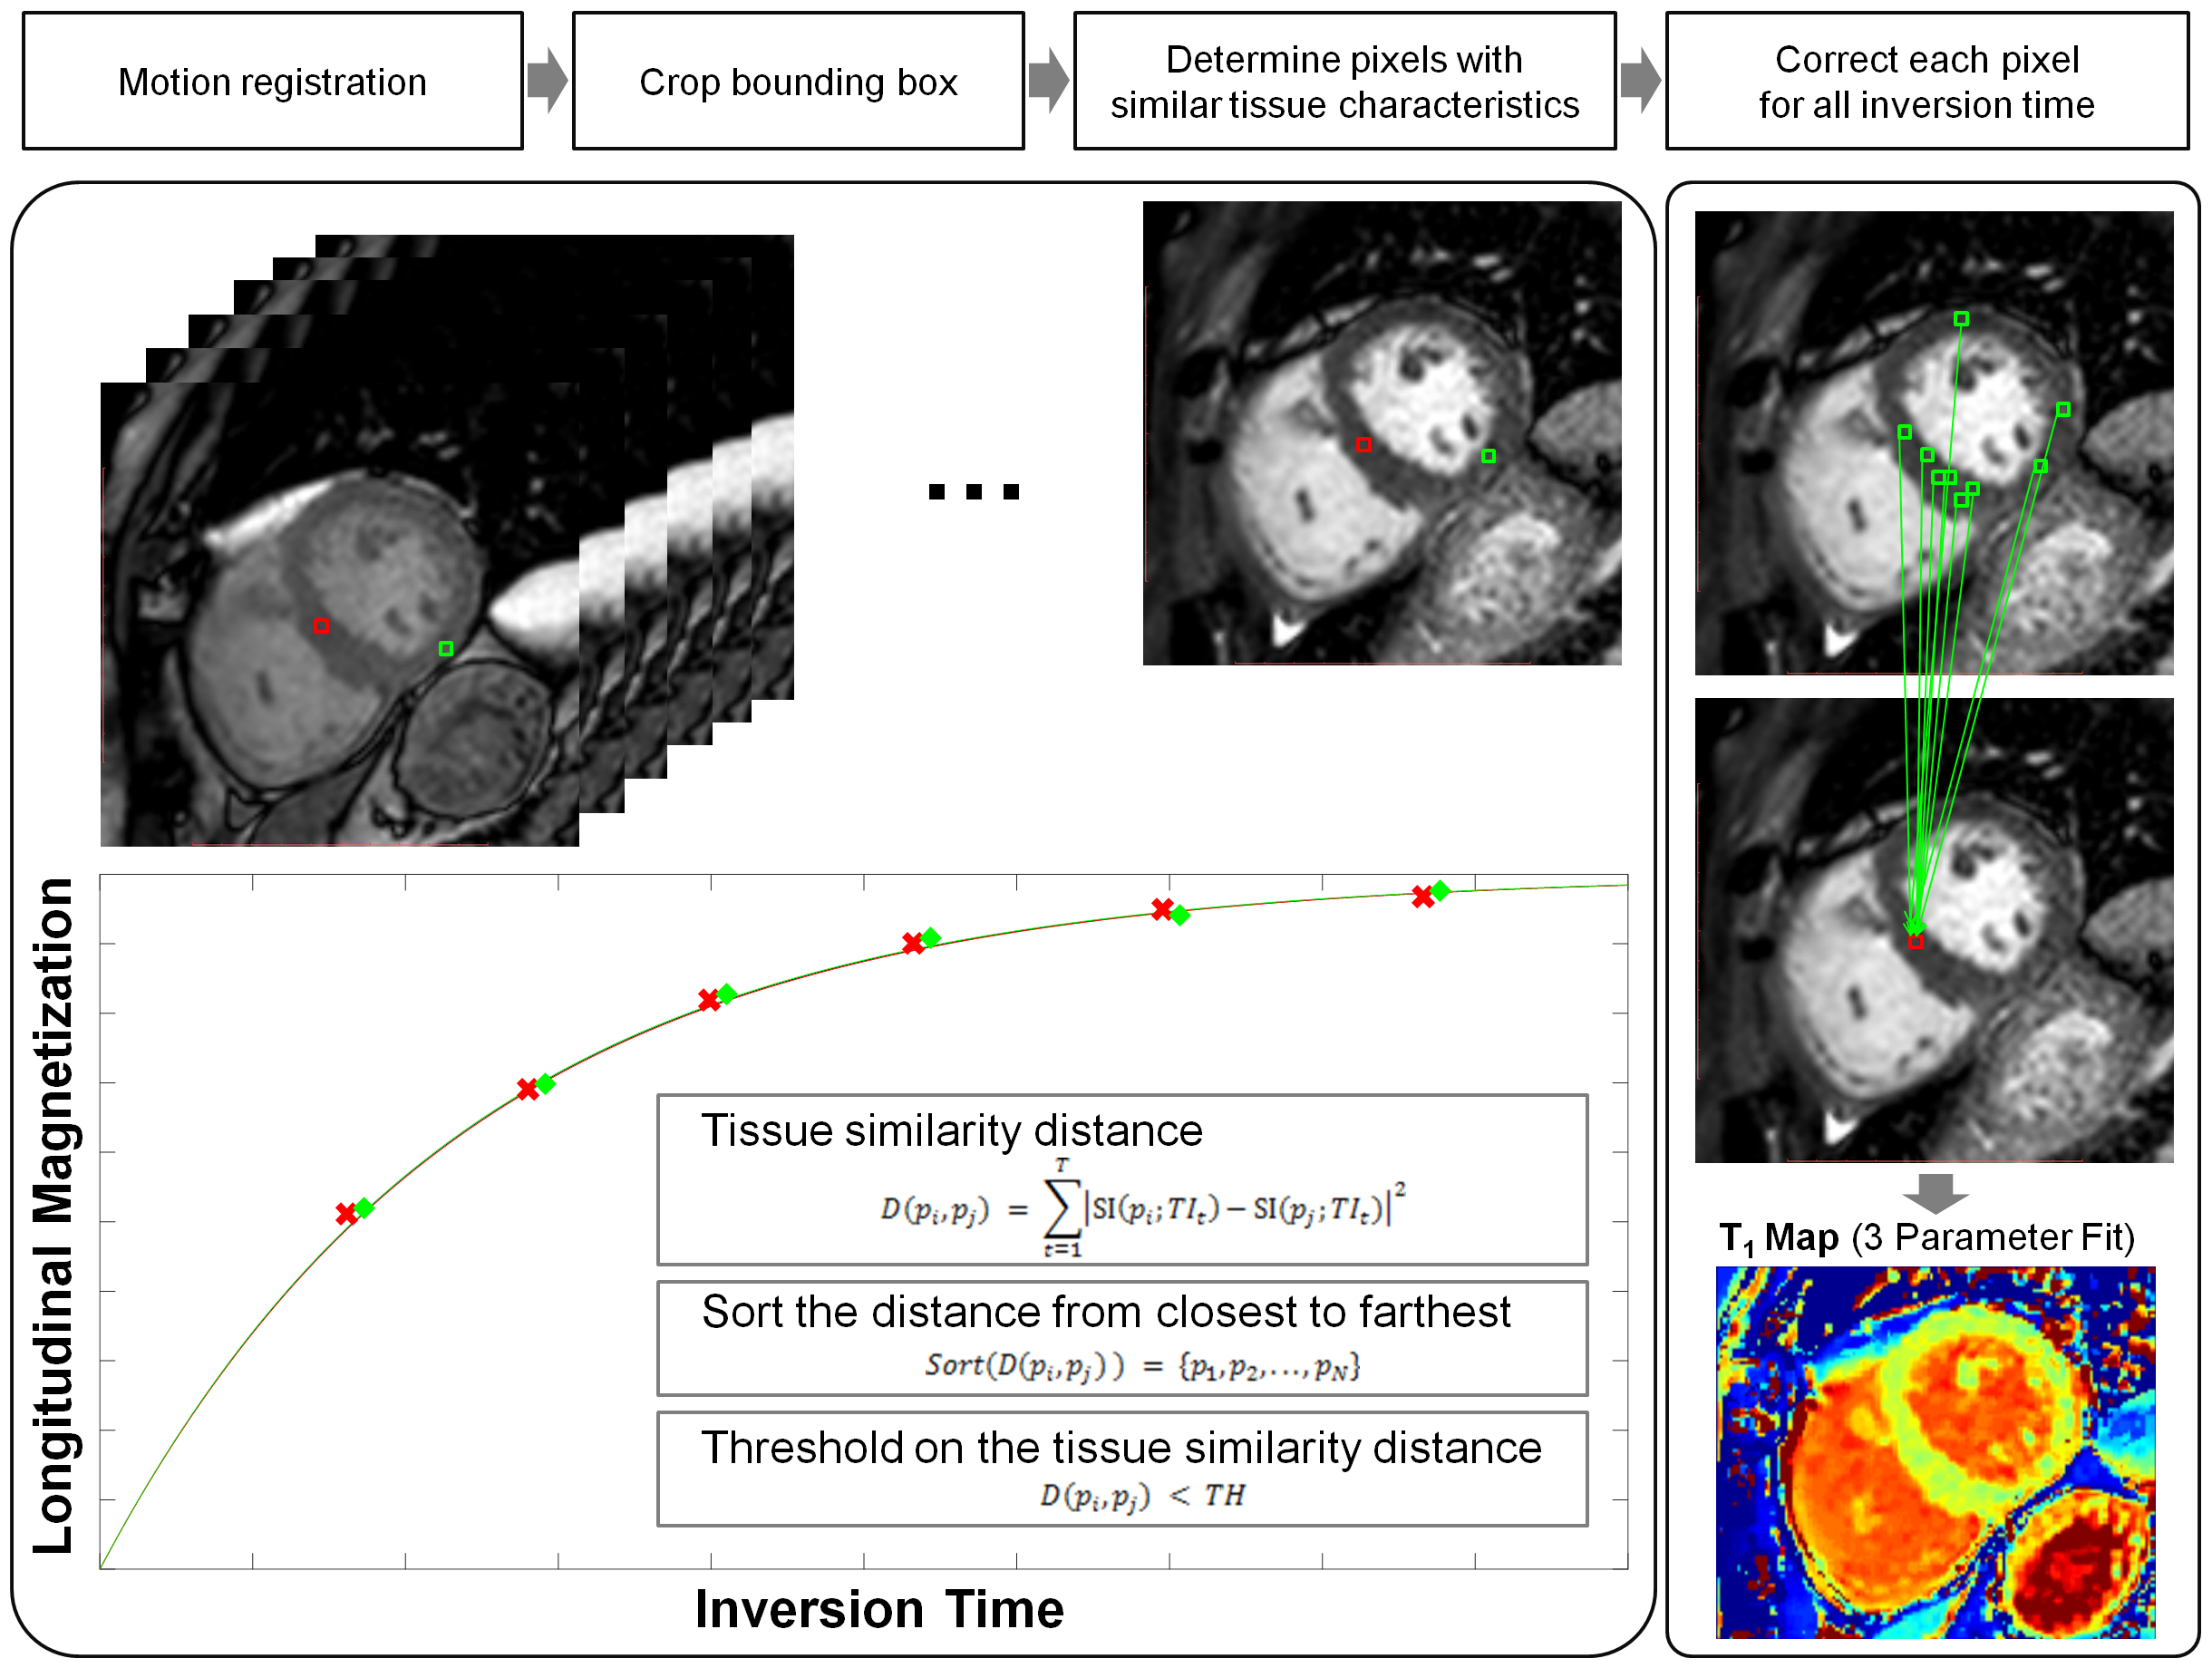
A set of T1-weighted images was first corrected for in-plane motion using adaptive registration of varying contrast-weighted images,4 followed by cropping the bounding box of the region-of-interest (ROI). For all pixels over all five slices, the tissue characteristic similarity distance (D)5 was then calculated by the sum over all inversion time (TI) of squared differences between two pixel intensities at the same inversion time as follows.
$$D(p_i,p_j) = \sum_{t=1}^{T} |SI(p_i; TI_t) - SI(p_j; TI_t)|^2$$
Tissue similarity distance was then sorted from the closest to farthest, and the closest N pixels were taken for filtering.
$$Sort(D(p_i,p_j)) = \{p_1,p_2, ... , p_N\}$$
To ensure all pixels in the denoising process to have close tissue distance, an additional threshold (TH) constraint on the tissue similarity distance was applied.
$$D(p_i,p_j) < TH$$
All pixels taken from the previous process were then averaged and used to replace each pixel in the T1-weighted images at each inversion time. N and threshold were empirically decided based on the number of pixels in the ROI and the squared signal difference between the signal at the longest and the shortest TI. Finally, T1 map was reconstructed using a 3-parameter model fitting on the denoised signal. A schematic of the proposed denoising method for improved precision T1 mapping is summarized in Fig 1.
CMR image acquisition
10 patients referred for CMR were scanned on a Philips 1.5T Achieva scanner. Slice-interleaved T1 mapping sequence6 was acquired with prospective slice tracking7 with the following imaging parameters: b-SSFP imaging readout, 5 slices, TR/TE/α=2.7/1.37ms/70˚, FOV=360×352mm2, voxel size=2.1×2.1mm2, slice thickness=8mm, number of phase-encoding lines=86, linear ordering, 10 linear ramp-up pulses, SENSE factor=2.
Phantom study
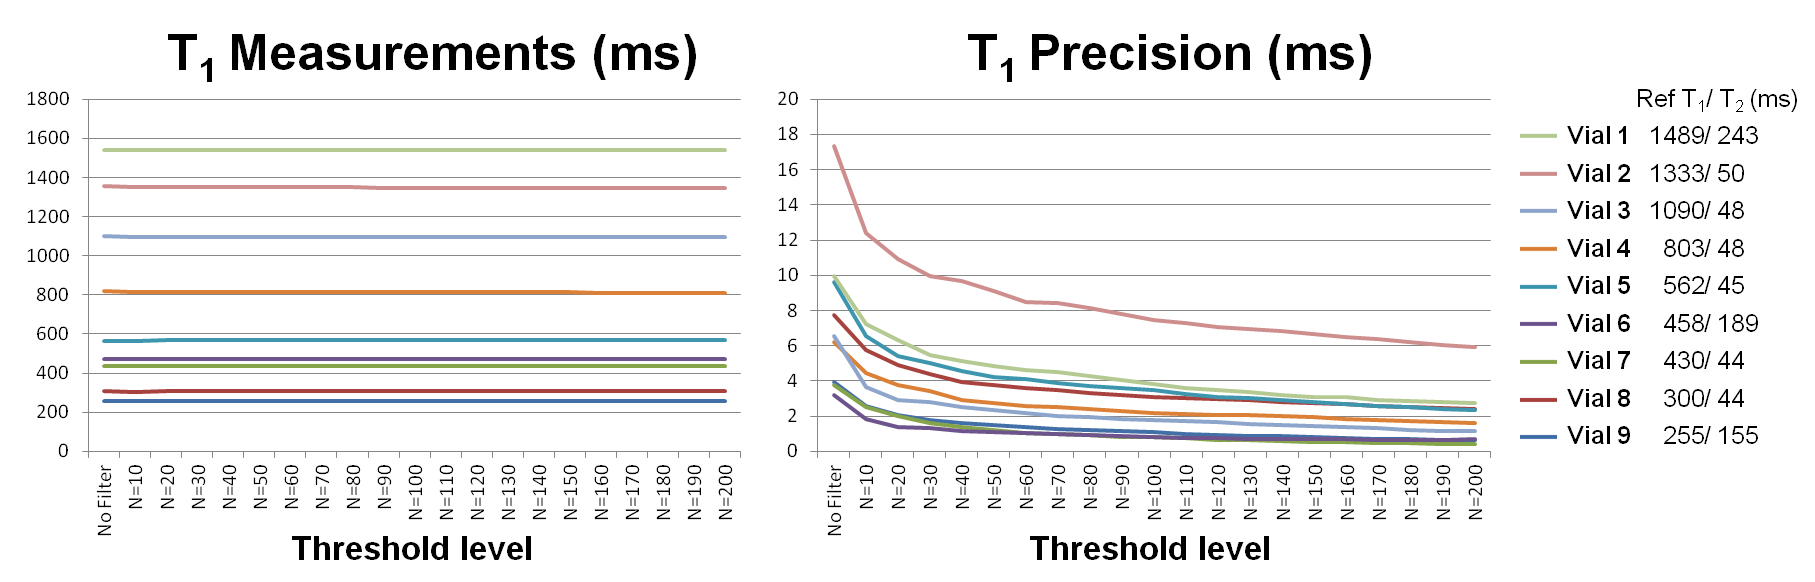
To study the impact of the threshold level on T1 measurements and precision, a phantom with vials of T1/T2 in the ranges of 295~1384/50~282 ms was scanned. The threshold level was varied with N - the number of pixels to be averaged - with a constraint on the threshold defined as 0.05 of the squared signal difference at the longest and shortest TI. Paired one-way ANOVA analysis was performed to test for statistical difference with varying threshold levels.
In-vivo study
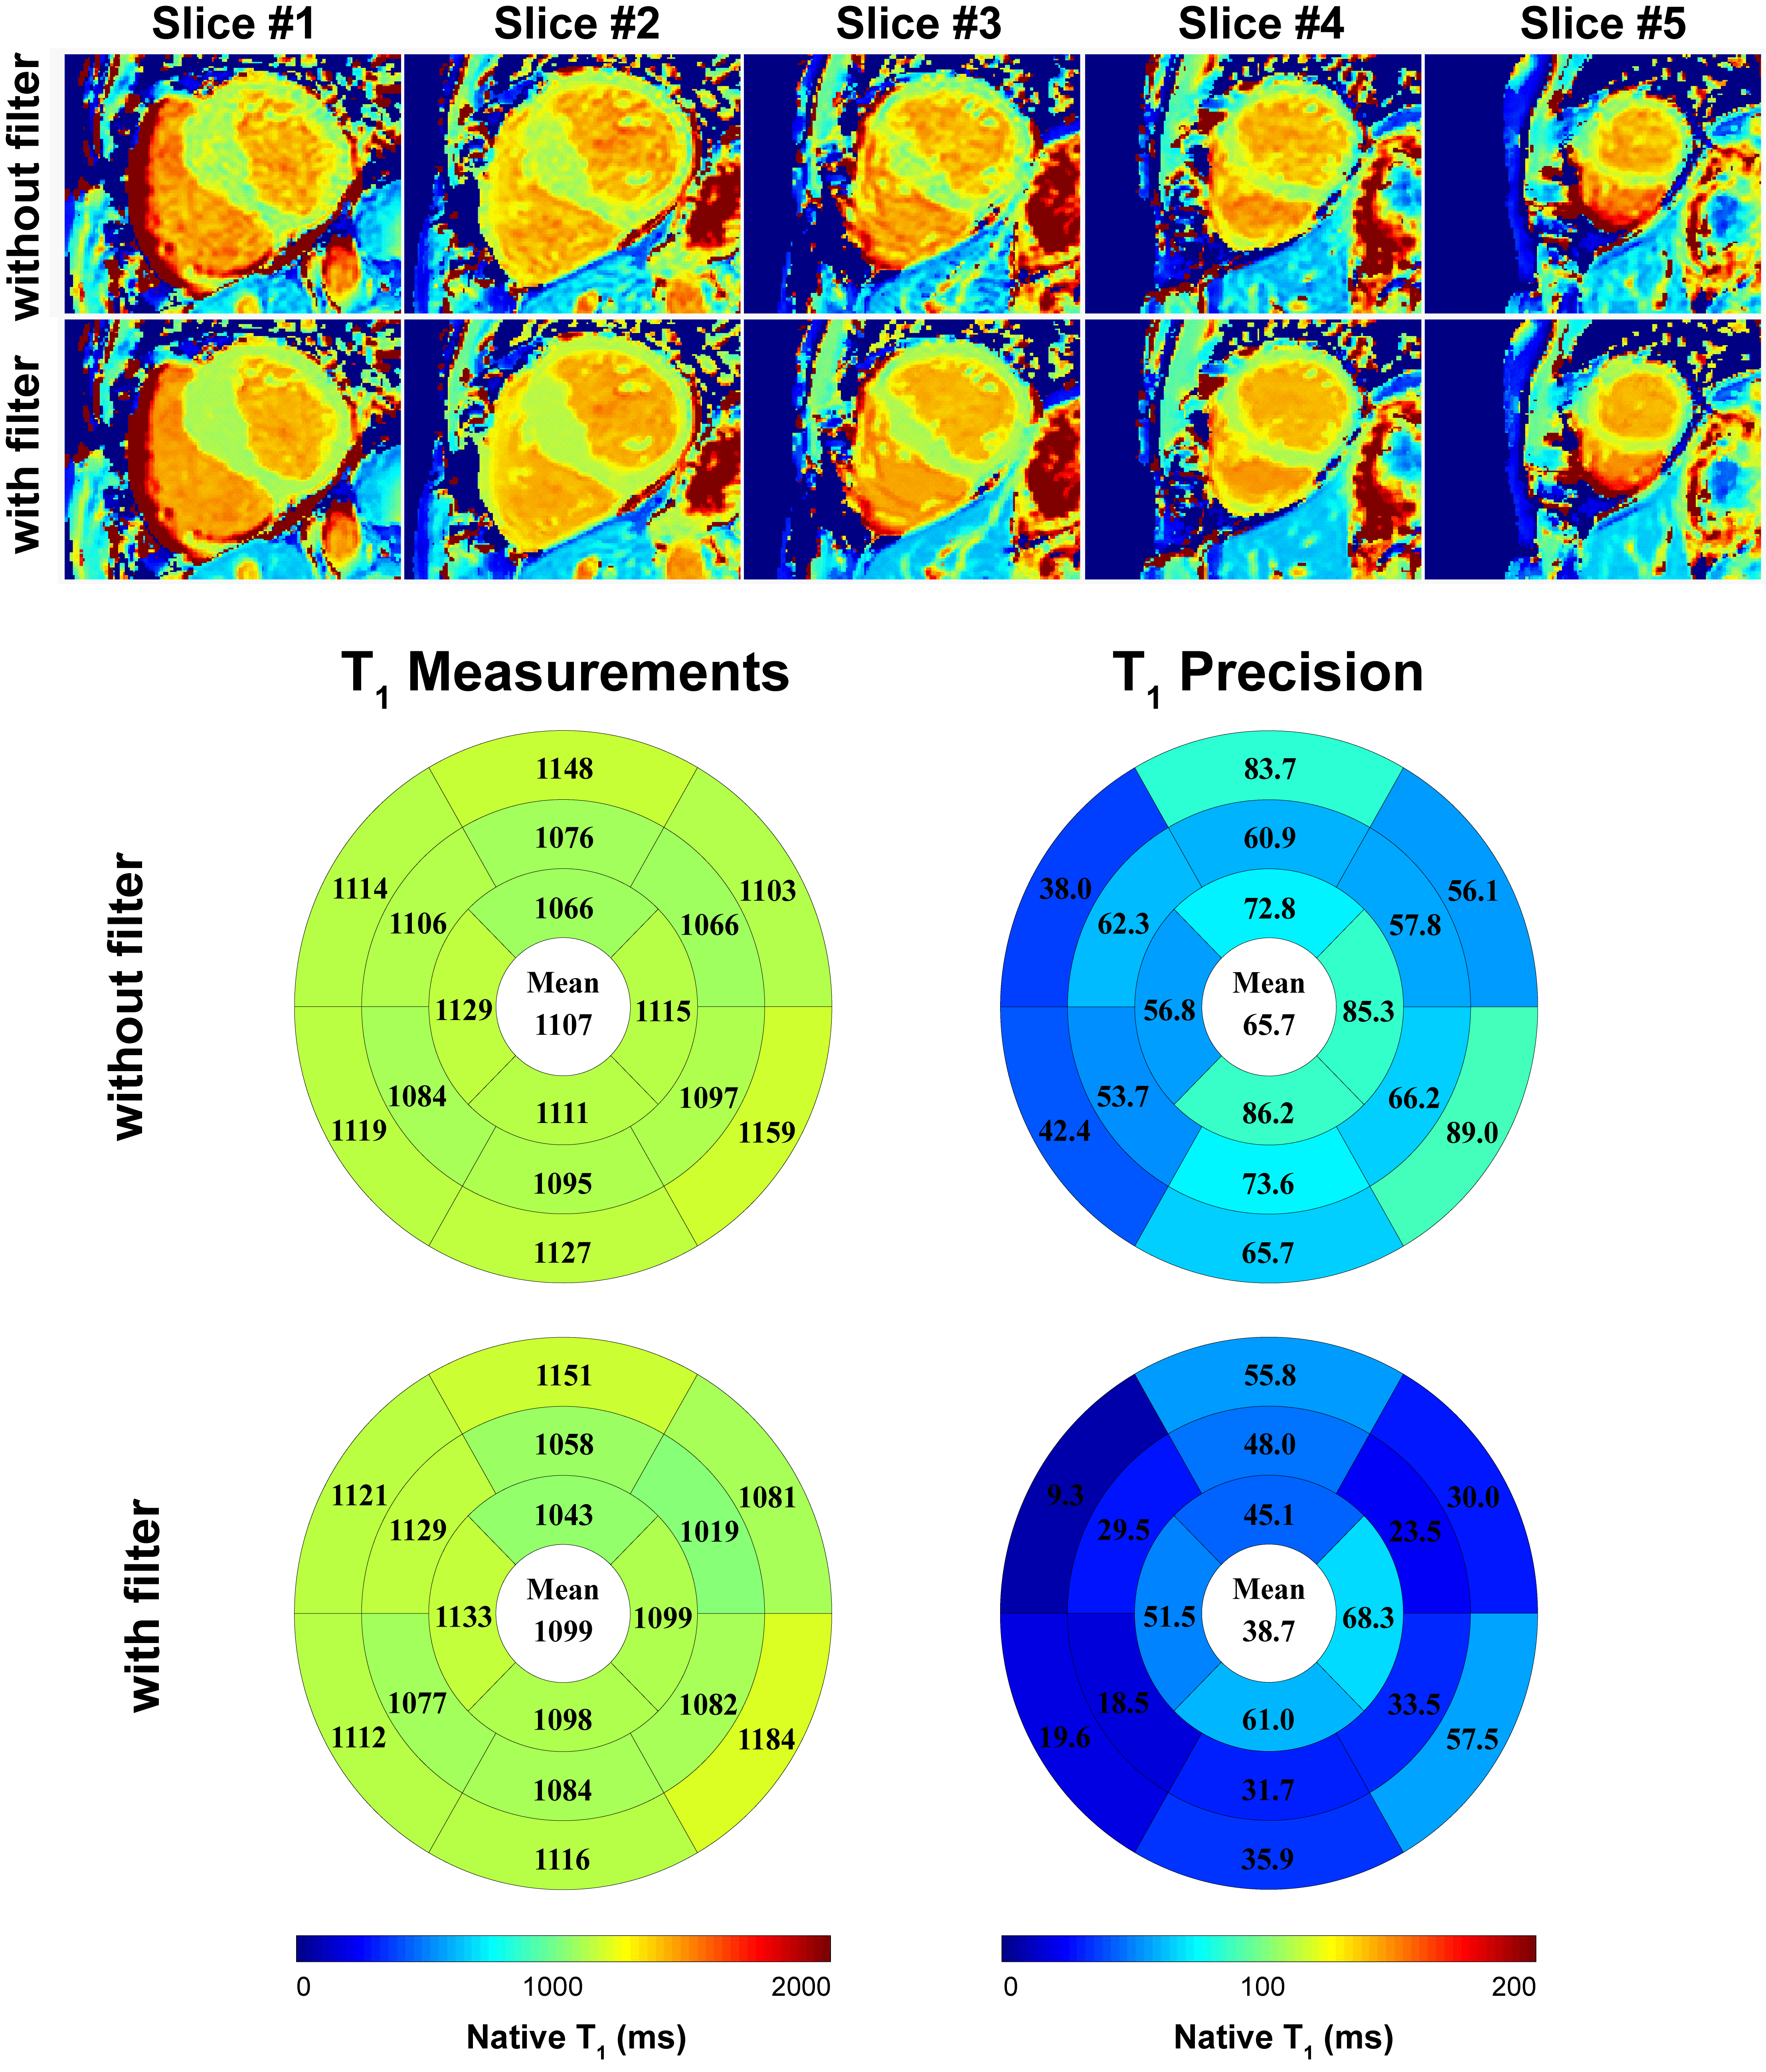
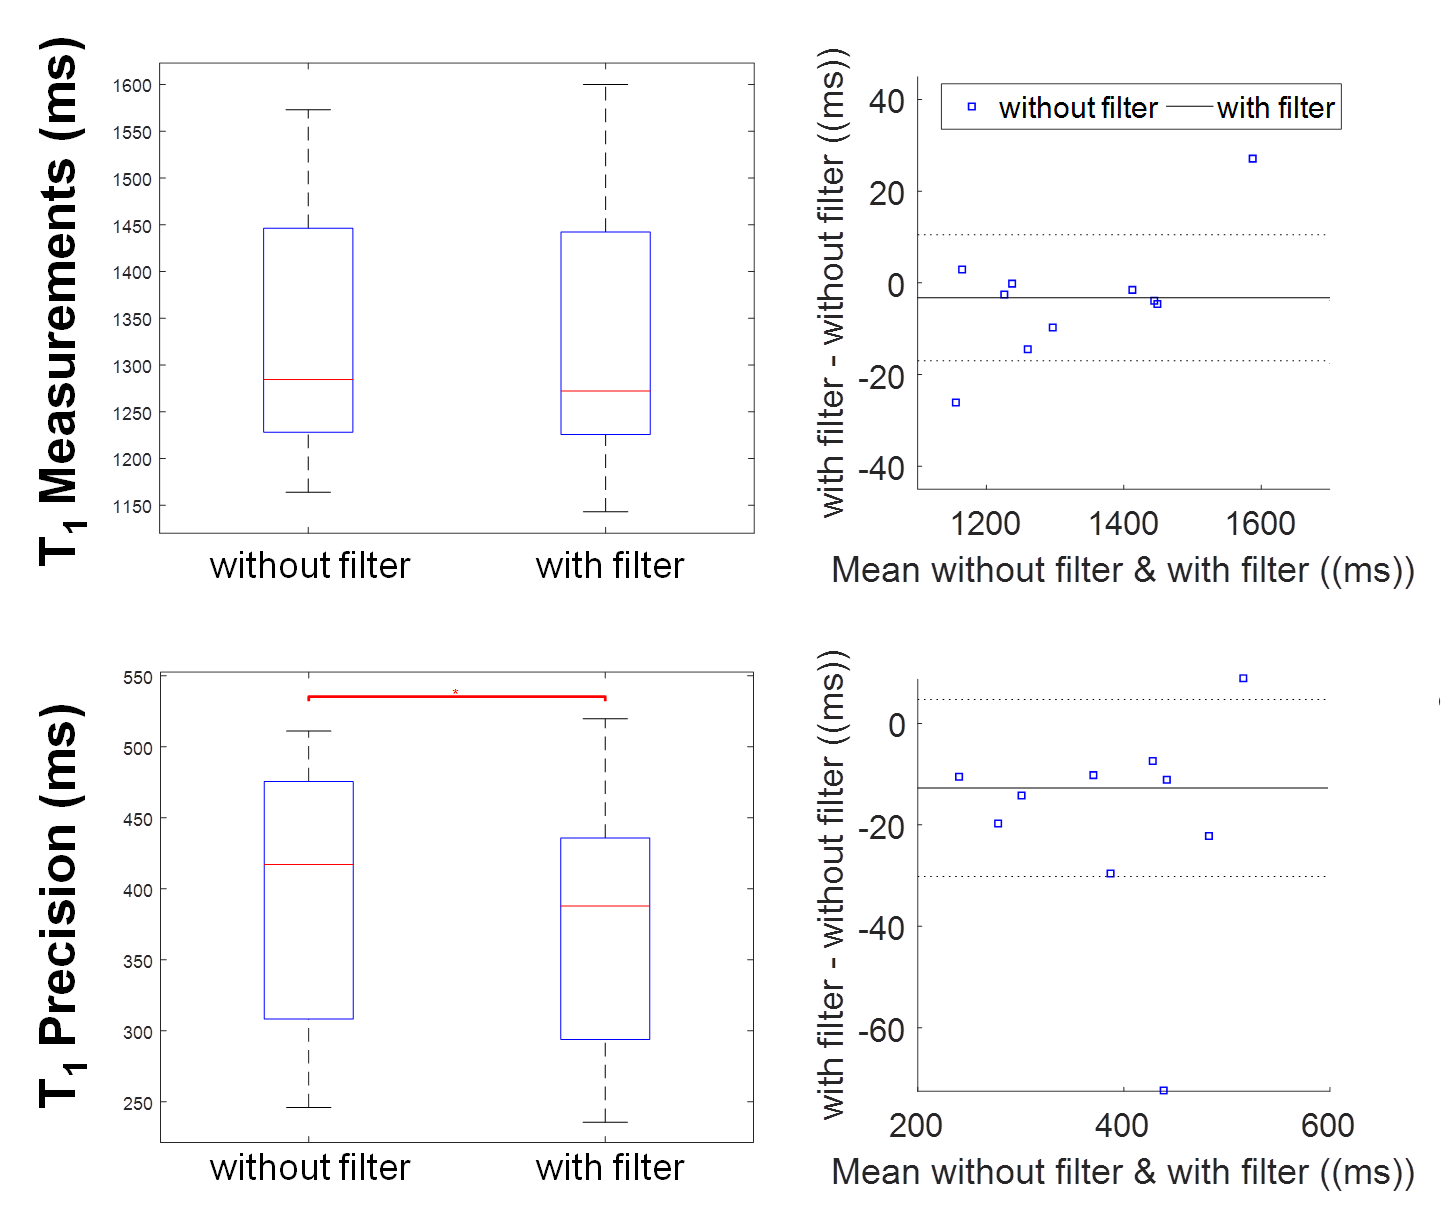
In-vivo T1 measurements and precision were compared before and after applying denoising filter. In the in-vivo study, N was 500 and threshold was defined as 0.1 of the squared signal difference at the longest and shortest TI. Endocardial and epicardial contours were manually delineated by an experienced reader on the T1 maps before filtering. Identical contours were used to ensure the difference in measurements is only due to the filtering. T1 measurement was defined as the average of T1 time, and T1 precision was defined as the standard deviation of T1 time in the myocardium in all 5 slices. Wilcoxon signed rank test and Bland-Altman analysis were performed to test for significant difference in in-vivo T1 measurements and precision before and after denoising.
Results
In the phantom study, T1 measurements were similar for different levels of thresholds (p>0.05) with significantly improved T1 precision at increasing threshold (p=0.0002) (Fig. 2). In the patients study, T1 maps that were generated from the tissue characteristic-based denoised images provided homogeneous signal all over the myocardium (Fig 3). There were no statistically significant difference in T1 measurements before and after denoising (without filter: 1325 ± 138, with filter: 1322 ± 147, p=0.2). Precision was significantly improved after filtering (without filter: 398 ± 91, with filter: 379 ± 91, p=0.006). Bland-Altman analyses showed similar T1 measurements, as well as improved T1 precision after denoising filtering (Fig. 4).
Conclusion
More accurate and precise myocardial T1 mapping is possible by employing a 3-parameter fit model with robust tissue characteristic-based denoising. This technique will make 3-parameter fit model more favorable by reducing sensitivity to noise and will allow for more accurate and precise myocardial T1 mapping.Acknowledgements
No acknowledgement found.References
1. Ambale-Venkatesh B, Lima JA. Cardiac MRI: a central prognostic tool in myocardial fibrosis. Nature reviews cardiology. 2013;12:18-29.
2. Messroghli DR, Radjenovic A, Kozerke S, Higgins DM, Sivananthan MU, Ridgway JP. Modified Look-Locker Inversion recovery (MOLLI) for high-resolution T1 mapping of the heart. Magnetic resonance in medicine. 2002;52:141-146.
3. Kellman P, Hansen MS. T1-mapping in the heart: accuracy and precision. Journal of cardiovascular magnetic resonance?: official journal of the Society for Cardiovascular Magnetic Resonance. 2014;16.
4. Roujol S, Foppa M, Weingärtner S, Manning WJ, Nezafat R. Adaptive registration of varying contrast-weighted images for improved tissue characterization (ARCTIC): application to T1 mapping. Magnetic resonance in medicine. 2015;73:1469-1482.
5. Eo T, Kim T, Jun Y, et al. High-SNR multiple T2 (*)-contrast magnetic resonance imaging using a robust denoising method based on tissue characteristics. Journal of Magnetic Resonance Imaging. 2016.
6. Weingärtner S, Roujol S, Akçakaya M, Basha TA, Nezafat R. Free-breathing multislice native myocardial T1 mapping using the slice-interleaved T1 (STONE) sequence. Magnetic resonance in medicine. 2013;74:115-124.
7. Wang Y, Riederer SJ, Ehman RL. Respiratory motion of the heart: kinematics and the implications for the spatial resolution in coronary imaging. Magnetic Resonance in Medicine. 1993;33:713-719.
Figures