3097
Quantitative Tissue Characterization by Magnetization Transfer-Weighted Cardiac MRI Detects Fibrosis Progression without Gadolinium in Patients with End Stage Renal Disease1Physiology, University of Kentucky, Lexington, KY, United States, 2Cardiovascular Research Center, University of Kentucky, KY, United States, 3College of Medicine, University of Kentucky, KY, United States, 4Gill Heart Institute, University of Kentucky, KY, United States, 5Biomedical Engineering, University of Kentucky, KY, United States, 6Bioengineering, University of California Berkeley, Berkeley, United States
Synopsis
Long term hemodialysis treatment for end stage renal disease (ESRD) is associated with a time dependent increase in cardiac death. The inability to use late gadolinium enhancement (LGE) cardiac MRI (CMR) in patients with renal dysfunction impedes the noninvasive monitoring of fibrosis progression and appropriate treatment selection in the population. We used magnetization transfer (MT) weighted CMR to monitor the progression of ventricular fibrosis over 1 year in patients with ESRD. While no major changes in hypertrophy or contractility were apparent, pervasive increases in myocardial signal was measured by MT-weighted CMR, consistent with reduced MT and progressive fibrosis development.
Purpose
Chronic hemodialysis treatment for end stage renal disease (ESRD) is associated with a time-dependent increased risk—up to 20 times greater than the general population—of mortality from adverse cardiac events including fatal arrhythmias1. The presence of ventricular fibrosis is predictive of higher death rates2, yet the contraindication to late gadolinium enhancement cardiac MRI (CMR) excludes patients with ESRD from noninvasive fibrosis identification. No longitudinal CMR study has been conducted to non-invasively measure the progression of fibrosis in patients with ESRD. Hypertrophy and reduced strain rates are currently utilized as surrogate measures of fibrotic burden. However, these measures may reflect structural and functional alterations irrespective of fibrosis pathology. Fibrosis development occurs concomitantly with expansion of the extracellular water fraction, leading to reduced magnetization transfer in impacted voxels. We employed our gadolinium free magnetization transfer-weighted balanced steady state free precession (bSSFP) approach3 to test the hypothesis that fibrosis progresses over 1 year in patients with ESRD, independent of any changes in hypertrophy or contractile function.Methods
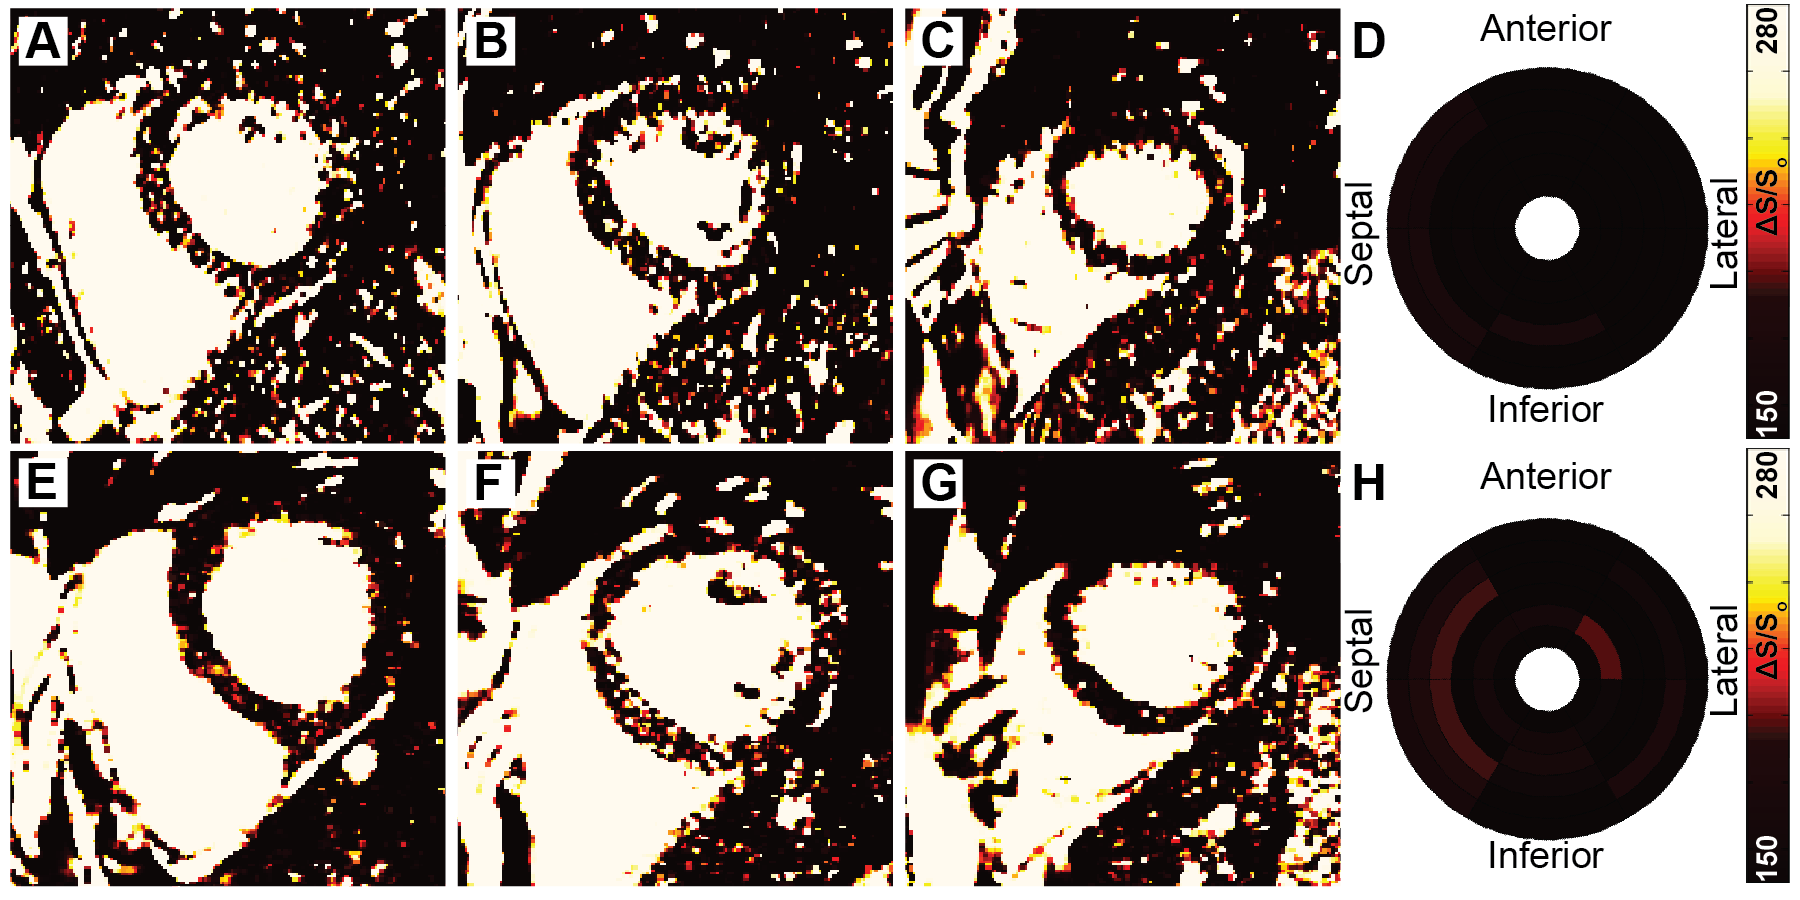
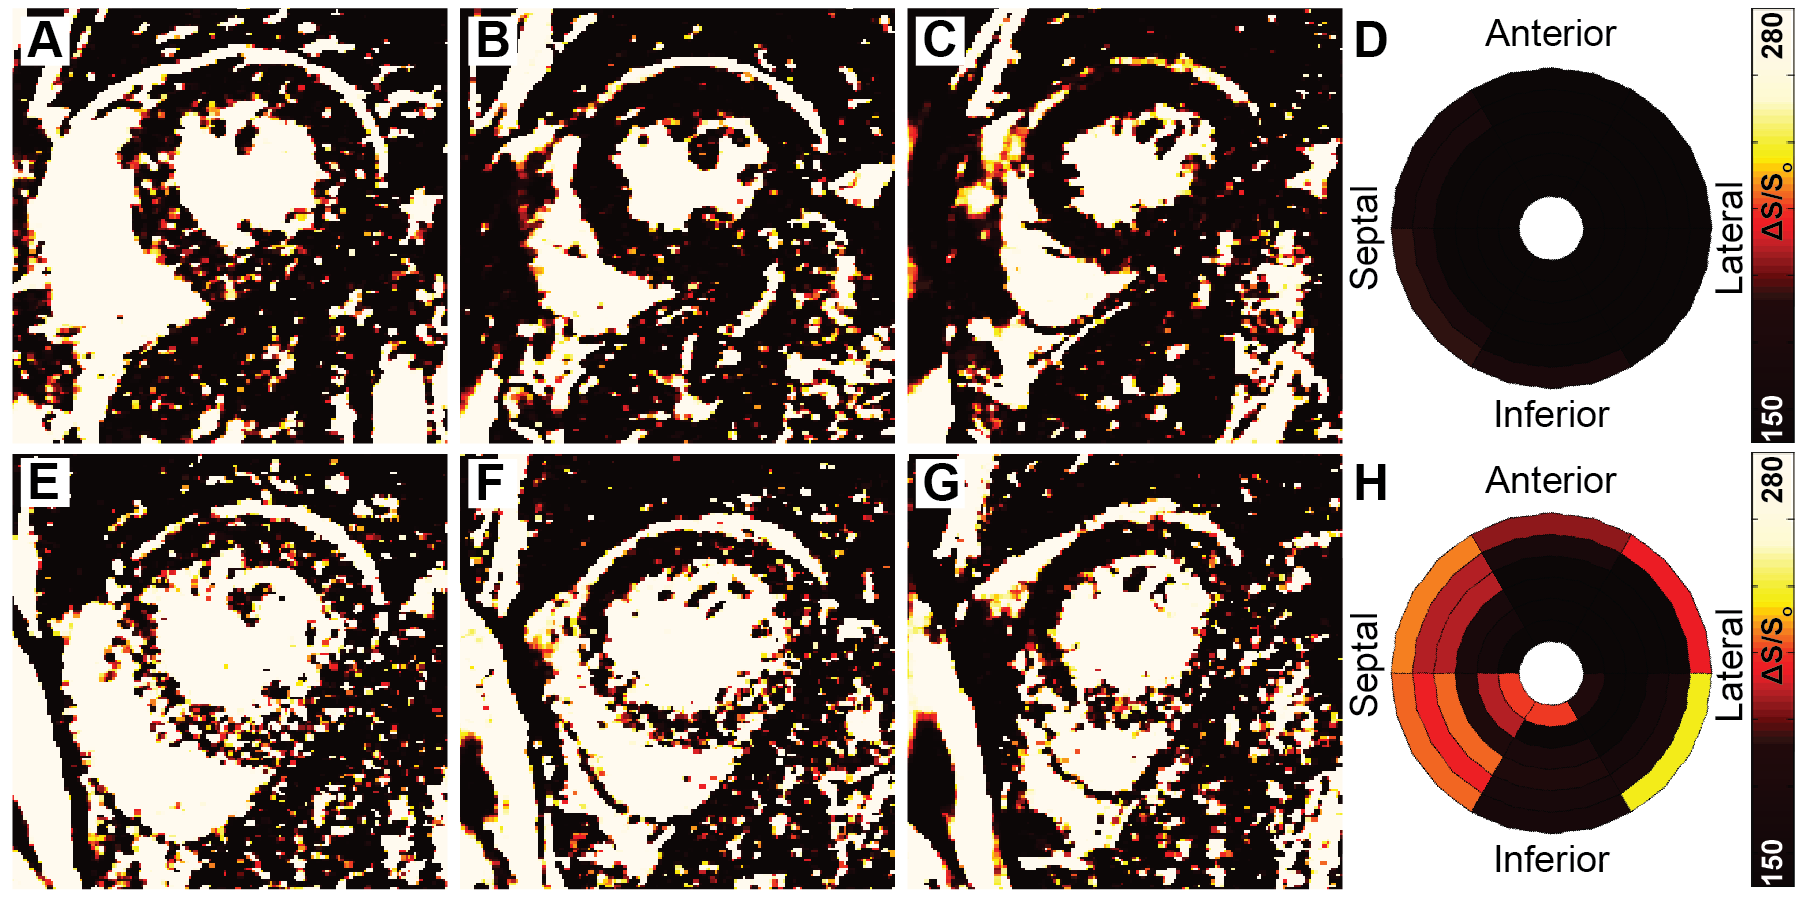
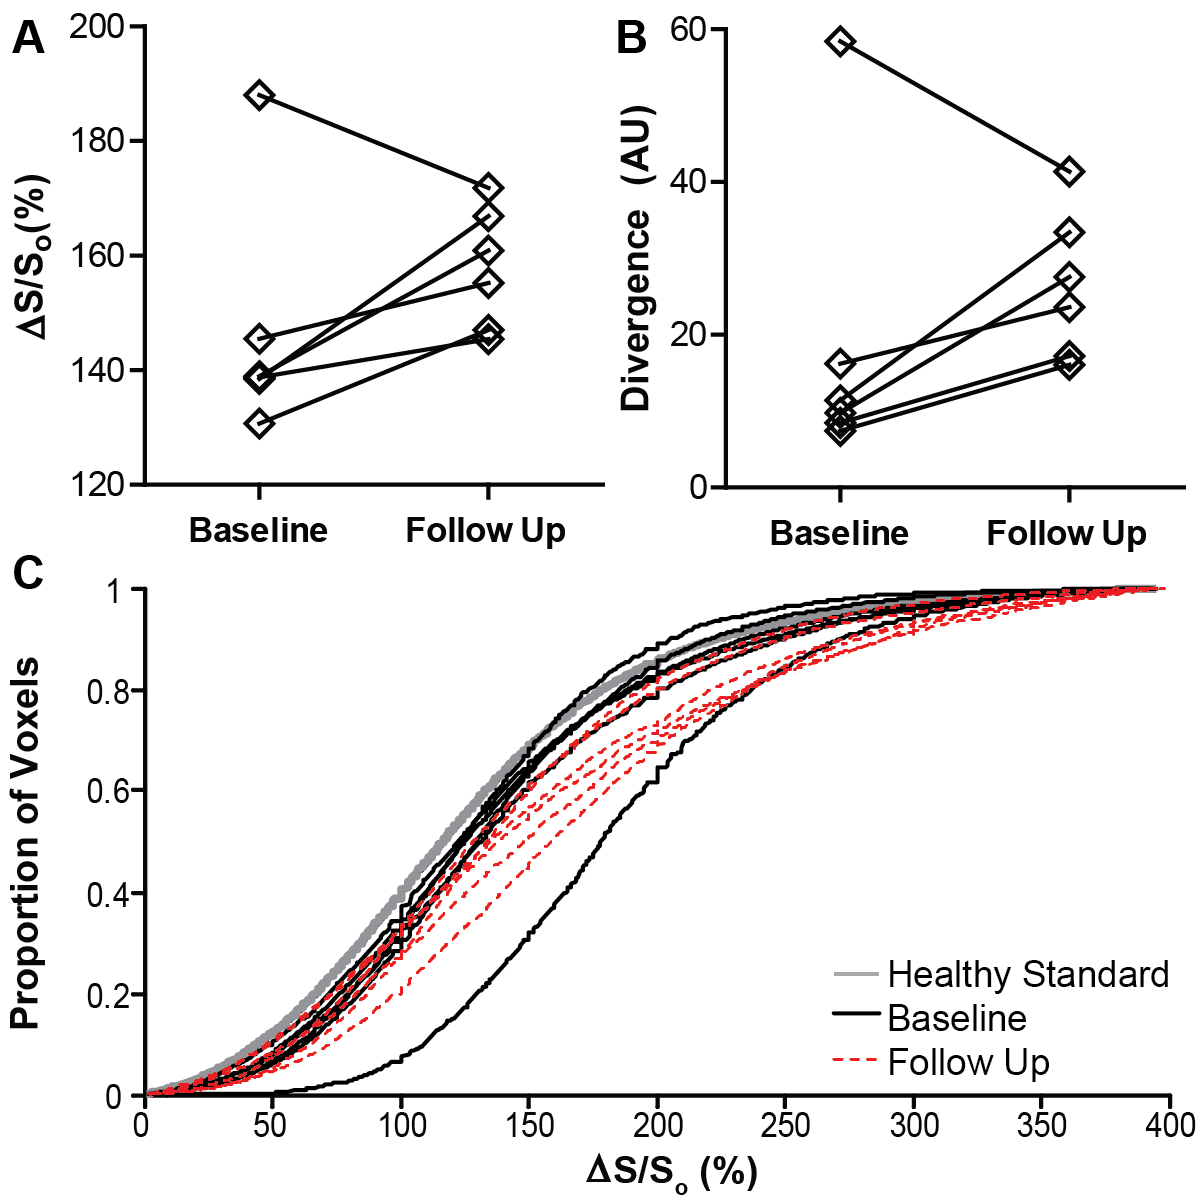
Patients on routine hemodialysis for treatment of ESRD who completed our previous MT-weighted fibrosis imaging protocol (described in detail in abstract control #2046) were invited to participate in follow up imaging 1 year later. MT-contrast was quantified as the normalized change in signal (ΔS/So) between pairs of high and low MT weighted cine bSSFP images [ΔS/So=(S45-S5)/S5*100 (%), Si is per-voxel signal intensity at flip angle i]. Using the healthy standard distribution of ΔS/So values established in our prior study, we calculated divergence as the integrated difference between the healthy standard and each patient’s cumulative distribution of ΔS/So. Divergence is a quantitative measure of signal elevation due to the reduction in MT. Bullseye plots illustrate mean ΔS/So per sector from base (exterior) to apex (center) over the entire ventricle. Ventricular function was measured using a custom feature tracking algorithm described in 4. Measures of structure, contractile function, and fibrosis were compared between time points with paired t tests.Results
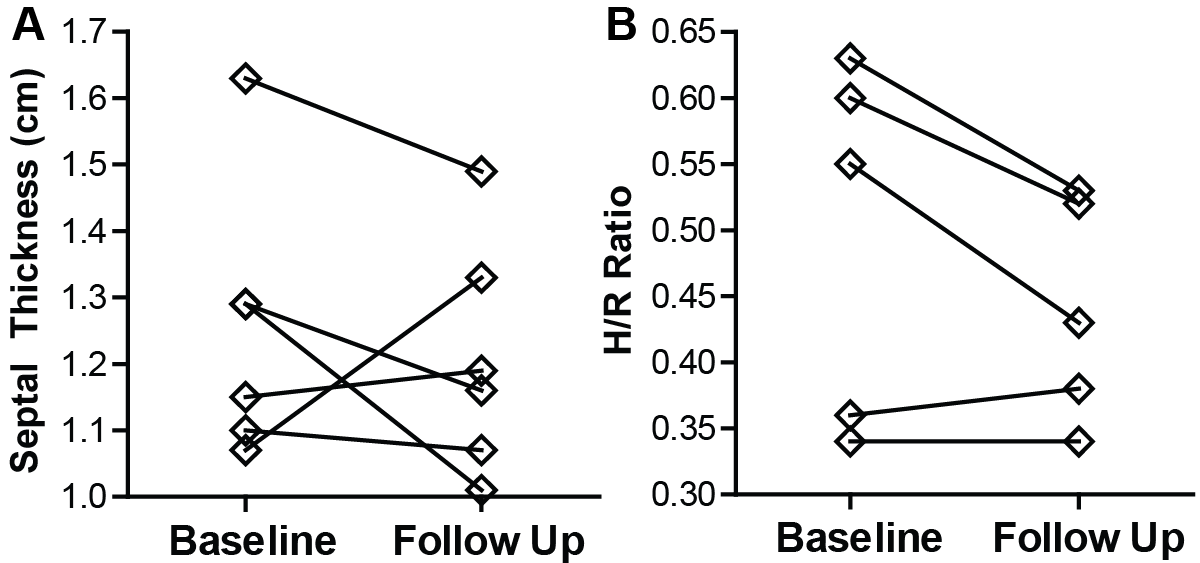
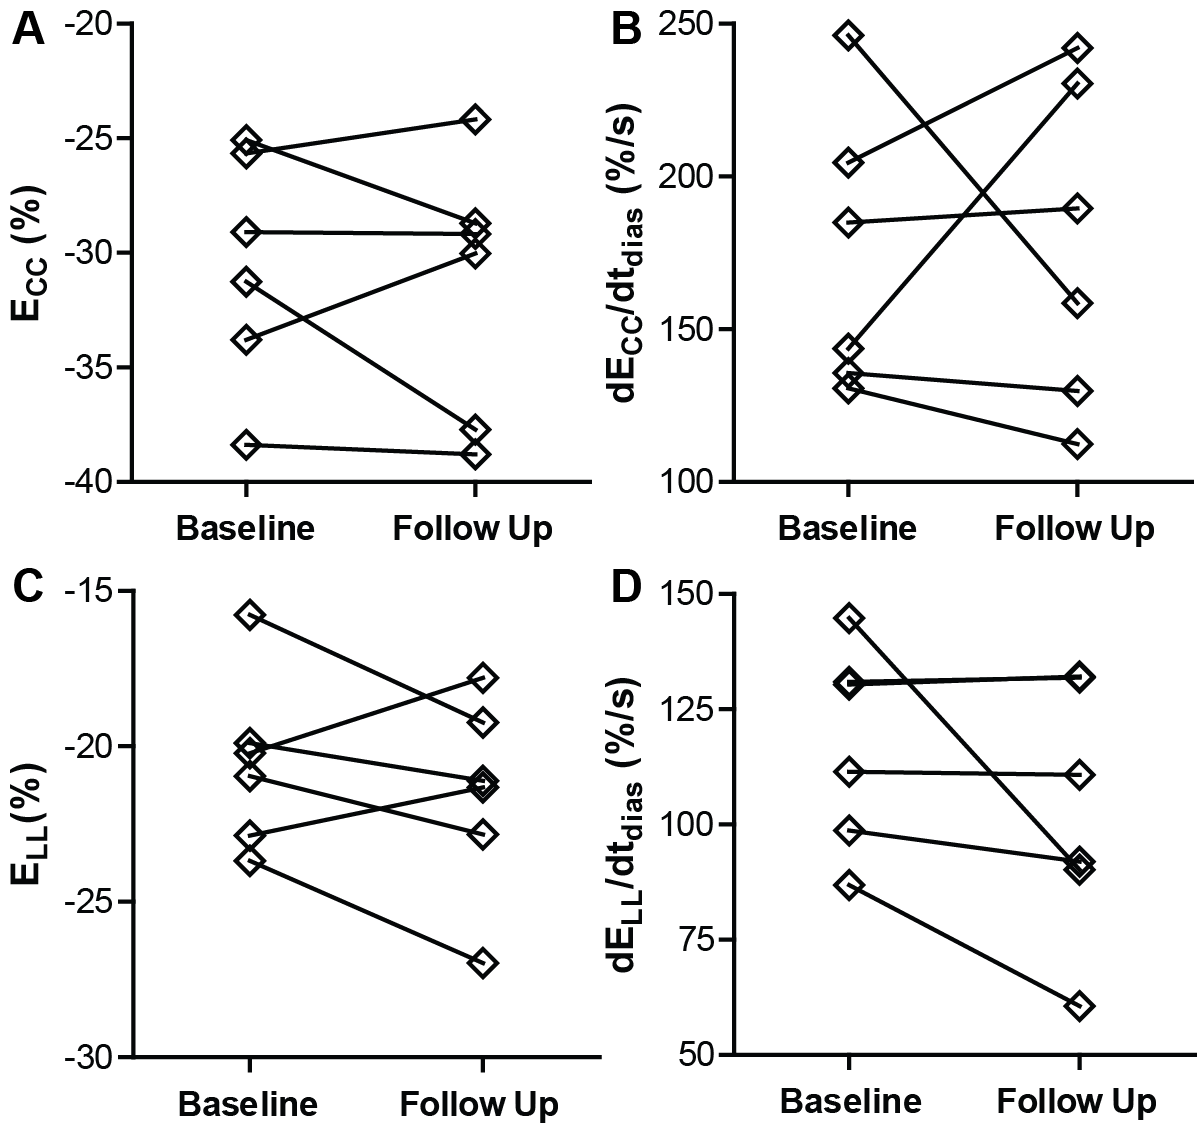
To date, six patients completed both baseline and follow up MT-weighted CMR. All patients were hypertrophic at baseline (septal thickness = 1.3 ± 0.2 cm) but demonstrated no significant alterations in hypertrophy at follow up (1.2 ± 0.2 cm, p=NS, see Figure 1). Ejection fraction increased slightly from 61.2 ± to 8.8% to 65.9 ± 10.4% (p<0.05). Circumferential and longitudinal strain were not significantly changed from baseline (Figure 2). Changes in patterns of elevated ΔS/So over one year were varied, with some individuals demonstrating minor change between initial and follow up scans (Figure 3), and some demonstrating a significantly higher fraction of voxels with elevated ΔS/So values at 1 year (Figure 4). ΔS/So and divergence were considerably increased at follow up by an average of 10.3 ± 16.0% and 7.1 ± 13.7% AU, respectively (Figure 5). With further recruitment these increases in fibrotic burden are expected to reach statistical significance.Discussion
Patients with ESRD did not demonstrate significant changes in hypertrophy nor ventricular function over a 1 year follow up period. The severity of fibrosis progression was varied, which demonstrates the heterogeneous development of fibrosis in this population and the need for fibrosis specific monitoring, as a distinct phenotype from structural and functional alterations. The ability to repeatedly image changes in ΔS/So values in the same anatomical locations over time is crucial to eliminating the temporal etiology of fibrosis and subsequent impact on outcomes. By quantifying both a global fibrotic burden and focal pattern of pathology, MT-weighted fibrosis imaging may serve as a better prognostic tool than the current alternatives of hypertrophy and ventricular dysfunction, aiding in more appropriate monitoring and treatment selection for patients with ESRD.Acknowledgements
This work was supported by CCTS KL2TR000116, NHLBI 1R01HL128592 & American Heart Association National Affiliate 14CRP20380071 to MHV, TL1RR000115 to TAS, and NIH CTSA UL1TR000117 to the University of Kentucky.References
1. Foley RN, Parfrey PS, Harnett JD, et al. Clinical and echocardiographic disease in patients starting end-stage renal disease therapy. Kidney Int. 1995;47:186-192.
2. Aoki J, Ikari Y, Nakajima H, et al. Clinical and pathologic characteristics of dilated cardiomyopathy in hemodialysis patients. Kidney Int. 2005;67:333-40.
3. Stromp TA, Leung SW, Andres KN, et al. Gadolinium free cardiovascular magnetic resonance with 2-point Cine balanced steady state free precession. J Cardiovasc Magn Reson. 2015;17:90.
4. Jing L, Haggerty CM, Suever JD, et al. Patients with repaired tetralogy of Fallot suffer from intra- and inter-ventricular cardiac dyssynchrony: a cardiac magnetic resonance study. Eur Heart J Cardiovasc Imaging. 2014;15:1333-43.
Figures