3087
Hyperpolarized Imaging of Lithium-Induced Modulation of [1-13C]Pyruvate Metabolism in the Heart1Institute for Biomedical Engineering, University and ETH Zurich, Zurich, Switzerland
Synopsis
Lithium is the first-line drug used in bipolar disorder, a chronic psychiatric illness characterized by severe biphasic changes in mood. Lithium has a narrow therapeutic window and has shown cardiac side effects. The present work demonstrates the detectability of lithium induced changes of mitochondrial metabolism in cardiomyocytes by employing hyperpolarized [1-13C]pyruvate magnetic resonance imaging of the in-vivo heart. In healthy rats, lithium is shown to increase mitochondrial metabolism and decrease glycolytic lactate production indicating a potential role of lithium in the heart.
Introduction
Bipolar disorder (BD) is a chronic psychiatric
illness, characterized by severe biphasic changes in mood. With a global
prevalence of up to 4.8%, it results in more disability-adjusted life-years
lost than major neurological conditions or cancer.1 Several pathophysiological mechanisms have been hypothesized to
underpin the neurobiology of BD, including the presence of mitochondrial
dysfunction. Mitochondrial dysfunction is proposed to have a central role in
the pathophysiology of BD through mechanisms involving impaired oxidative
phosphorylation, a shift to glycolytic production of energy, general decrease
of energy, and abnormalities in the morphology and intracellular distribution
of mitochondria.2
Lithium (Li+) is a first-line treatment
for BD with a narrow therapeutic window.3 One mechanism of action of Li+ is an increase in
mitochondrial aerobic energy production.4 However, this effect is not tissue specific. In the heart, metabolic
deterioration and accompanying processes eventually lead to myocarditis,
cardiomyopathy, endothelial cell death, and consequently cardiovascular
dysfunction.5 Thus it is of great importance to provide patients with the right
dose of Li+, facilitating mitochondrial metabolism in the brain on
one hand, but sparing cardiomyocytes from damage on the other.
The objective of the present study was to examine
whether modulation of mitochondrial metabolism by Li+ can be
monitored with hyperpolarized [1-13C]pyruvate magnetic resonance imaging.
Methods
Hyperpolarization
A home-built multisample dissolution dynamic nuclear polarization (DNP) system was used to polarize samples consisting of 50.8µL [1-13C]pyruvic acid and 13.5mM trityl, doped with 1mM Dotarem yielding an 80mM [1-13C]pyruvate solution.6
Animal Preparation
All animal experiments were performed with adherence to the Swiss Animal Protection law and were approved by the regional veterinary office. Four female Spargue-Dawley rats weighing 360-380g were anesthetized with 4% isoflurane in a mixture of air and oxygen (4:1), endotracheal intubation was performed, and ventilation was initiated. Anesthesia was maintained by using 1-2% isoflurane. Body temperature was kept at 37-38°C using a warm water heating system. Two 26-gauge intravenous cannulas were placed in opposite sides of the tail, one to allow injection of the dynamic nuclear polarization substrate and one for continuous glucose infusion (15mg/kg/min)7.
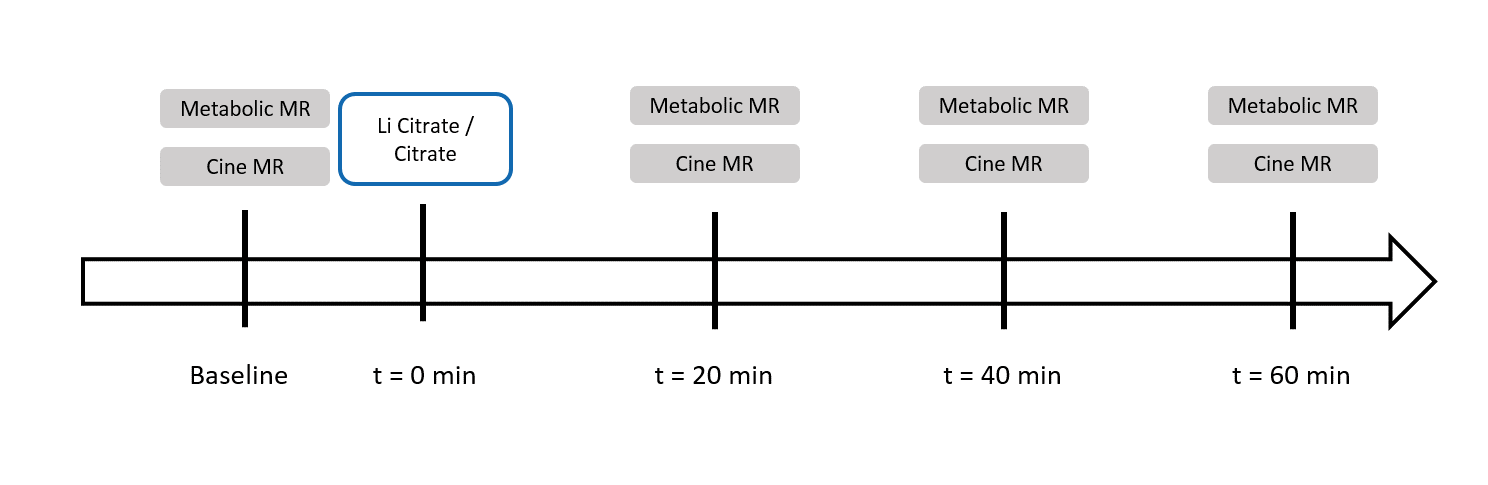
Study Protocol
Following an initial baseline measurement, rats were injected with 1ml sodium chloride 0.9% solution containing either lithium citrate (treatment, 20mg lithium citrate/animal, n=2), or an equivalent amount pH adjusted citric acid (n=2). Additional measurements were taken at t=20, 40, and 60min after the injection of Li/citrate (Figure 1).
Magnetic Resonance Imaging
Imaging experiments were performed with a 9.4-T MR imaging system (Biospec 94/30, Bruker Biospin, Ettlingen, Germany). A birdcage dual 1H/13C coil (Rapid Biomedical, Wurzburg, Germany) was used for excitation. A rectangular 13C surface coil with a sensitive coil area of 40x30mm2 (Rapid Biomedical) was placed over the thorax for signal reception. Metabolic data were acquired with a multiband radiofrequency pulse in combination with a multiecho single-shot echo-planar readout8. The imaging field of view was 60x40mm2, in-plane spatial resolution was 1.25x1.25mm2, and section thickness was 4mm. Seven echoes were acquired. Metabolic imaging was triggered to end systole, and the seven readouts were repeated every 1.5s during a total imaging duration of 2min.
Data Analysis
Metabolic images were reconstructed using the IDEAL approach9 encoding pyruvate, lactate, bicarbonate, pyruvate hydrate, and alanine resonances. Lactate, bicarbonate, and lactate-to-bicarbonate ratio were quantified based on the area under the curve (AUC) of the signal intensity–time curves. Metabolite AUCs were normalized by the total myocardial carbon (TmC) signal acquired in each scan corresponding to the sum of the lactate, bicarbonate and alanine resonances.
Results
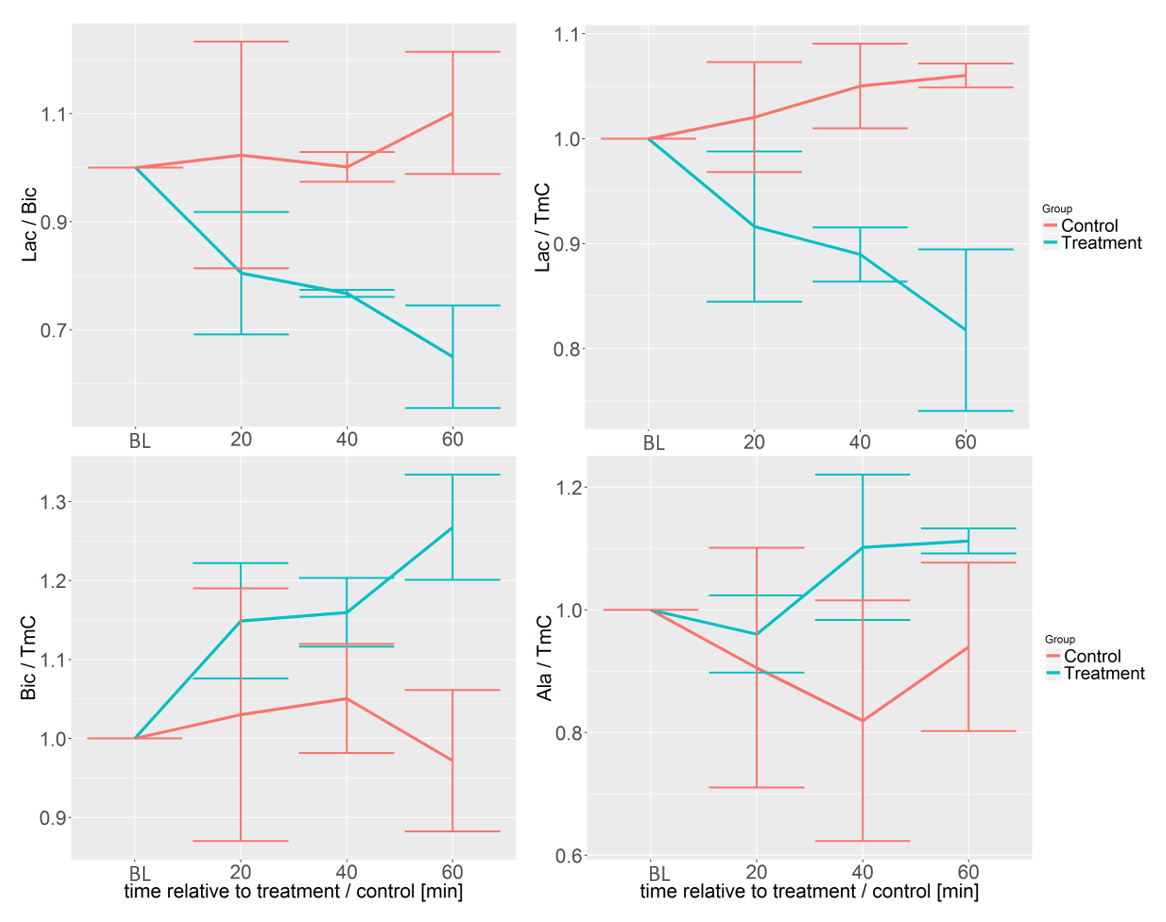
Metabolite AUC ratios showed a time
dependent change after injection of lithium treatment, with effects becoming
the strongest at t=60min (Figure 2). Lactate/TmC decreased over the course of 60min
(down to finally -11 and -26% relative to baseline). Bicarbonate/TmC reproducibly
increased (up to +20 and +33%) for the treatment group, leading to changes of
-26 and -45% in lactate-to-bicarbonate comparing baseline and t=60min. The
trends were not observed for animals injected with the control solution (citric
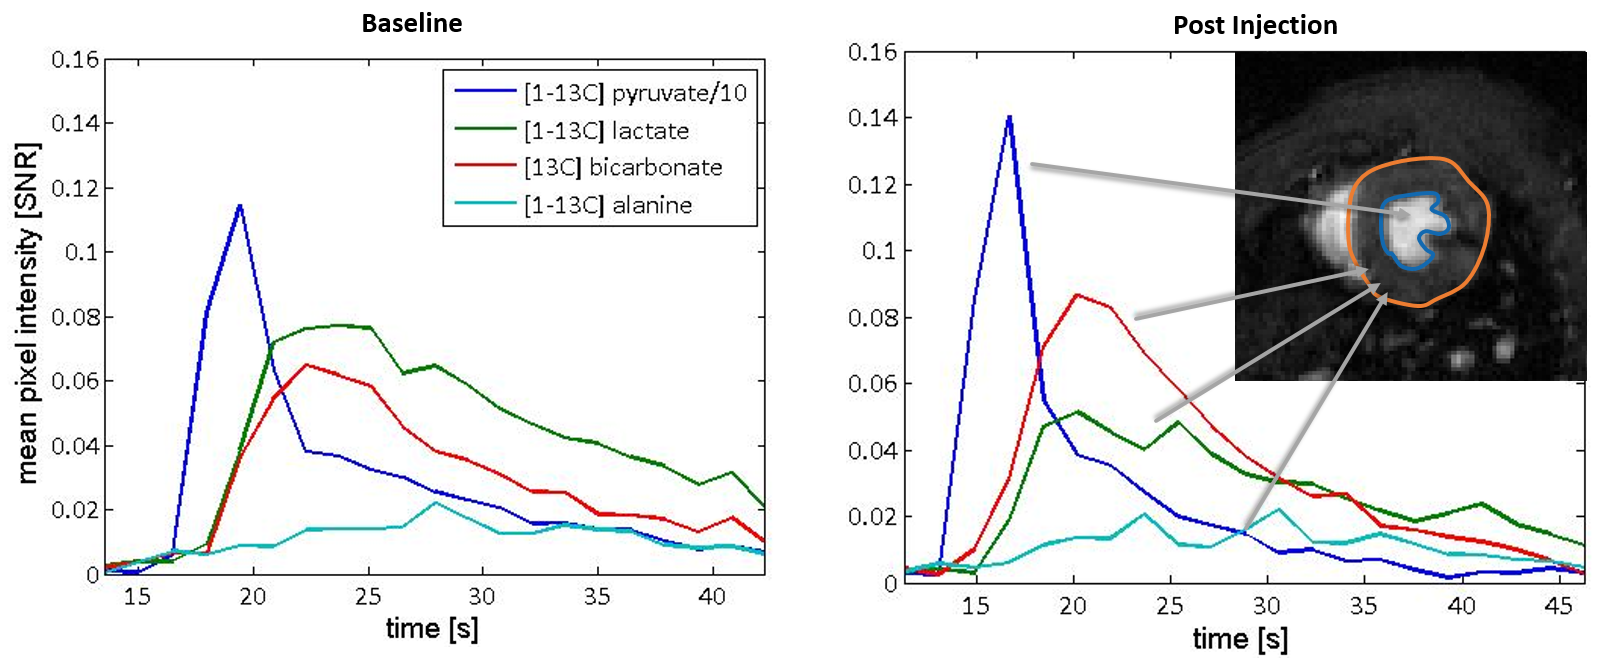
acid). Representative time-courses are shown in Figure 3.
Discussion
This preliminary data shows that lithium modulates
mitochondrial activity in the heart as resolved by hyperpolarized [1-13C]pyruvate
MR imaging. The decrease in lactate and increase in bicarbonate signal was
found to evolve with time. These observations match findings for BD, where bicarbonate
production is impaired and energy is generated by glycolytic lactate
production.2 Probing metabolism of the heart and other tissues of interest (e.g.
brain) using hyperpolarized [1-13C]pyruvate MR imaging might thus prove to be a
useful tool to monitor effects of lithium treatment in-vivo.
Acknowledgements
The authors acknowledge funding from the Swiss National Science Foundation, grant 320030_153014.References
1. Merikangas, K. R. et al. Prevalence and correlates of bipolar spectrum disorder in the world mental health survey initiative. Arch. Gen. Psychiatry 68, 241–51 (2011).
2. Scaini, G. et al. Mitochondrial dysfunction in bipolar disorder: Evidence, pathophysiology and translational implications. Neurosci. Biobehav. Rev. 68, 694–713 (2016).
3. Mohandas, E. & Rajmohan, V. Lithium use in special populations. Indian J. Psychiatry 49, 211–8 (2007).
4. Salimi, A., Gholamifar, E., Naserzadeh, P., Hosseini, M.-J. & Pourahmad, J. Toxicity of lithium on isolated heart mitochondria and cardiomyocyte: A justification for its cardiotoxic adverse effect. J. Biochem. Mol. Toxicol. 1–8 (2016). doi:10.1002/jbt.21836
5. Kang, Y. J. Molecular and cellular mechanisms of cardiotoxicity. Environ. Health Perspect. 109, 27–34 (2001).
6. Krajewski, M. et al. A multisample dissolution dynamic nuclear polarization system for serial injections in small animals. Magn. Reson. Med. (2016). doi:10.1002/mrm.26147
7. Lauritzen, M. H. et al. Enhancing the [13C]bicarbonate signal in cardiac hyperpolarized [1-13C]pyruvate MRS studies by infusion of glucose, insulin and potassium. NMR Biomed. 26, 1496–1500 (2013).
8. Sigfridsson, A. et al. Hybrid multiband excitation multiecho acquisition for hyperpolarized 13 C spectroscopic imaging. Magn. Reson. Med. 73, 1713–1717 (2015).
9. Reeder, S. B. et al. Multicoil Dixon chemical species separation with an iterative least-squares estimation method. Magn. Reson. Med. 51, 35–45 (2004).
Figures