3084
Acute renal metabolic effect of metformin treatment assessed with hyperpolarized magnetic resonance imaging1MR Research Center, Aarhus University, Aarhus N, Denmark, 2Department of Medical Cell Biology, Uppsala University, Uppsala, Sweden
Synopsis
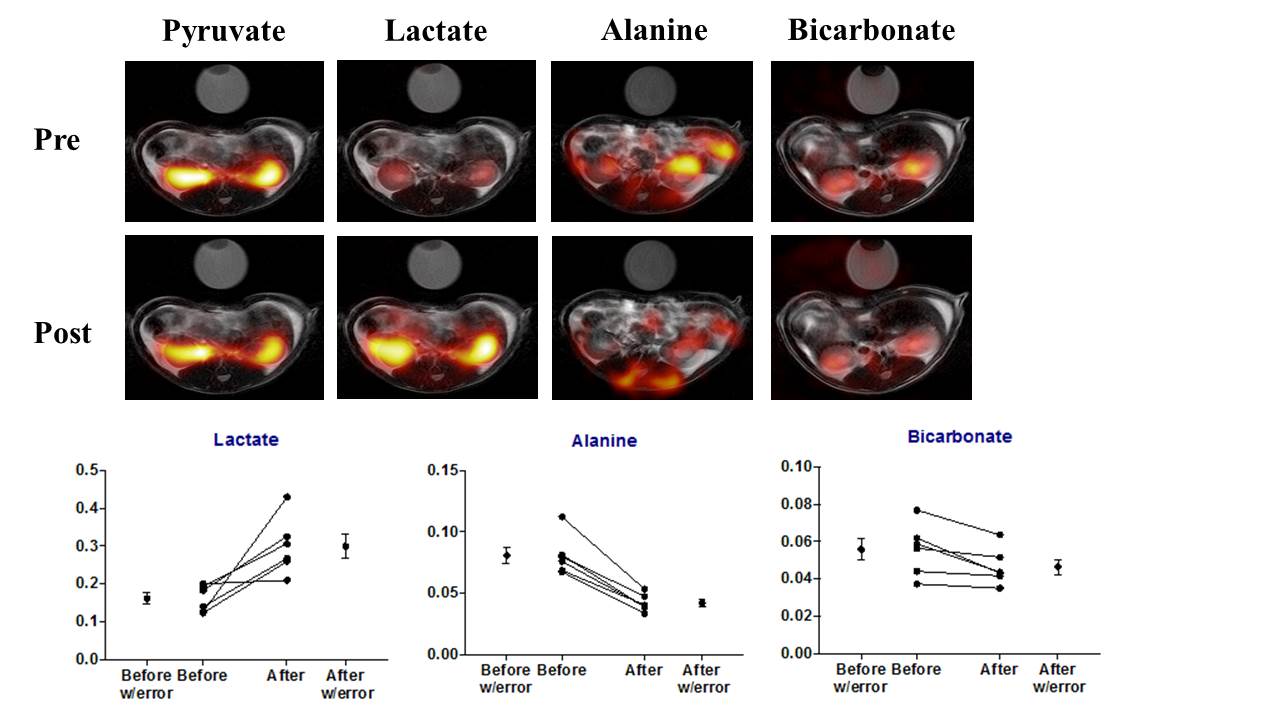
Metformin is the primary anti-diabetic drug in type-2 diabetes.However, controversy exists on its use in patients with renal impairment.Here we investigated the acute metabolic effects of metformin treatment in rat kidneys,with hyperpolarized 13Cpyruvate and Clark-electrodes.A significantly altered metabolic phenotype was observed 30min post metformin treatment.Anaerobic metabolism was elevated in the cytosol,indicated by increased lactate/pyruvate ratio,and mitochondrial aerobic metabolism was reduced,indicated by decreased bicarbonate/pyruvate ratio.Acute metformin treatment increased renal blood flow with higher O2 saturation and did not change tubular O2 consumption.These results indicate that metformin reduces mitochondrial respiration and enhances anaerobic metabolism,even with enough oxygen supply,within only 30min of treatment.
Purpose
To explore whether acute metformin administration alters mitochondrial respiration and anaerobic metabolism in healthy kidney tissue.Methods
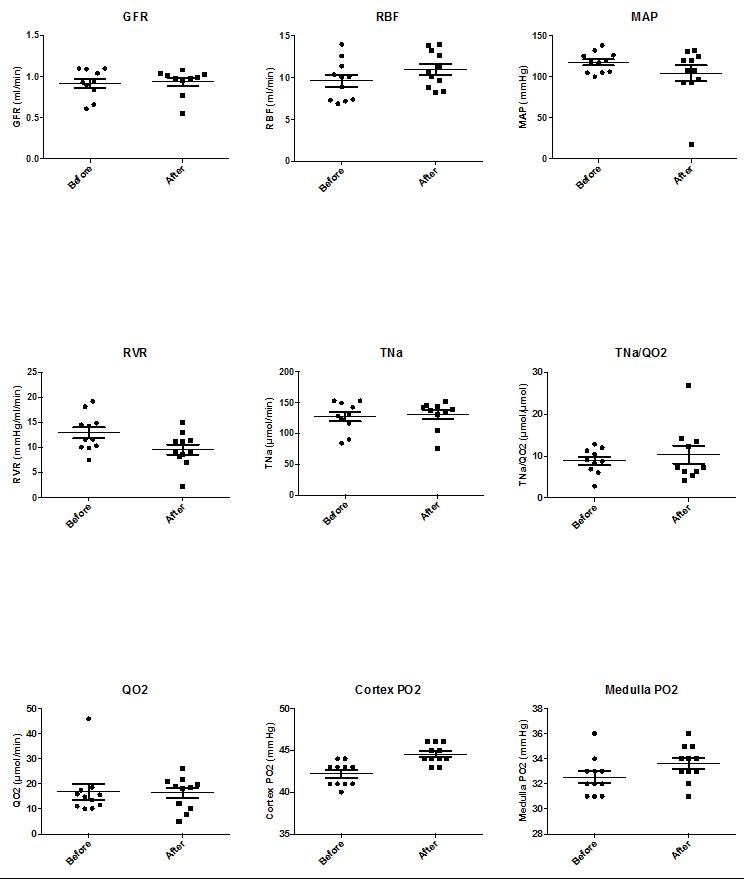
Six ten-week old female Wistar rats were anesthetized and inserted with a tail vein catheter for administration of metformin and injection of hyperpolarized [1-13C] pyruvate. The [1-13C] pyruvate was polarized in 5T SPINLAB (GE Healthcare, Broendby, DK). Temperature, oxygen saturation and respiration rate were monitored throughout the experiment. Each animal was injected twice with 1.5 ml hyperpolarized [1-13C] pyruvate, before and 30 min after metformin treatment (55 mg/kg body weight). The hyperpolarized MR examinations were performed in a 3.0 T clinical MR system (GE healthcare) equipped with a dual tuned 13C/1H volume rat coil (GE healthcare, Brøndby, DK). A slice-selective 13C IDEAL spiral sequence was used for HP-MRI acquiring every 5 second initiated 20 second after the start of injection. Flip angle=10º, 11 IDEAL echoes and one initial spectrum per IDEAL encoding, TR/TE/ΔTE=100 ms/0.9 ms/0.9 ms, FOV=80 x 80 mm2, 5 x 5 mm real resolution and an axial slice thickness of 15 mm covering both kidneys. Invasive measurements of in situ renal function were performed invasively in ten more ratsbefore and 30min after metformin treatment for glomerular filtration rate(GFR), renal blood flow(RBF), mean arterial pressure(MAP), renal vascular resistance(RVR), Na+ reabsorption(TNa), tubular O2 consumption(QO2) and cortex and medulla oxygen tension(PO2). An additional sixteen rats were divided into a control group receiving saline, and a metformin group receiving metformin for 30min. Blood, urine and kidney tissue were harvested from these rats and freeze-clamped for further tests.Results
Discussion
This study demonstrates significant renal metabolic changes with enhanced anaerobic and reduced aerobic metabolism induced by metformin treatment (Pasteur effect), using hyperpolarized MR in rats. There effects were observed concomitant with an increased renal blood flow, supplying more oxygen to the tissue (increased cortical PO2). Interestingly the renal QO2 was largely unaltered, supporting the small reduction in pyruvate dehydrogenase (PDH) flux and more importantly the use of hyperpolarized 13C pyruvate to assess these metabolic processes in vivo. The increased anaerobic metabolic pathway (pyruvate-to-lactate conversion) was similarly increased in previous reports in liver and heart1,2. In contrast to the liver and heart the kidney showed a reduction to PDH flux. Lactate acidosis, the most serious side effect of metformin in patients with renal impairment, has been proposed to originate from decreased PDH activity and subsequent inhibition of mitochondrial respiration, and increased anaerobic metabolism3. Our results support this concept: we find that the healthy kidney relies on anaerobic metabolism under metformin treatment even with increased oxygen supply.Conclusion
The main finding in this study is the acute metabolic alterations seen in the healthy kidney upon metformin treatment suggest a general reduction in aerobic metabolism concomitant with an enhanced anaerobic metabolism, leading to an elevated lactate pool size.Acknowledgements
Henrik Vestergaard Nielsen is acknowledged for his expert laboratory assistance.References
1. Lewis AJ, Miller JJ, McCallum C, et al. Assessment of Metformin Induced Changes in Cardiac and Hepatic Redox State Using Hyperpolarized[1-13C]Pyruvate. Diabetes. 2016 Aug 25. pii: db160804. [Epub ahead of print]
2. Madiraju AK, Erion DM, Rahimi Y, et al. Metformin suppresses gluconeogenesis by inhibiting mitochondrial glycerophosphate dehydrogenase. Nature. 2014 Jun 26;510(7506):542-6.
3. Viollet B, Guigas B, Sanz Garcia N, et al. Cellular and molecular mechanisms of metformin: an overview. Clinical science. 2012; 122: 253-270.
Figures