3080
Identifying Immune-Related Metabolic Properties of Pancreatic Cancer via Hyperpolarized Pyruvate Spectroscopic Imaging and NMR Metabolomics1Cancer Systems Imaging, University of Texas MD Anderson Cancer Center, Houston, TX, United States, 2Graduate School of Biomedical Sciences, University of Texas Health Science Center at Houston, Houston, TX, United States, 3Experimental Radiation Oncology, University of Texas MD Anderson Cancer Center, Houston, TX, United States, 4Radiation Oncology, University of Texas MD Anderson Cancer Center, Houston, TX, United States, 5Five Prime Therapeutics, Inc, San Francisco, CA, United States
Synopsis
Although immunotherapy presents an attractive new treatment option for patients with pancreatic cancer, its implementation has been underwhelming. As a critical first step in understanding this failure, we have applied hyperpolarized pyruvate spectroscopic imaging and NMR spectroscopy to interrogate the metabolic properties of pancreatic tumors cultivated in the presence of different immune environments. We observed that the immune environment in which a pancreatic tumor is harvested significantly alters metabolic function and that these metabolic differences exhibit a temporal dependence with respect to tumor development.
Purpose
Despite its relatively low incidence, pancreatic cancer was the fourth leading cause of cancer-related death1 in the US in 2015. This is due in part to pancreatic cancer’s natural resistance to both chemotherapy and radiotherapy2. Immunotherapy presents an attractive potential treatment approach, but initial trials in mice have proved ineffective3. Because cancer cells exhibit a significant increase in metabolic activity relative to normal tissue, an understanding of the metabolic function of tumors in systems with different levels of immunocompetence is a critical first step to develop an understanding of the immune-related metabolic properties of the tumor, which have potential application in assessing a tumor’s response to immunotherapy. This study intends to identify clear biomarkers that can facilitate the assessment of metabolic changes between immunocompromised and immunocompetent pancreatic tumors.Methods
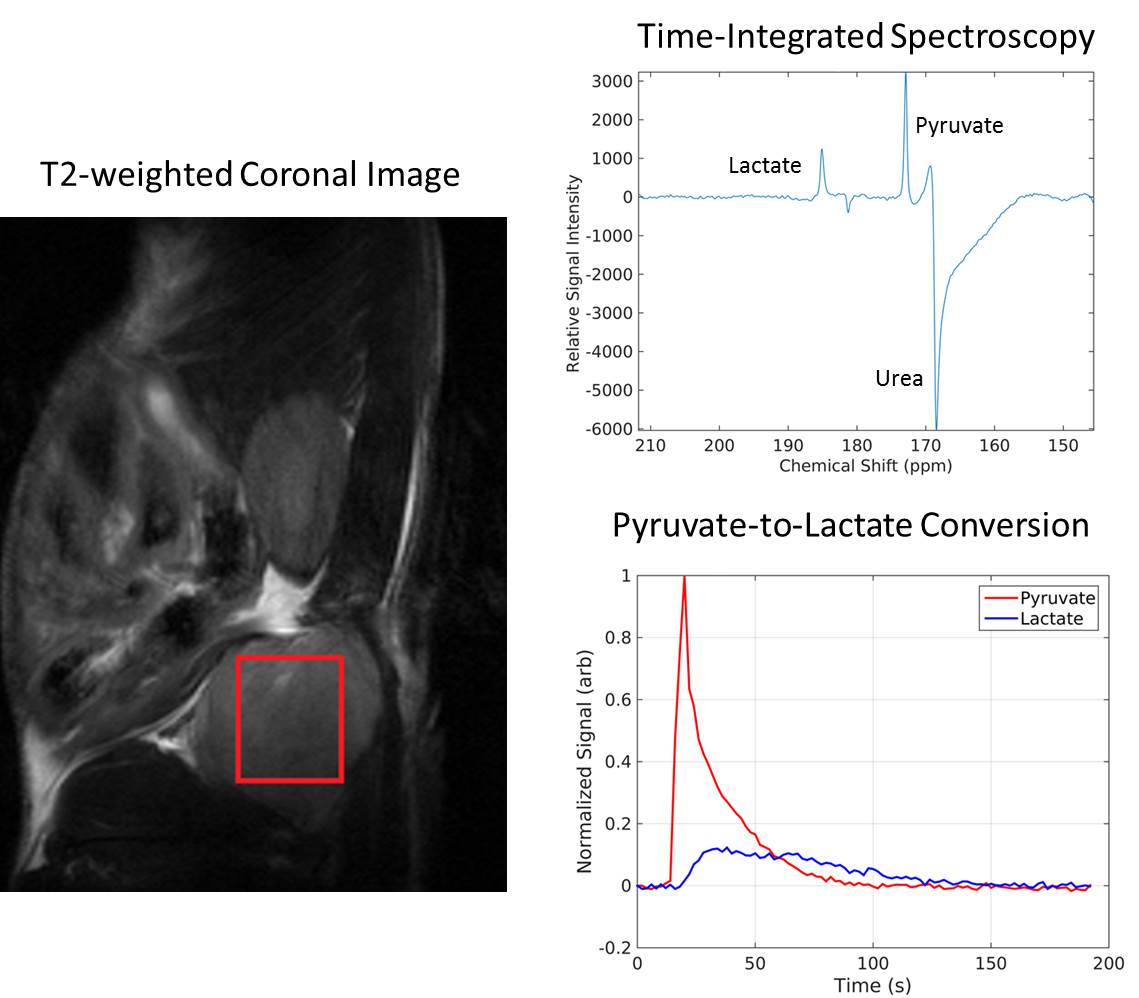
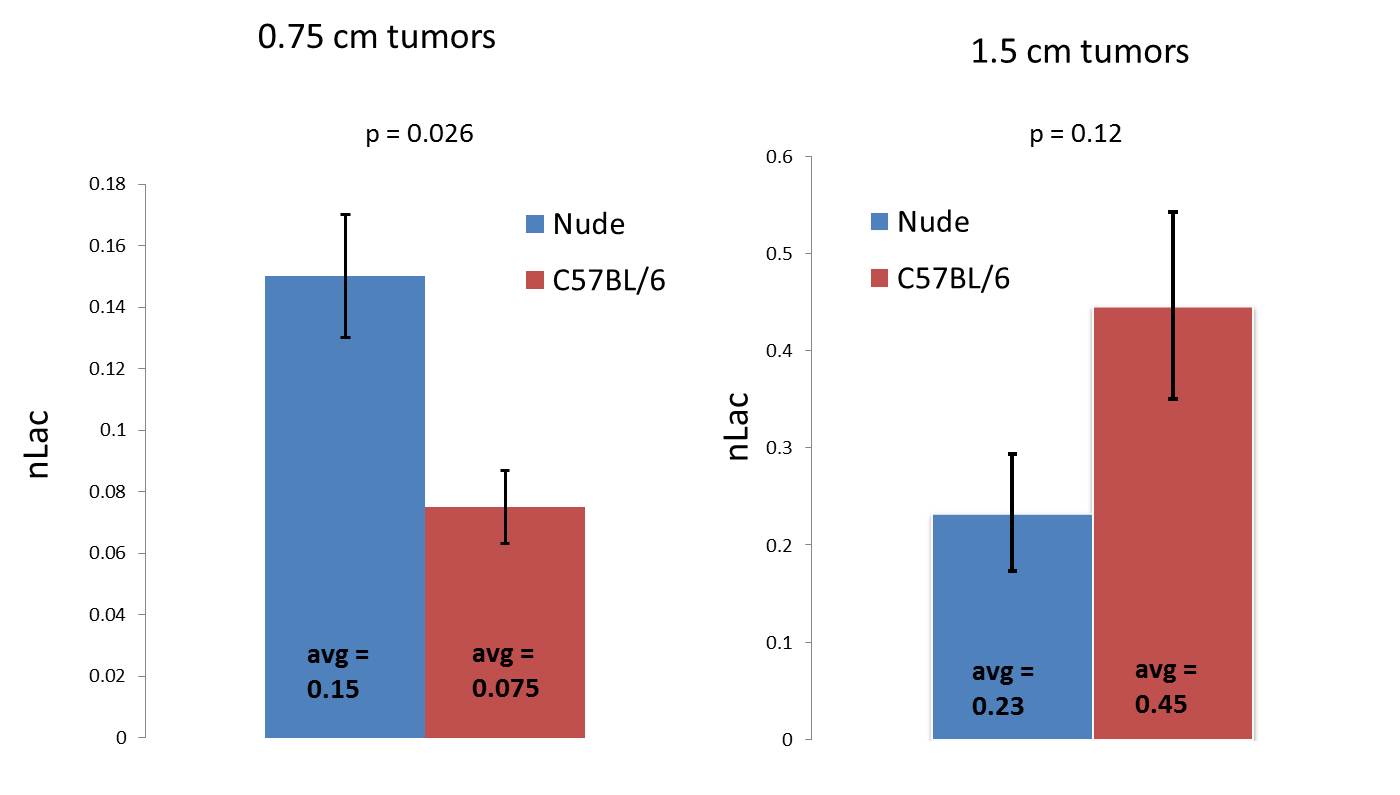
This tumor model system employed the K8484 pancreatic tumor line which is syngeneic to C57BL/6 background and is derived from mouse tumors with an oncogenic KRAS mutation (G12D) and a homozygous null mutation in p53. These cells were then transplanted into the flanks of both immunocompetent C57BL/6 mice and immunocompromised nude (nu/nu, Jackson labs) mice. Tumors were then allowed to grow until they reached sizes of 0.75 and 1.5 cm so that the immune-related metabolic properties of pancreatic cancer could be assessed at different time points in tumor progression. Hyperpolarized 13C-labeled pyruvate (80 mM) was injected into both cohorts of mice at both time points in tumor progression (n=2, n=4 and n=3, n=3), and real-time pyruvate-to-lactate conversion was observed in vivo. The metric nLac, calculated as the lactate pool size normalized by the total pool size (lactate + pyruvate), was employed in the hyperpolarized imaging experiment to assess how glycolytic a given tumor is.In addition, the 1.5 cm flank tumors (n=5, n=5) were resected then subjected to high-resolution 1H nuclear magnetic resonance (1H-NMR) metabolomics for both cohorts of mice. The samples were homogenized (methanol:water 2:1), lyophilized, and immersed in D2O, and NMR spectroscopy was implemented to characterize the water-soluble portion of the metabolome using a Bruker 500 MHz NMR spectrometer coupled with a cryo-probe.Results
At the earlier time point in tumor progression, the nude mice were more glycolytic than the immunocompetent mice by a factor of 2.0 (p = 0.026). However, at the later point in tumor progression, we observe that the immunocompetent mice were more glycolytic by a factor of 1.9. In addition, higher baseline metabolic activity was observed in the ex vivo tissue samples taken from the immunocompetent C57BL/6 mice than the immunocompromised nude mice. In particular, we observed statistically significant upregulation of lactate (p=0.020), alanine (p=0.014), creatine (p=0.00013), total choline (p=0.046), glutamate (p=0.018), glutathione (p=0.12), taurine (p=0.012), glycine (p=0.015), methionine (p=0.0015), and aspartate (p=0.0033).Discussion
The immune cells located in the tumor microenvironment, present in the immunocompetent mice but missing in the nude mice, may contribute in some way to the metabolic function of the tumor. A hematoxylin and eosin stain of the tumor tissue samples taken at the later time point in tumor progression exhibits that the immune cells readily infiltrate the tumor in the immunocompetent mouse but stay restricted to the periphery in the immunocompromised mouse. Further imaging studies are currently underway to validate these data. In addition, high-resolution 1H NMR metabolomics and hematoxylin and eosin staining are being performed on the tumors from the earlier time point in tumor progression to see if the ex vivo data at this earlier time point corroborates the in vivo data.Conclusion
We see that the immune environment in which a pancreatic tumor is harvested significantly alters the metabolic function of that tumor. In particular, higher baseline metabolic activity and higher glycolytic dependence is observed in 1.5 cm tumors grown in immunocompetent mice than from 1.5 cm tumors grown in immunocompromised mice, but this trend is not observed in earlier stages of tumor progression. Further study is underway so that this phenomenon is understood in a more mechanistic way.Acknowledgements
No acknowledgement found.References
1. American Cancer Society. Cancer Facts & Figures, 2015. Atlanta, Georgia: American Cancer Society; 2015.
2. Laheru D, Jaffee EM. Immunotherapy for Pancreatic Cancer – Science Driving Clinical Progress. Nature Reviews Cancer. 2005; 5: 459-467.
3. Feig C, Jones JO, Kraman M, et al. Targeting CXCL12 from FAP-expressing Carcinoma-associated Fibroblasts Synergizes with Anti–PD-L1 Immunotherapy in Pancreatic Cancer. Proceedings of the National Academy of Sciences of the United States of America. 2013; 110(50): 20212-20217.
Figures