3079
In-vivo imaging of glutamine metabolism to the oncometabolite 2-hydroxyglutarate in IDH1/2 mutant tumors1Radiology, Memorial Sloan Kettering Cancer Center, New York City, NY, United States, 2Molecular Pharmacology Program, Memorial Sloan Kettering Cancer Center, New York City, NY, United States, 3Donald B. and Catherine C. Marron Cancer Metabolism Center, Memorial Sloan Kettering Cancer Center, New York City, NY, United States, 4Cancer Biology and Genetics Program, Memorial Sloan Kettering Cancer Center, New York City, NY, United States
Synopsis
2-hydroxyglutarate (2-HG) is an oncometabolite that accumulates in various cancers as a result of mutations in the isocitrate dehydrogenase (IDH1/2) genes and can be used as a biomarker for diagnosis. In this work, we demonstrate the fast conversion of glutamine to 2-HG and use it as a basis for developing a 2-HG in-vivo detection method. Using hyperpolarized [1-13C] glutamine and magnetic resonance imaging (MRI), we present the non-invasive unambiguous detection of 2-HG formation with high specificity from glutamine in-vivo and real-time in IDH1 and IDH2 mutant tumors.
Purpose
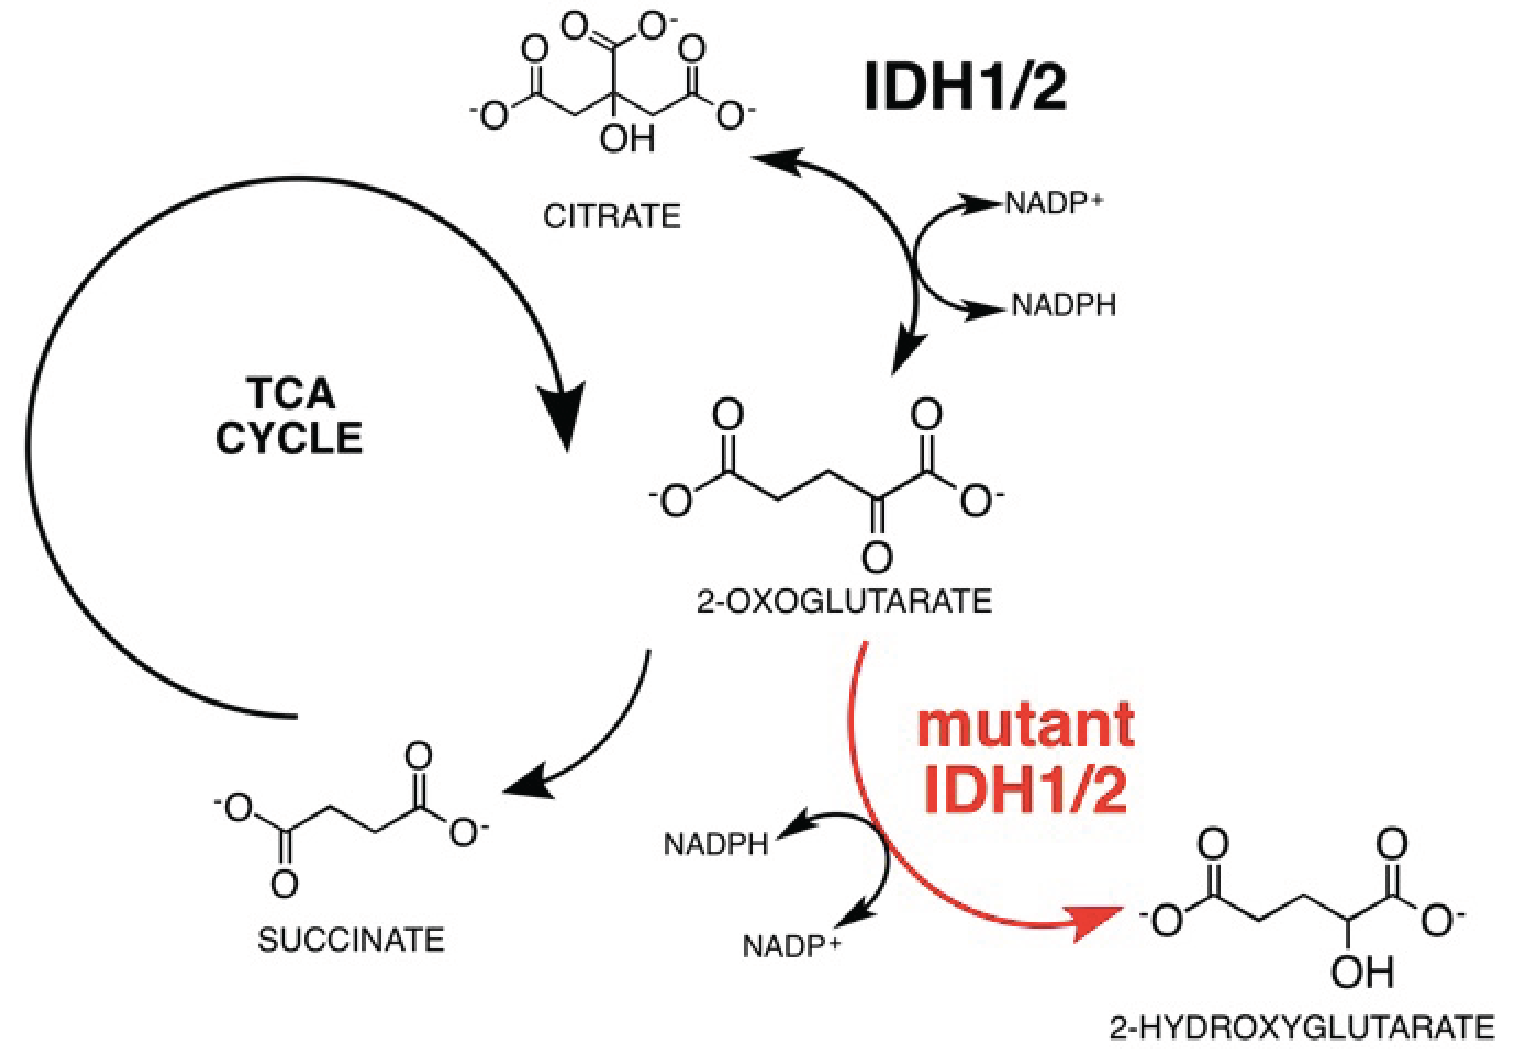
The oncometabolite 2-hydroxyglutarate (2-HG) is a signature biomarker in various cancers where it accumulates due to mutations in the isocitrate dehydrogenase (IDH1/2) (Fig. 1) genes and detection of 2-HG can be a valuable tool for diagnosis and prognosis of cancers carrying IDH1/2 mutations (mIDH1/2)1,2. Currently, pool sizes of 2-HG can be detected via 1H-MRS though with limitations due to sensitivity, as well as ambiguity resulting from overlapping resonances3,4. Moreover, identifying the source of 2-HG requires a functional approach utilizing a substrate of interest. The purpose of this work is to develop a hyperpolarized (HP) MRI methodology with high sensitivity and specificity to detect the production of 2-HG in-vivo and real-time in mIDH1/2 tumors.Methods
We started by demonstrating a direct link between glutamine metabolism and 2-HG production in chondrosarcoma mIDH1 (JJ012) and mIDH2 (CS1) cells in-vitro and in-vivo via metabolic flux analysis (MFA) using mass spectrometry and isotopic labeling. Based on this, we proposed that production of 2-HG from glutamine could be detected in-vivo and real-time using HP-MRI and focused on the following experiments:
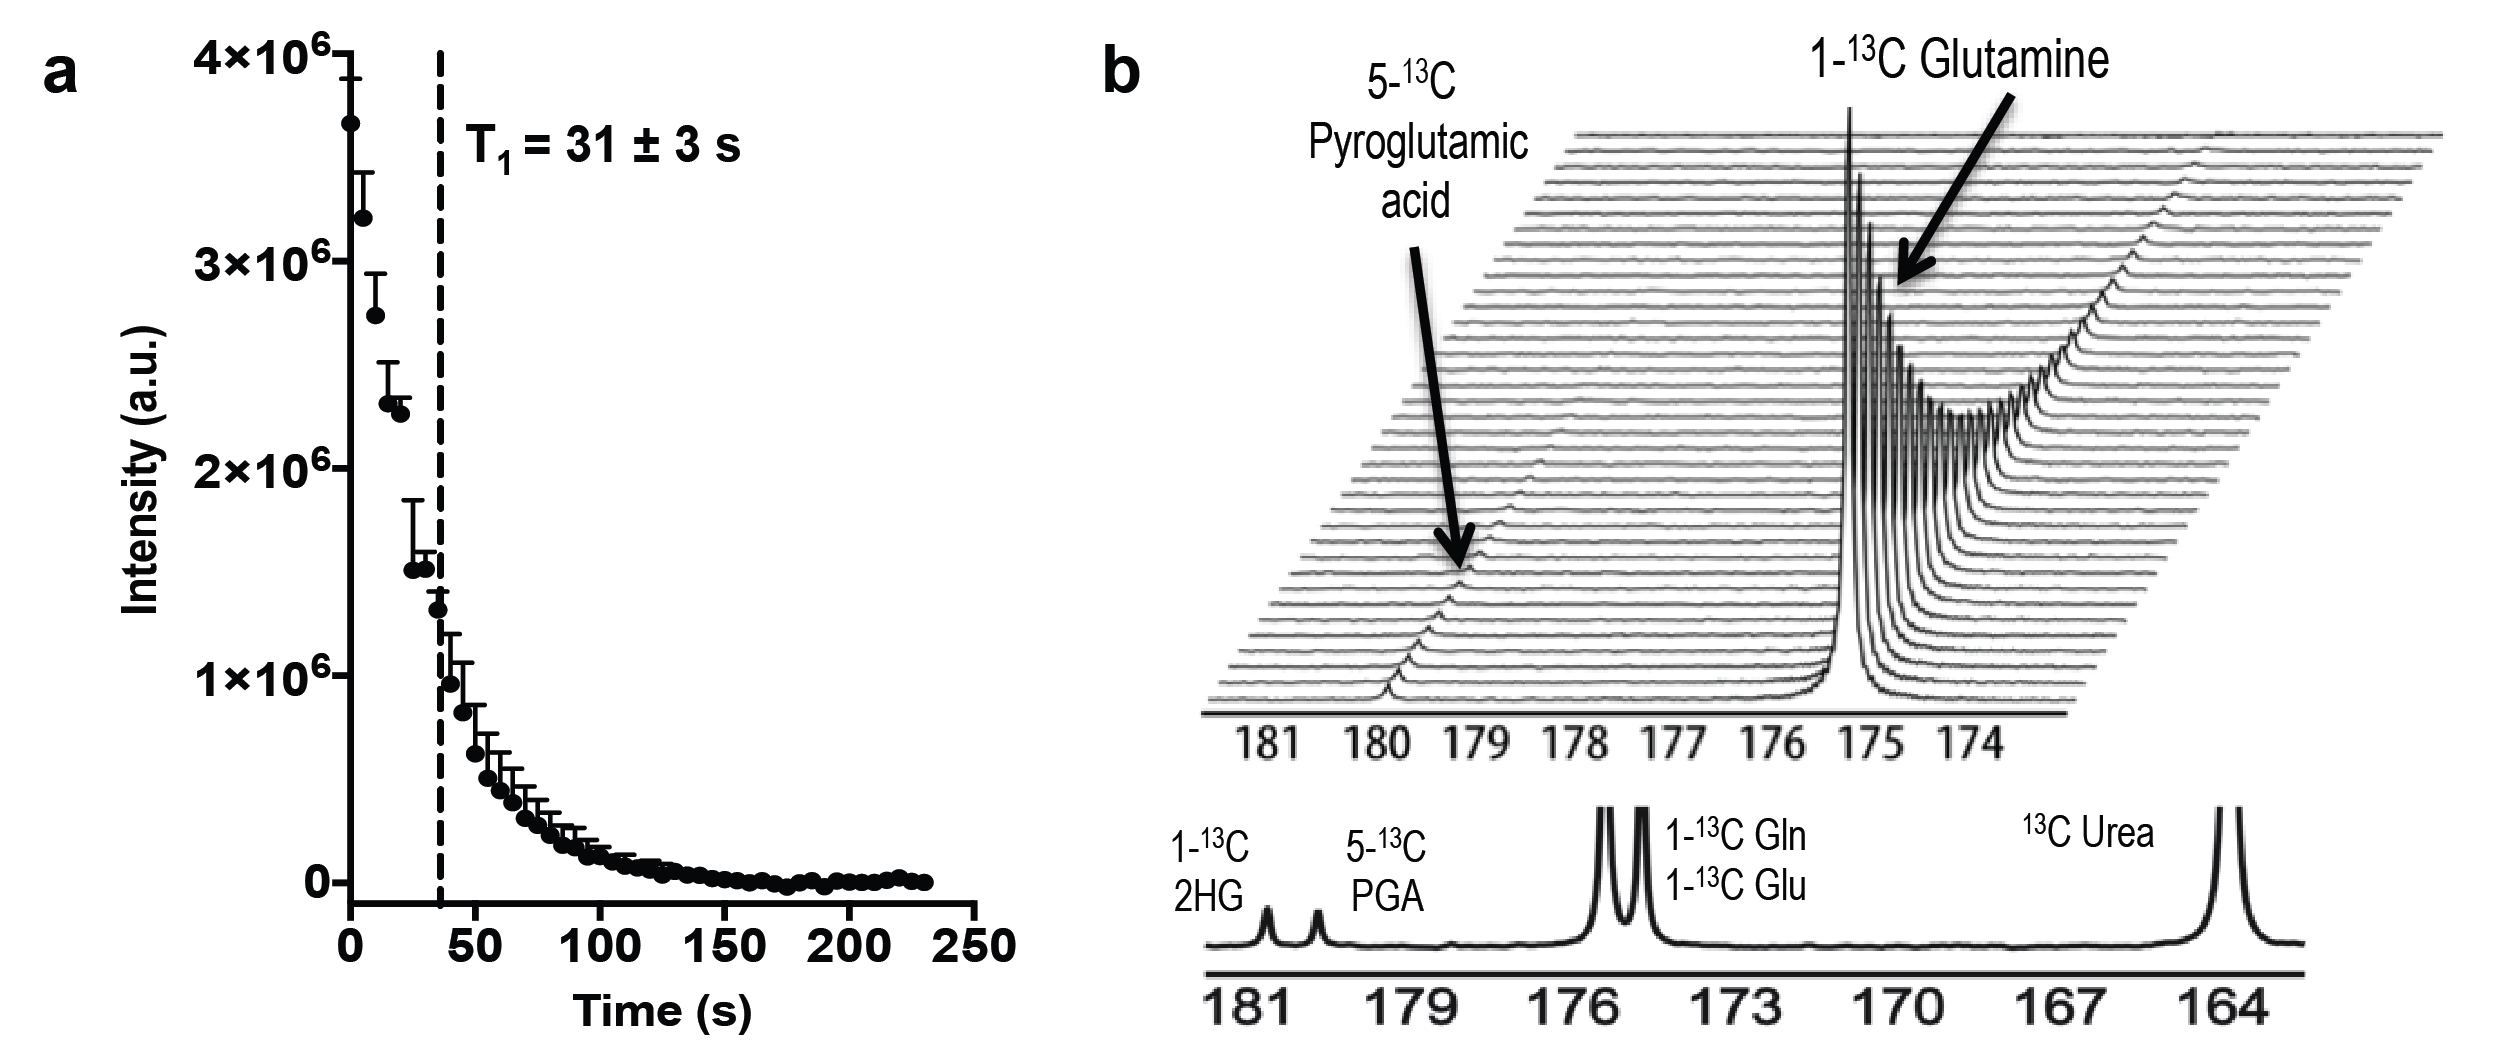
1) Hyperpolarization of glutamine: [1-13C]-glutamine was dissolved in NaOH, combined 1:1 with a mixture of glycerol, OX063 radical and Gd-DOTA, polarized in a SpinLab DNP polarizer (3.35T) for >1 hour and rapidly dissolved in Tris buffer with EDTA. Polarization quantification was carried immediately after dissolution on a 1T NMR spectrometer equipped with a dual-tuned 1H-13C coil. Apparent relaxation time (T1) was estimated from sequential spectra. Thermal polarization was determined from the average spectrum of 256 scans. Final polarization values have been corrected for flip angles and the apparent T1.
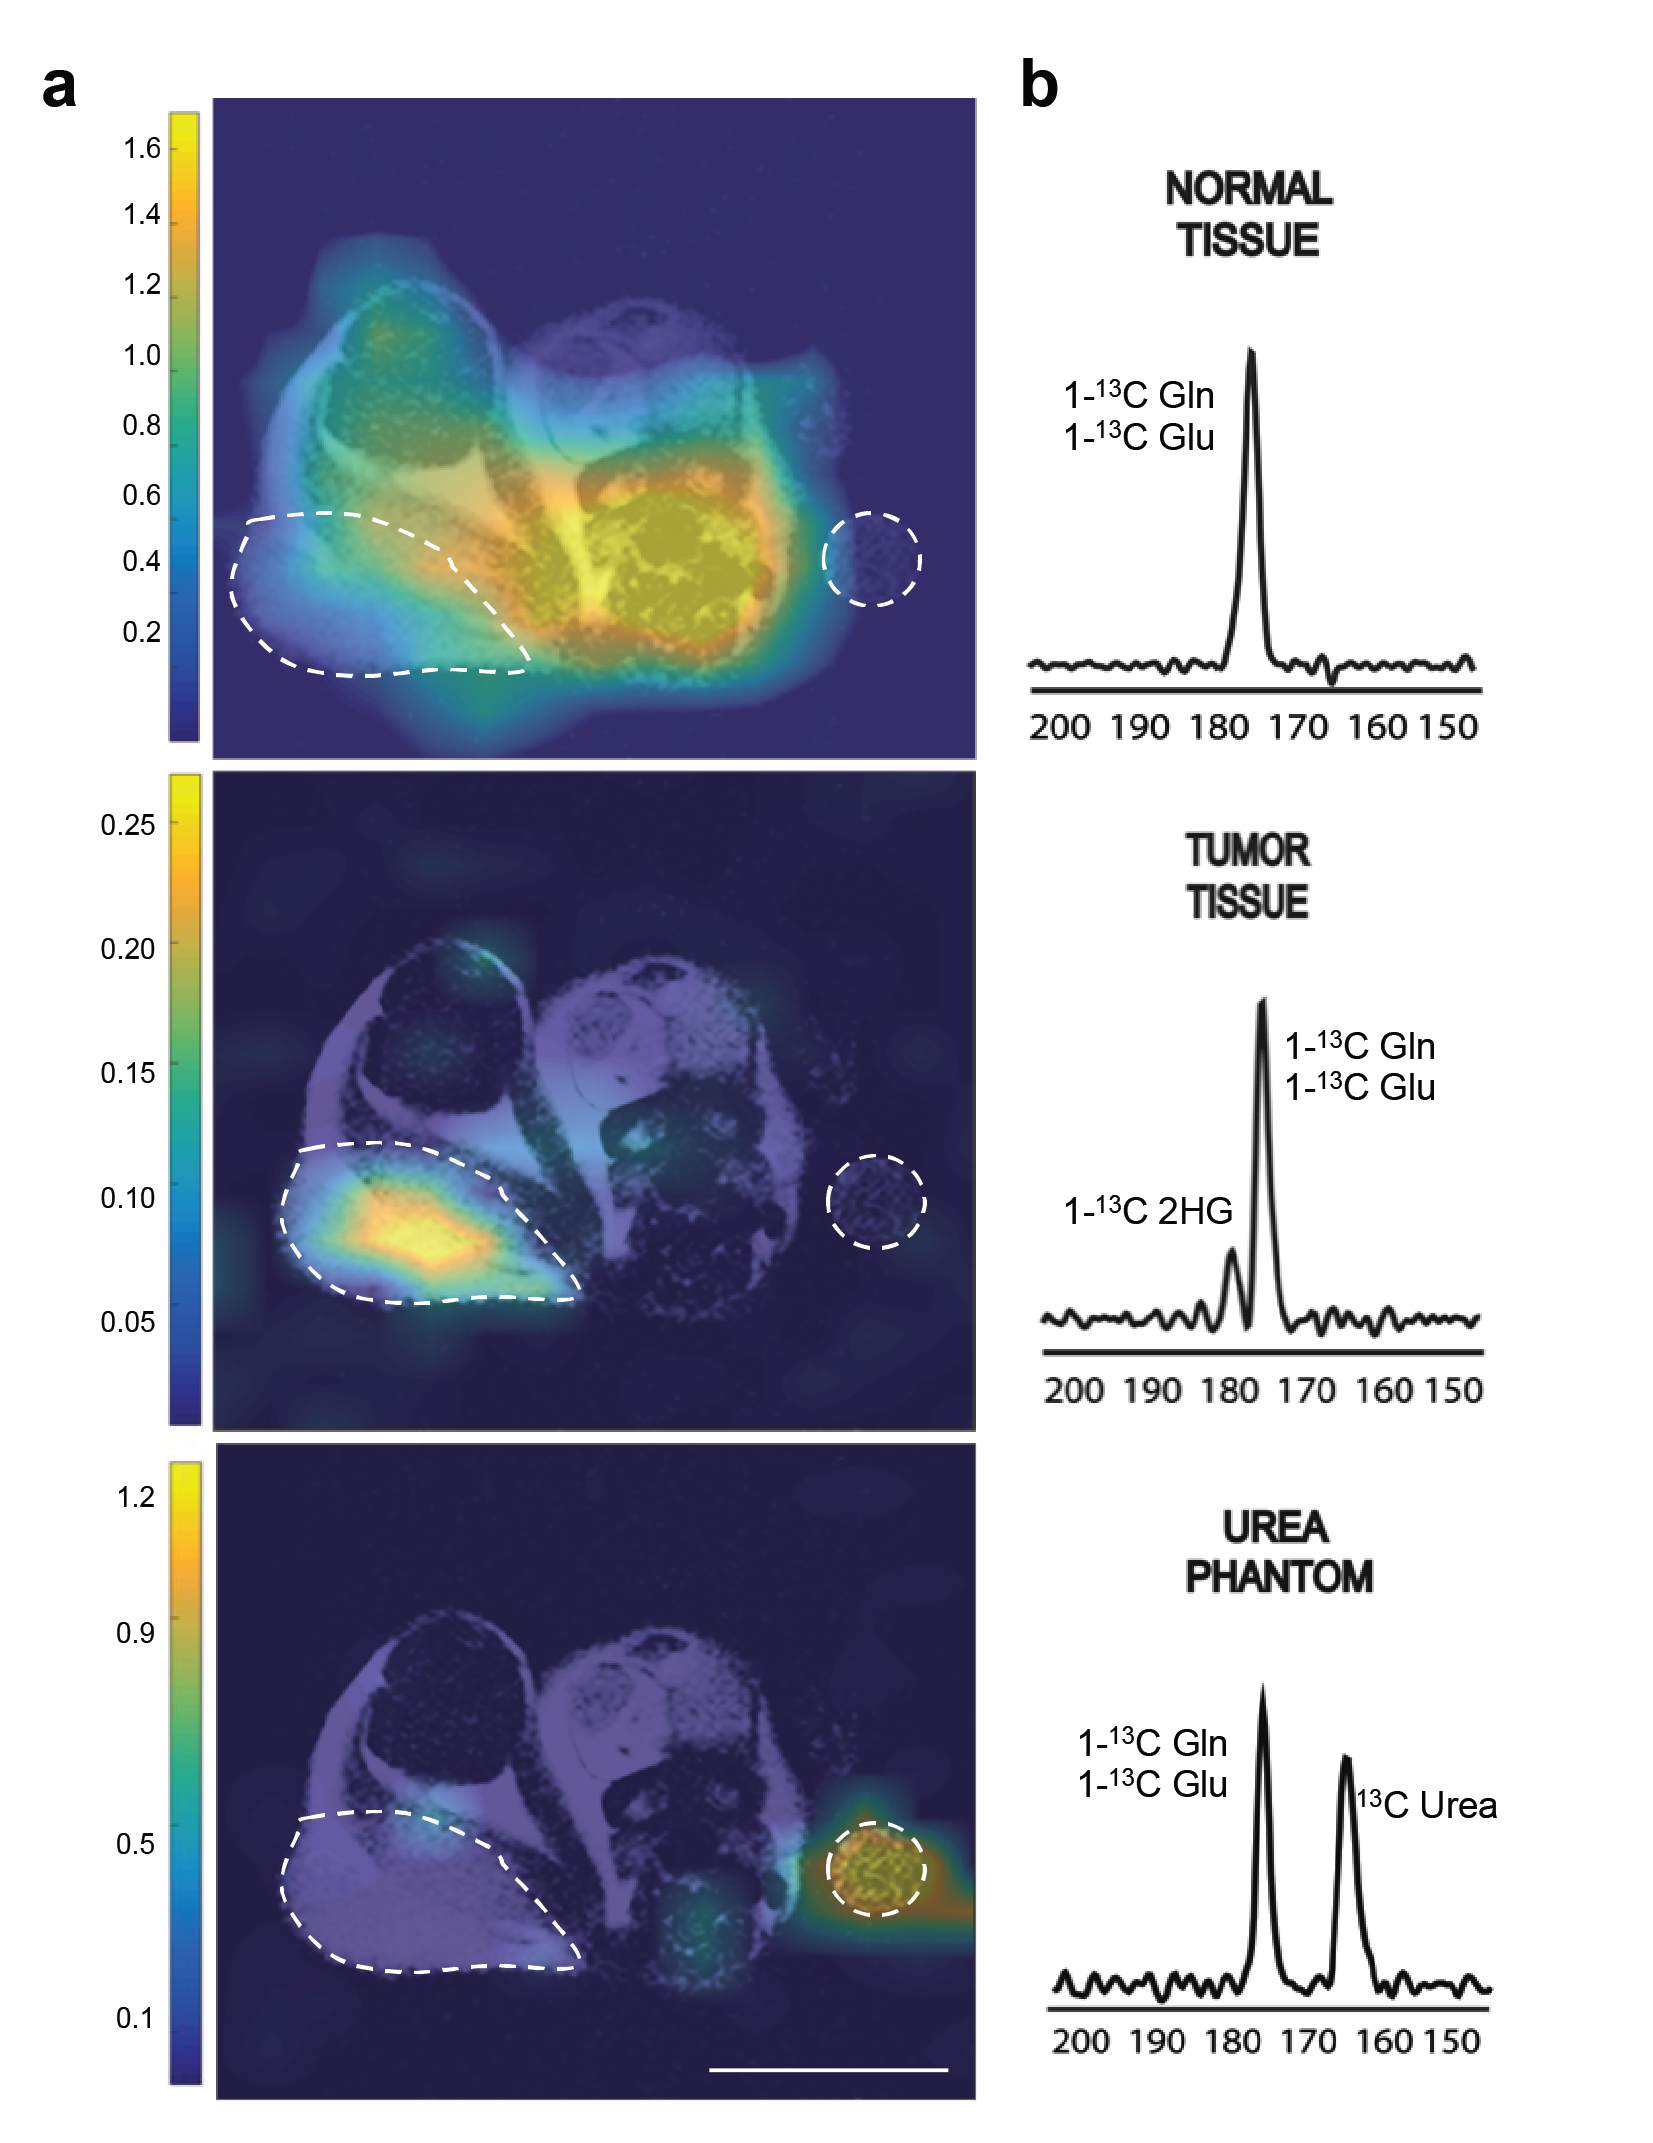
2) In-vivo imaging of HP [1-13C]-2-HG: All in-vivo hyperpolarized experiments were carried on a 1T permanent magnet animal imaging system using a dual-tuned 1H-13C volume coil. All experiments were approved by our institutional animal care and use committee (IACUC). Tumor location was determined using 1H-T2 anatomical imaging (Fig 3a). mIDH1/2 tumor bearing mice were intravenously injected with HP [1-13C]-glutamine in buffer 15s post dissolution. A total of 400 µL of HP solution was injected over 12s. 13C 2D CSI was acquired 16s after the start of injection for 8s with 20° constant flip angle, TR=220ms, 6x6 in-plane resolution, 32x32 mm FOV, and 20 mm slab thickness.
Results and Discussion
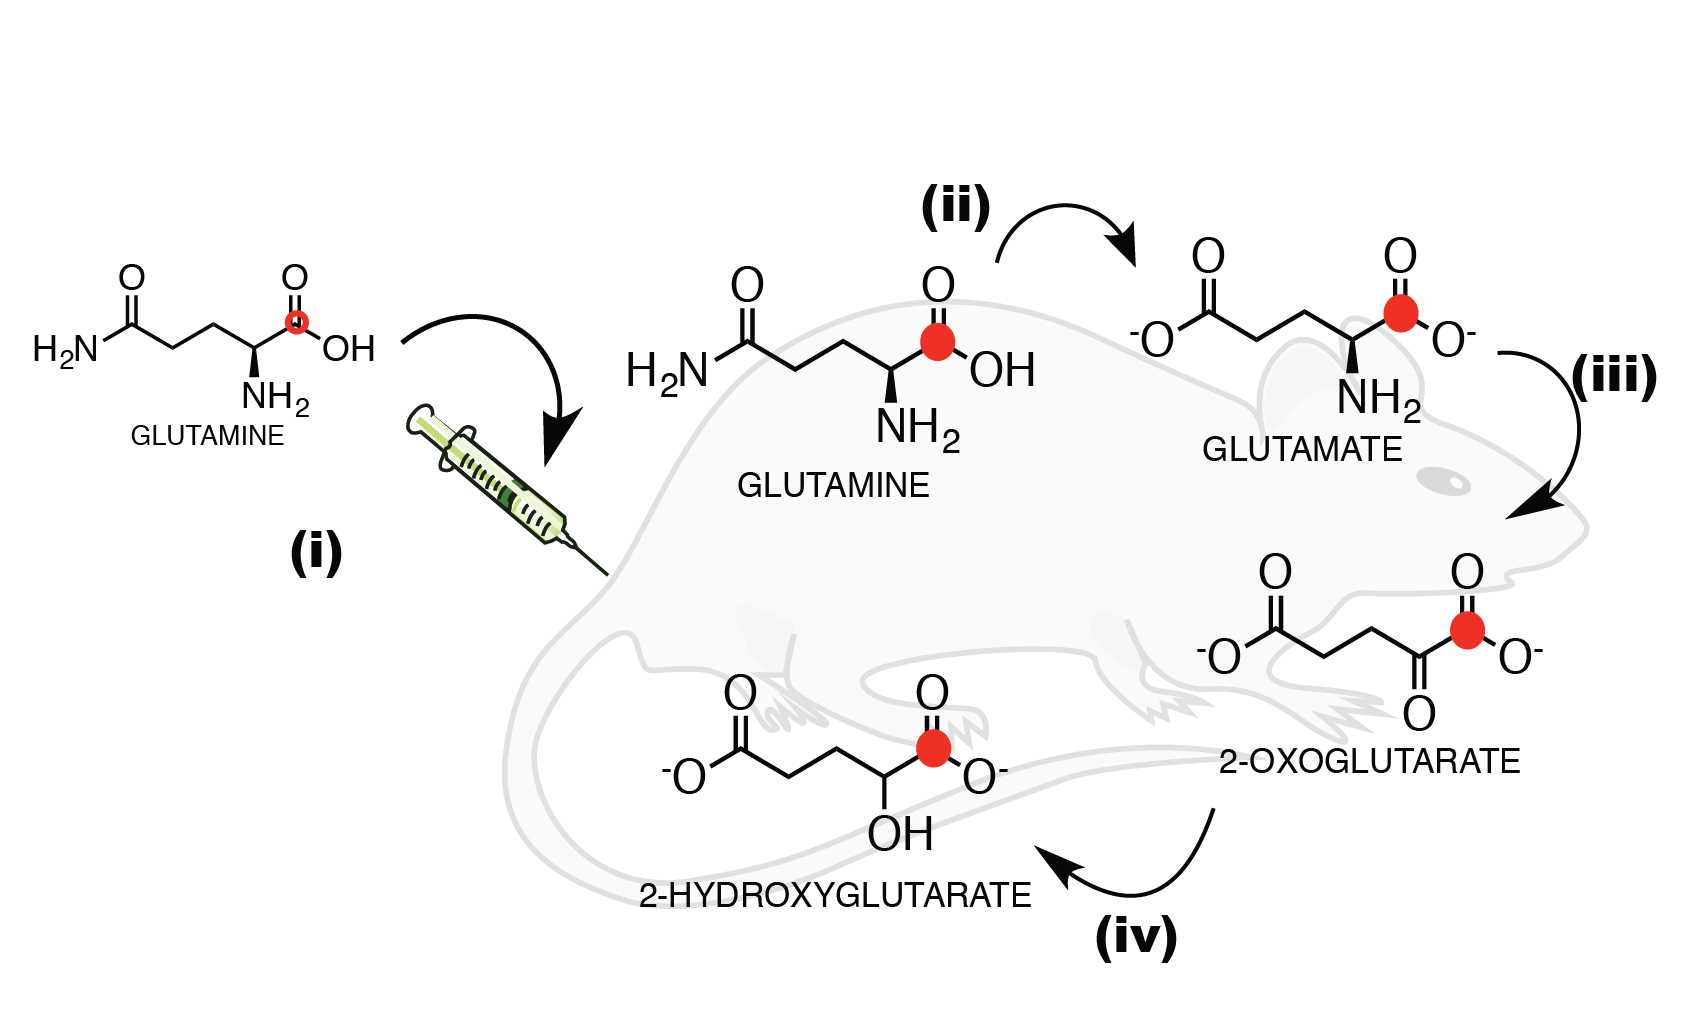
We used MFA to demonstrate that kinetics of 2-HG production from glutamine are fast enough to allow detection of a HP 2-HG signal in-vivo in both mIDH1 and mIDH2 chondrosarcoma cells. The usefulness of glutamine as an imaging probe depends on the achievable polarization levels and the T1 relaxation time. High levels of polarization are necessary because the signal needs to be carried from dissolution, injection, and the conversion of glutamine to 2-HG (Fig 2). In our experiments, polarization levels immediately after dissolution reached 34.7±7% with a T1 of 31±3s (Fig 3a). In addition, we minimized the formation of pyroglutamate, which resonates 1 ppm away from 2-HG (Fig 3b), eliminating potential unambiguity in in-vivo experiments.
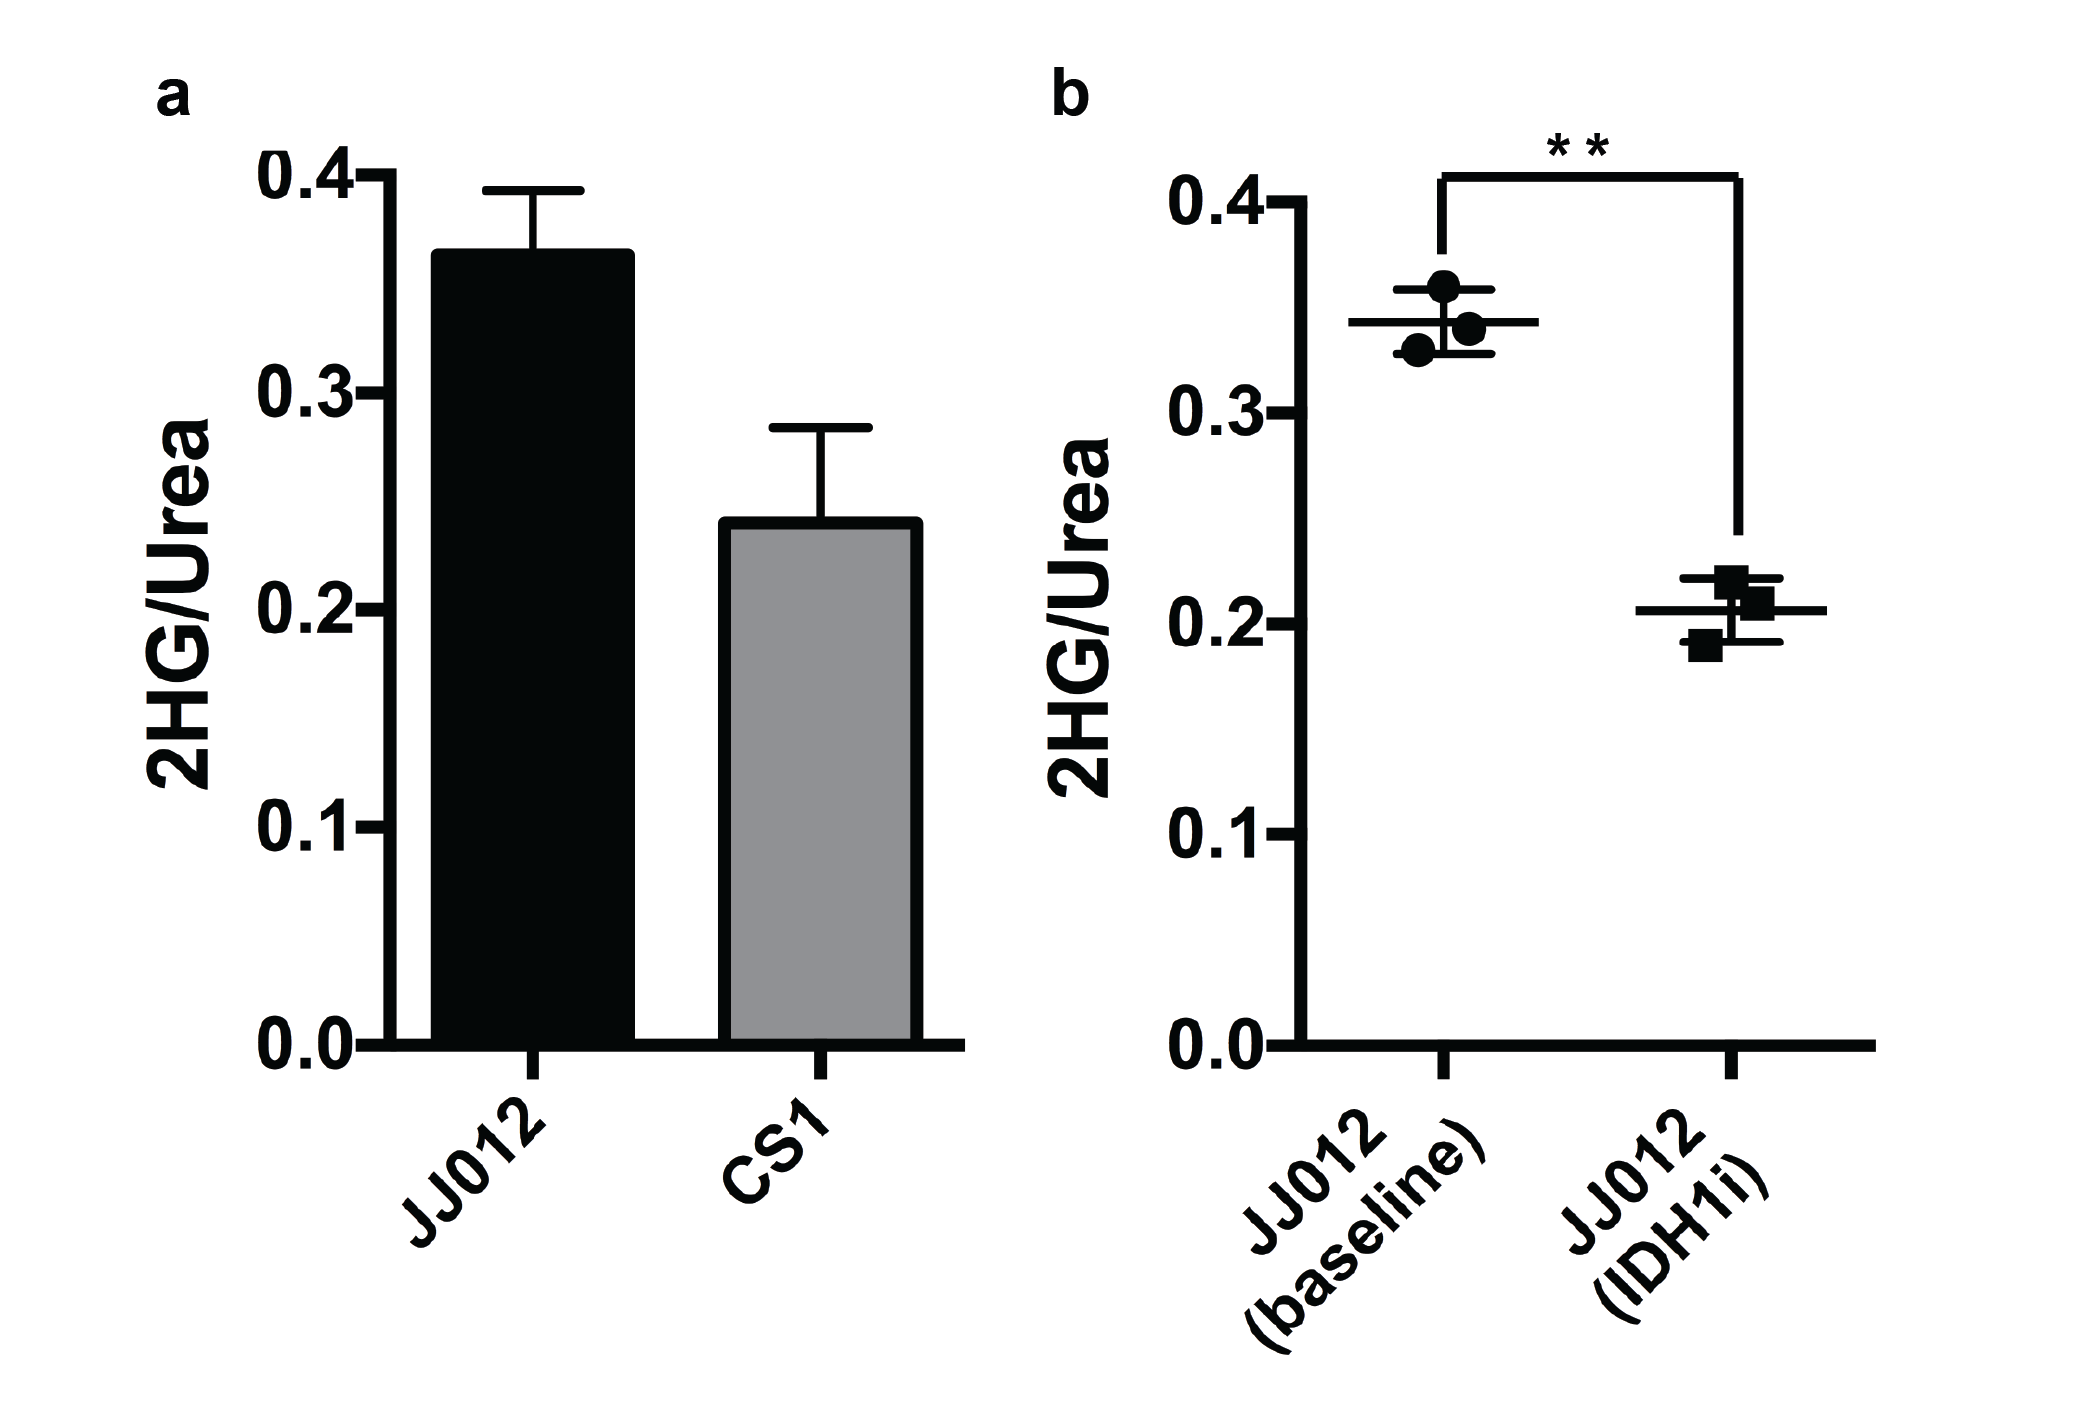
In animal experiments the [1-13C]-Glutamine and [1-13C]-Glutamate signals (175 ppm, Fig. 2c) can be observed over the whole mouse body (Fig 4a) although these resonances are not resolvable because of limitations in spectral resolution at low field. An additional resonance is observed only in tumor regions at 180.8 ppm (Fig. 4b), which we confirmed is [1-13C]-2-HG in tumor extract studies. It is important to note that this resonance was only detectable in tumor regions of mIDH1/2 models, but not in tumors with normal IDH function, further confirming it is not from contaminating resonances. Moreover, the quantitative difference in 2-HG levels between mIDH models, as determined by MFA, was reflected in the HP 2-HG signal in-vivo (Fig 5a). Finally, JJ012 xenografts treated with a selective IDH1 inhibitor5 showed a decrease in the HP 2-HG resonance compared to untreated baseline (42% lower when normalized to13C-urea, P<0.05, Fig 5b). Our results combined, strongly demonstrate that we can unambiguously observe the generation of HP [1-13C]-2-HG from HP glutamine and also measure response to therapeutic intervention.
Conclusions
We exploited the interconnection of glutamine and 2-HG to develop a method for in-vivo imaging of 2-HG via HP-MRI using hyperpolarized [1-13C]-glutamine as imaging probe. This work demonstrates the non-invasive detection of 2-HG formation from glutamine in-vivo in mIDH1 and mIDH2 tumors unambiguously, with high sensitivity, and in real time thus addressing the limitations of 1H-MRS3,4. Moreover, by using glutamine as the source for imaging 2-HG, this method has the potential to assess whether 2-HG is formed from glutamine in-vivo. This could have great implications for developing treatment strategies in the setting of IDH mutations.Acknowledgements
The authors gratefully acknowledge Christian Felt who helped with developing MATLAB scripts for data reconstruction. The authors would like to acknowledge the Geoffrey Beene Foundation, the NIH/NCI Cancer Center Support Grant P30 CA008748 (PI: Thompson) and NIH/NIBIB R00 EB014328 (PI: Keshari), the Center for Molecular Imaging and Nanotechnology (CMINT) at Memorial Sloan Kettering Cancer Center.References
1. L. Dang et al., Cancer-associated IDH1 mutations produce 2-hydroxyglutarate. Nature 462, 739-744 (2009).
2. K. E. Yen, M. A. Bittinger, S. M. Su, V. R. Fantin, Cancer-associated IDH mutations: biomarker and therapeutic opportunities. Oncogene. 2010;29:6409-6417.
3. O. C. Andronesi et al., Detection of oncogenic IDH1 mutations using magnetic resonance spectroscopy of 2-hydroxyglutarate. J Clin Invest. 2013;123:3659-3663.
4. W. B. Pope et al., Non-invasive detection of 2-hydroxyglutarate and other metabolites in IDH1 mutant glioma patients using magnetic resonance spectroscopy. J Neurooncol. 2012;107:197-205.
5. Rohle, Dan, et al., An inhibitor of mutant IDH1 delays growth and promotes differentiation of glioma cells." Science. 2013;340(6132):626-630.
Figures