3073
Improved tracking and quantification of SPIO-labeled cells using bSSFP with compressed sensing TurboSPI1Biomedical Translational Imaging Centre (BIOTIC), Halifax, NS, Canada, 2Physics, Dalhousie University, Halifax, NS, Canada, 3Diagnostic Radiology, Dalhousie University, Halifax, NS, Canada, 4Microbiology, Dalhousie University, Halifax, NS, Canada
Synopsis
Understanding immune cell behaviour is important for evaluating therapeutic response in pre-clinical models. We monitor cell migration in a mouse model of cervical cancer by labeling cells with superparamagnetic iron oxide (SPIO). Simultaneous pre-clinical PET/MRI confirmed that the balanced steady-state free precession (bSSFP) sequence lacks specificity to SPIO-labeled cells within the tumor. We tested TurboSPI, a multi-echo single point imaging technique with compressed sensing that provides high temporal resolution 3D R2* mapping in under 45 minutes. These maps exhibit superior SPIO specificity compared to bSSFP images and enabled us to do both qualitative and quantitative cell tracking.
Introduction
Studying the recruitment of immune cells in vivo is crucial to understanding their role in the cancer immunogenic response, particularly during therapy. Cells can be labeled with superparamagnetic iron oxide (SPIO) and imaged using MRI1. Balanced steady-state free precession (bSSFP) has been previously used for cell tracking, primarily due to its high signal to noise ratio (SNR) and sensitivity to magnetic susceptibility effects2. Unfortunately, the bSSFP sequence is known to lack specificity to iron versus other negative contrast, and allows only semi-quantitative analysis3.
This work uses a multi-echo single point imaging (SPI) sequence, TurboSPI4 to quantify in vivo SPIO-labeled cytotoxic CD8+ T lymphocytes. Phase encoded sequences like SPI are capable of imaging fast decaying species but are often prohibitively slow. Combining compressed sensing (CS) with TurboSPI allows 3D high temporal resolution R2* mapping in 30-45 minutes5.
Methods
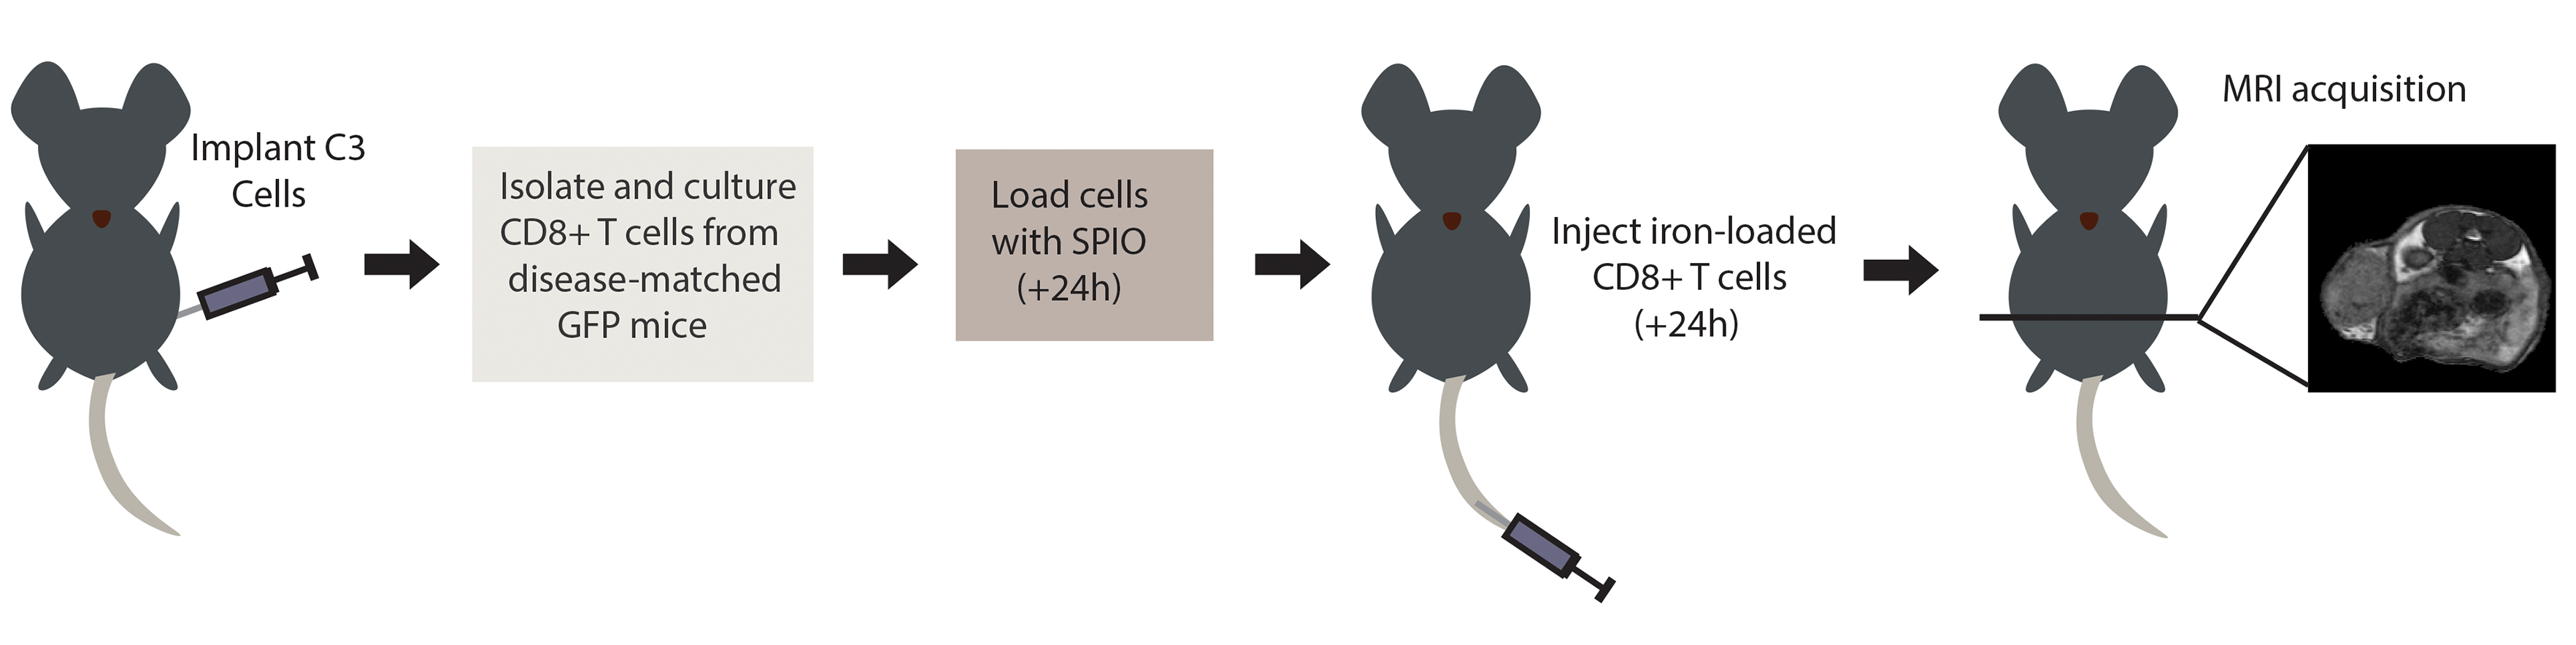
C57BL/6 mice (n=5) received a subcutaneous injection of 5x10⁵ cervical cancer (C3) cells in the left flank and were imaged 21 and 28 days post-implantation. CD8+ cytotoxic T cells were isolated from disease-matched mice, cultured in vitro for 7 days and passively loaded with Molday Rhodamine B SPIO particles (~30nm - Biopal, Worcester MA) for 24h. Mice received an i.v. tail injection of 8x10⁶ CD8+ T cells and were imaged ~24 hours post-injection (Figure 1).
All MR data were acquired on a 3T pre-clinical scanner (Agilent, Santa Clara, CA). BSSFP images are acquired with TR/TE = 8/4 ms, α= 30˚, NEX=4, 150μm isotropic voxels. The TurboSPI sequence is preceded by an FSE prescan guide image with matched parameters (TR/TEeffective= 250/10ms, ETL=8, 312μm in-plane resolution) to prescribe pseudo-random undersampling (R=8) for TurboSPI and constrain the iterative CS reconstruction5. The reconstruction and R2* mapping are performed with an in-house program in Matlab (Mathworks, Natick MA) using previously established methods5. The FSE guide image is registered to the bSSFP image and the resulting transformation is applied to the R2* map.
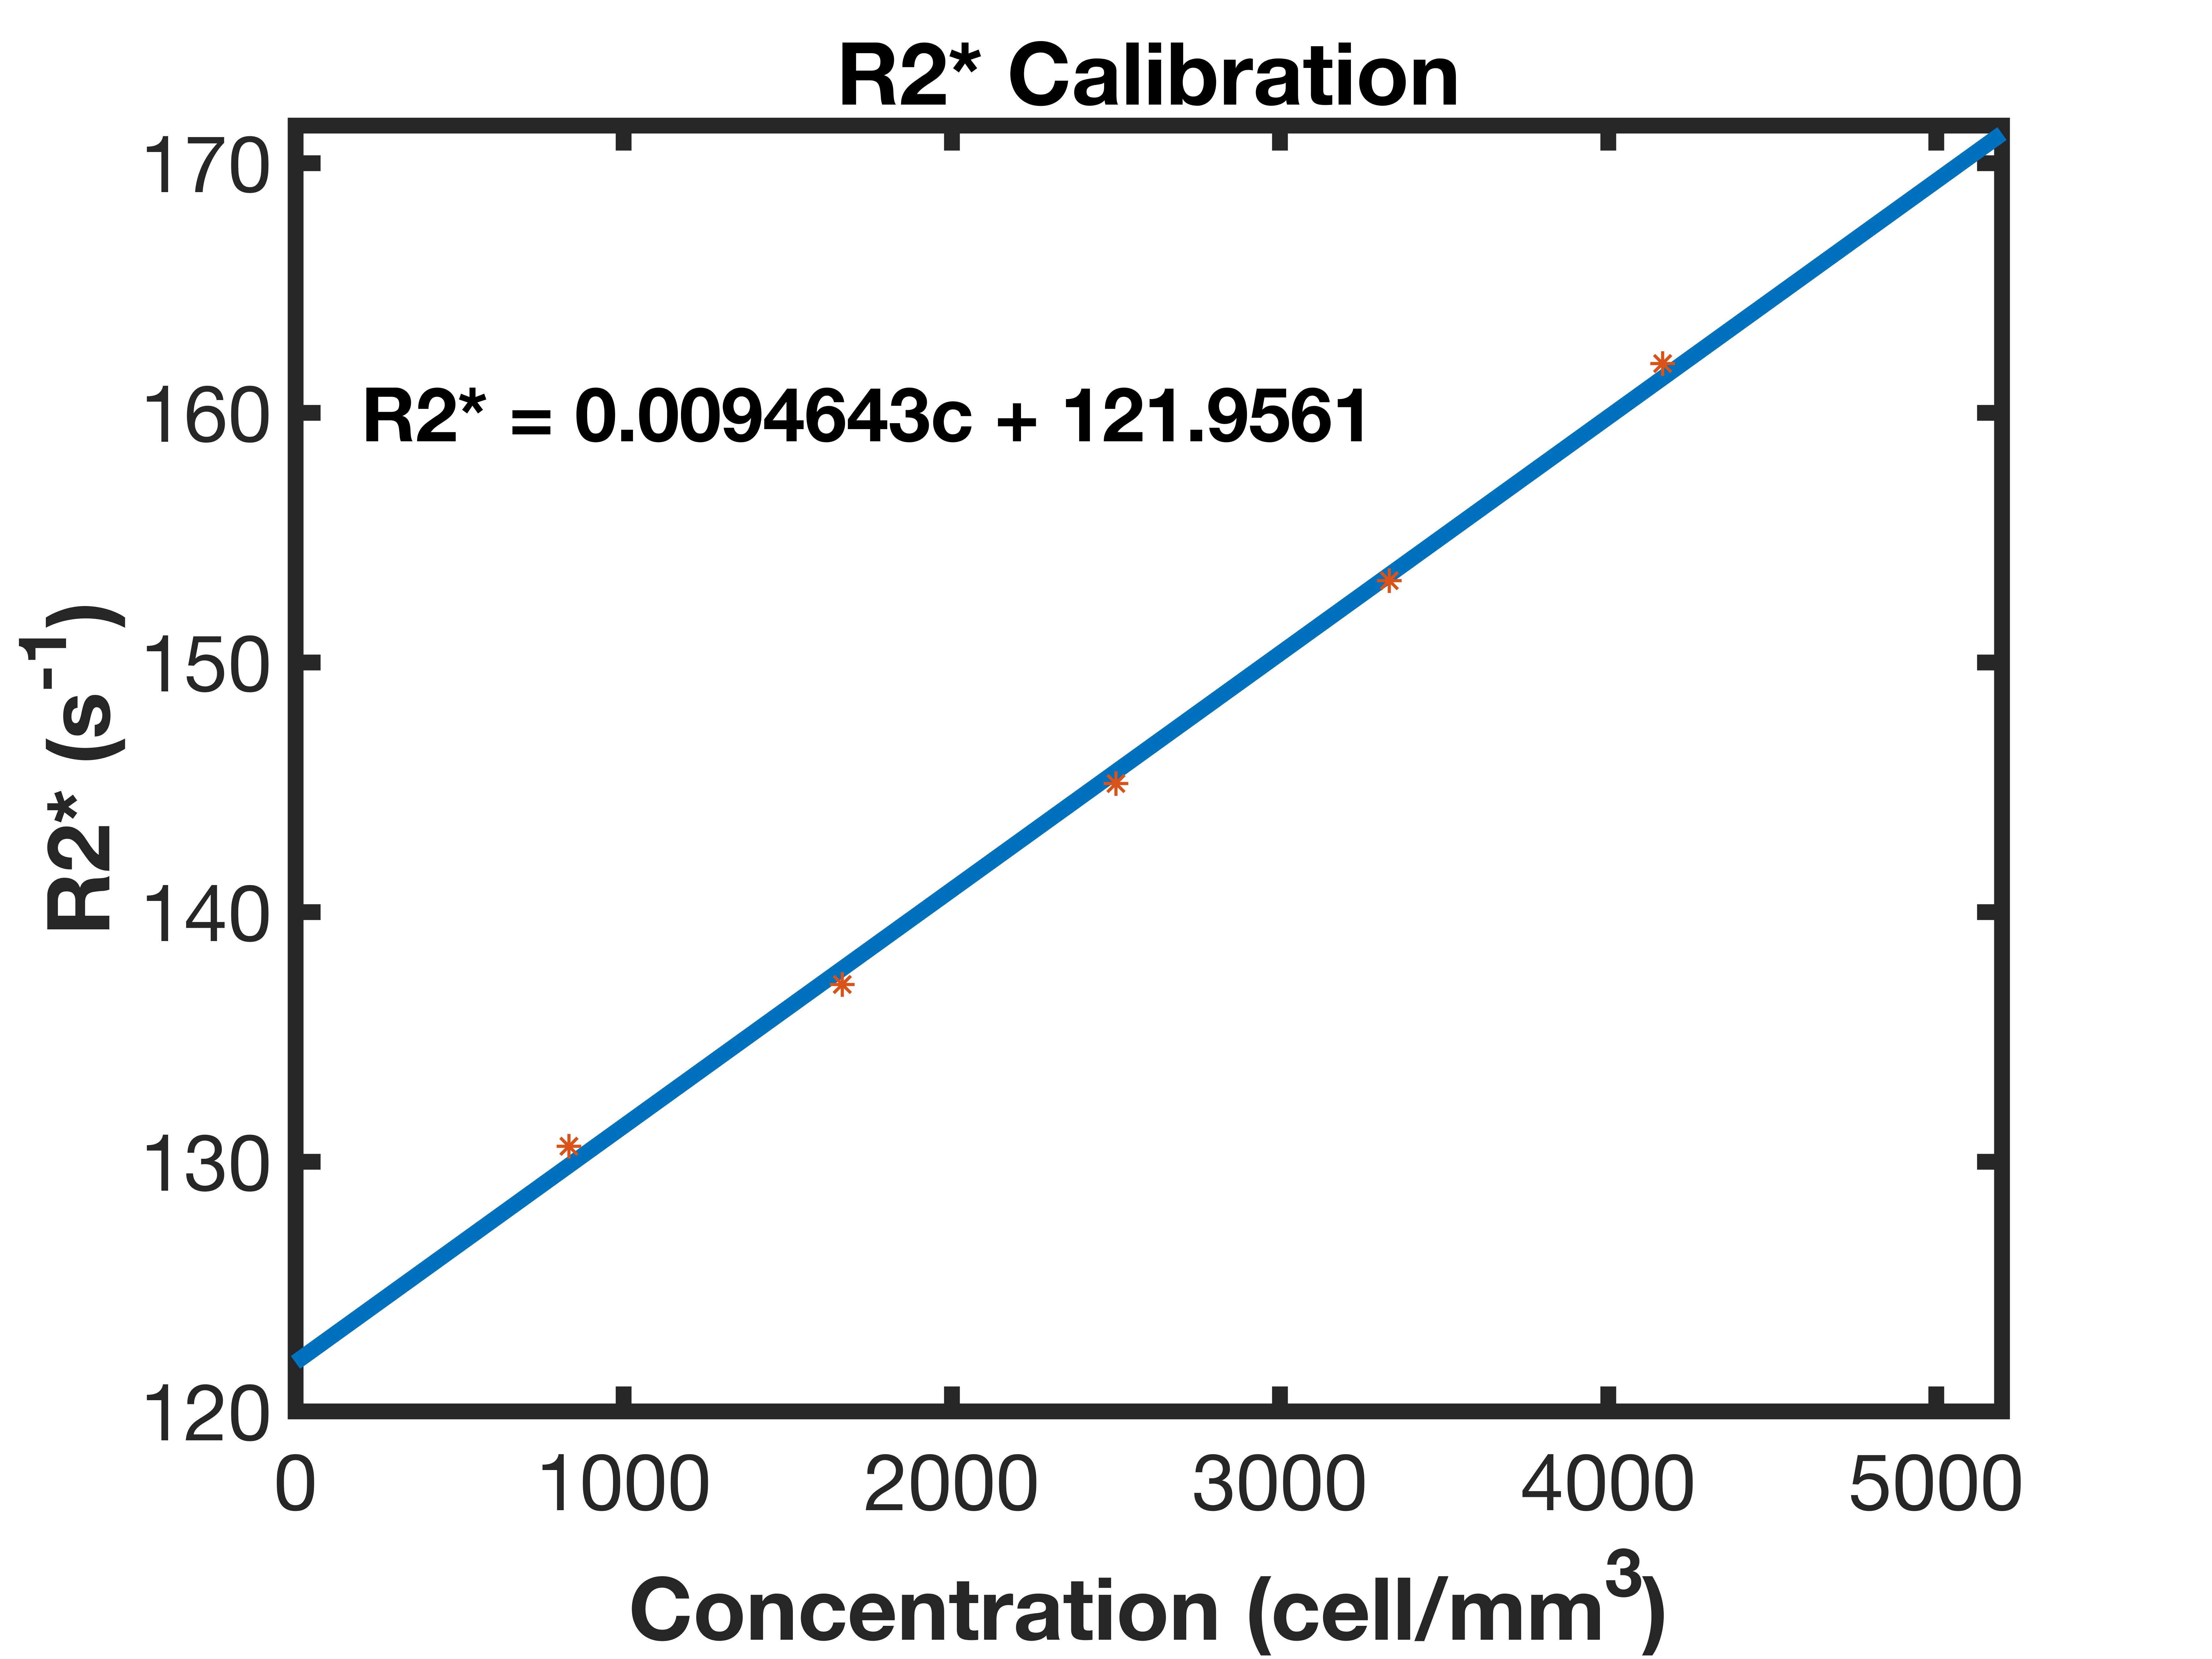
Measured R2* values can be converted into quantitative estimates of cell concentration based on a calibration curve (Figure 2). NMR tubes were prepared with known cell concentrations (1000-4000 cells/mm3) and bulk R2* values were calculated using NMR linewidths. In vivo cellular concentrations are then calculated from R2* maps and adjusted to the voxel size. Using a fully integrated simultaneous positron emission tomography (PET)/MRI system (NuPET, Cubresa, Winnipeg MB), PET data (~500μCi 18F-FDG injected, 50min uptake, 30min acquisition, 625μm isotropic voxels) were acquired simultaneously with bSSFP MR to assess tissue necrosis. PET data was aligned with MR images using VivoQuant (Invicro, Boston MA).
Results and Discussion
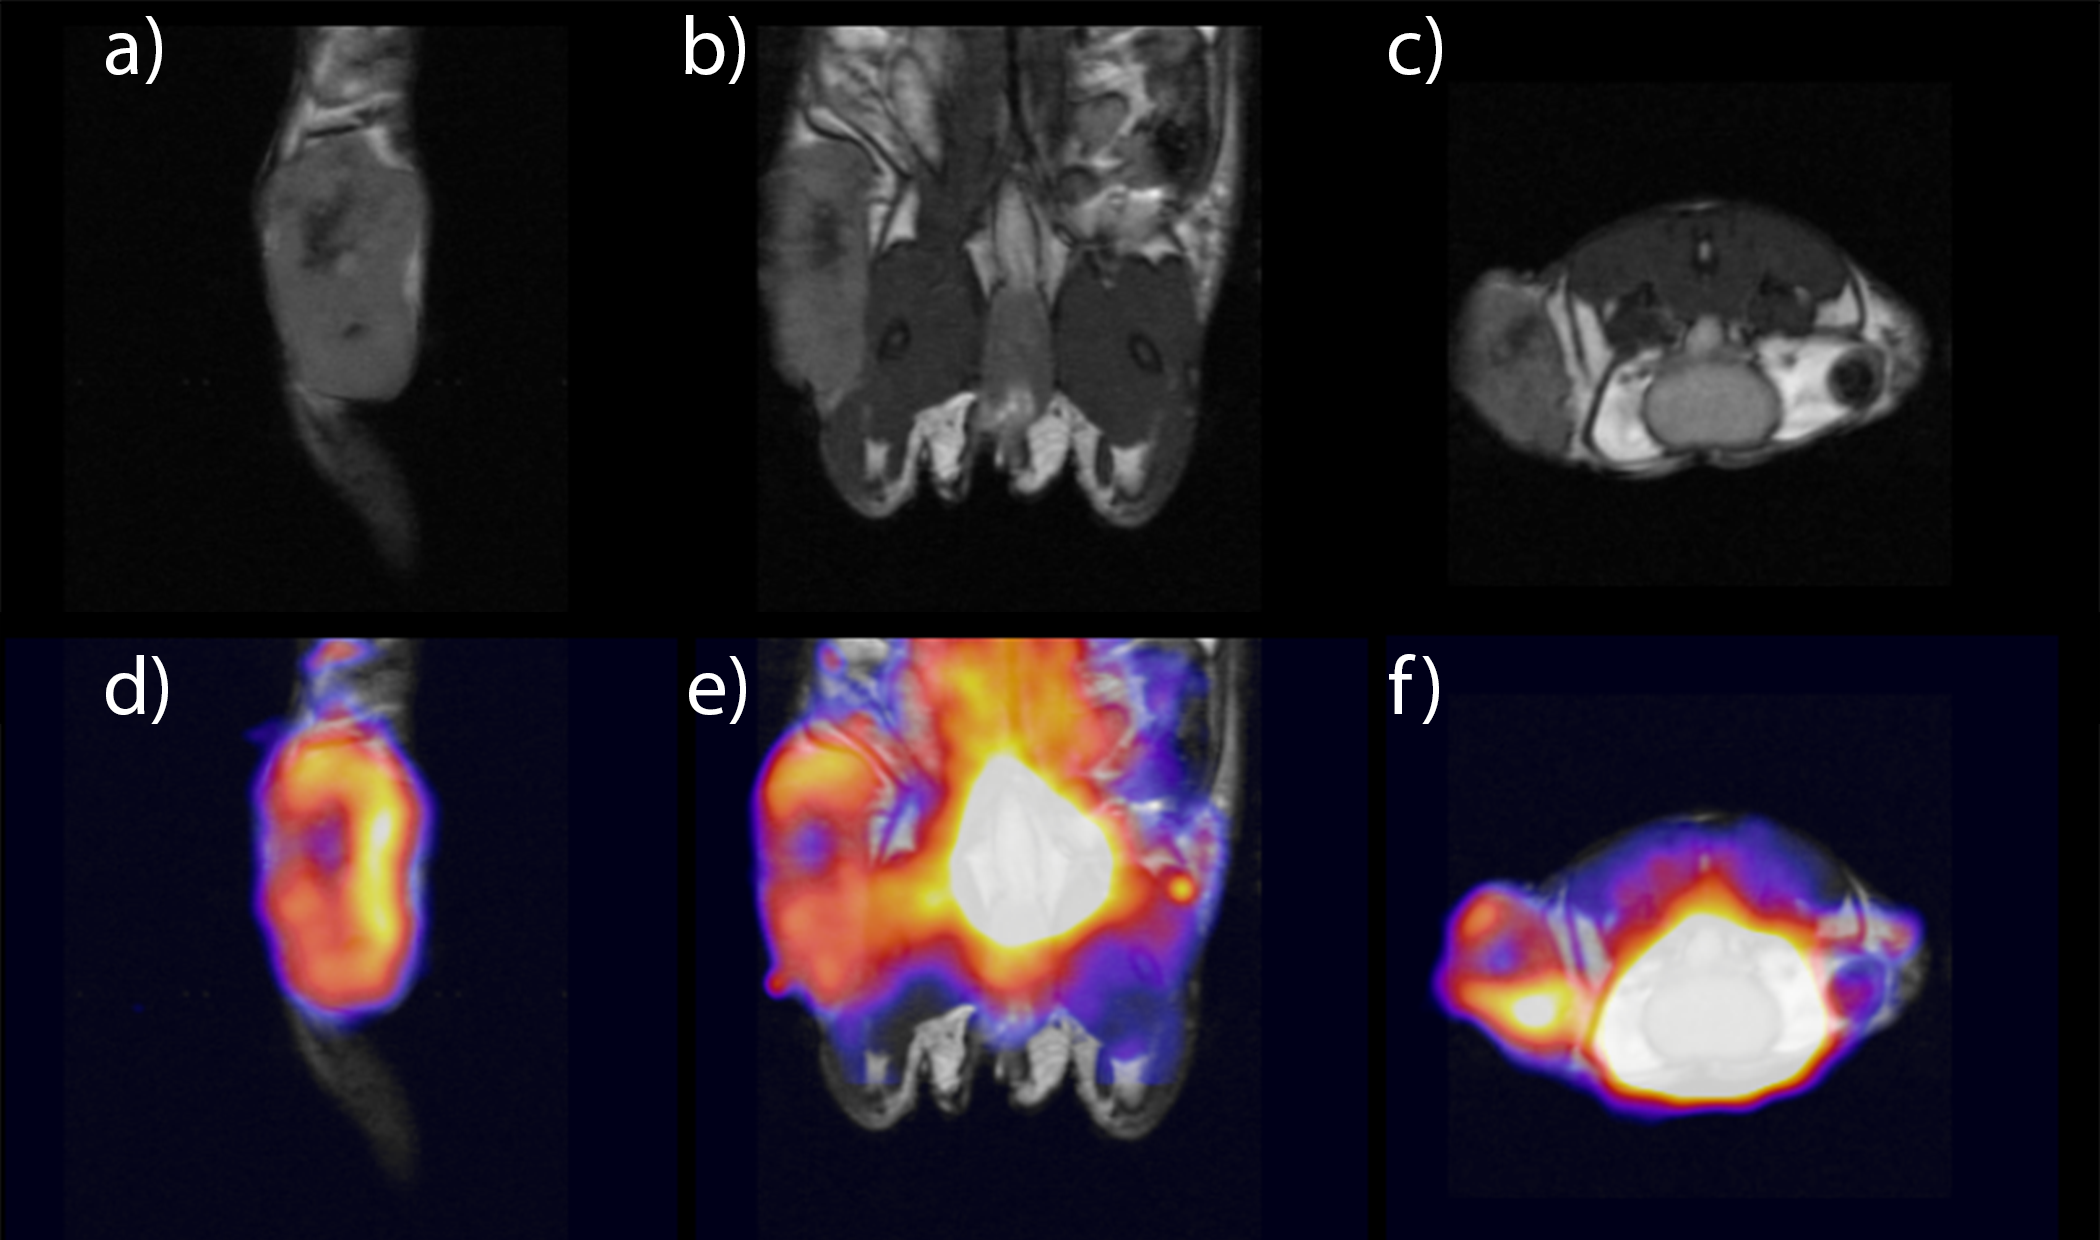
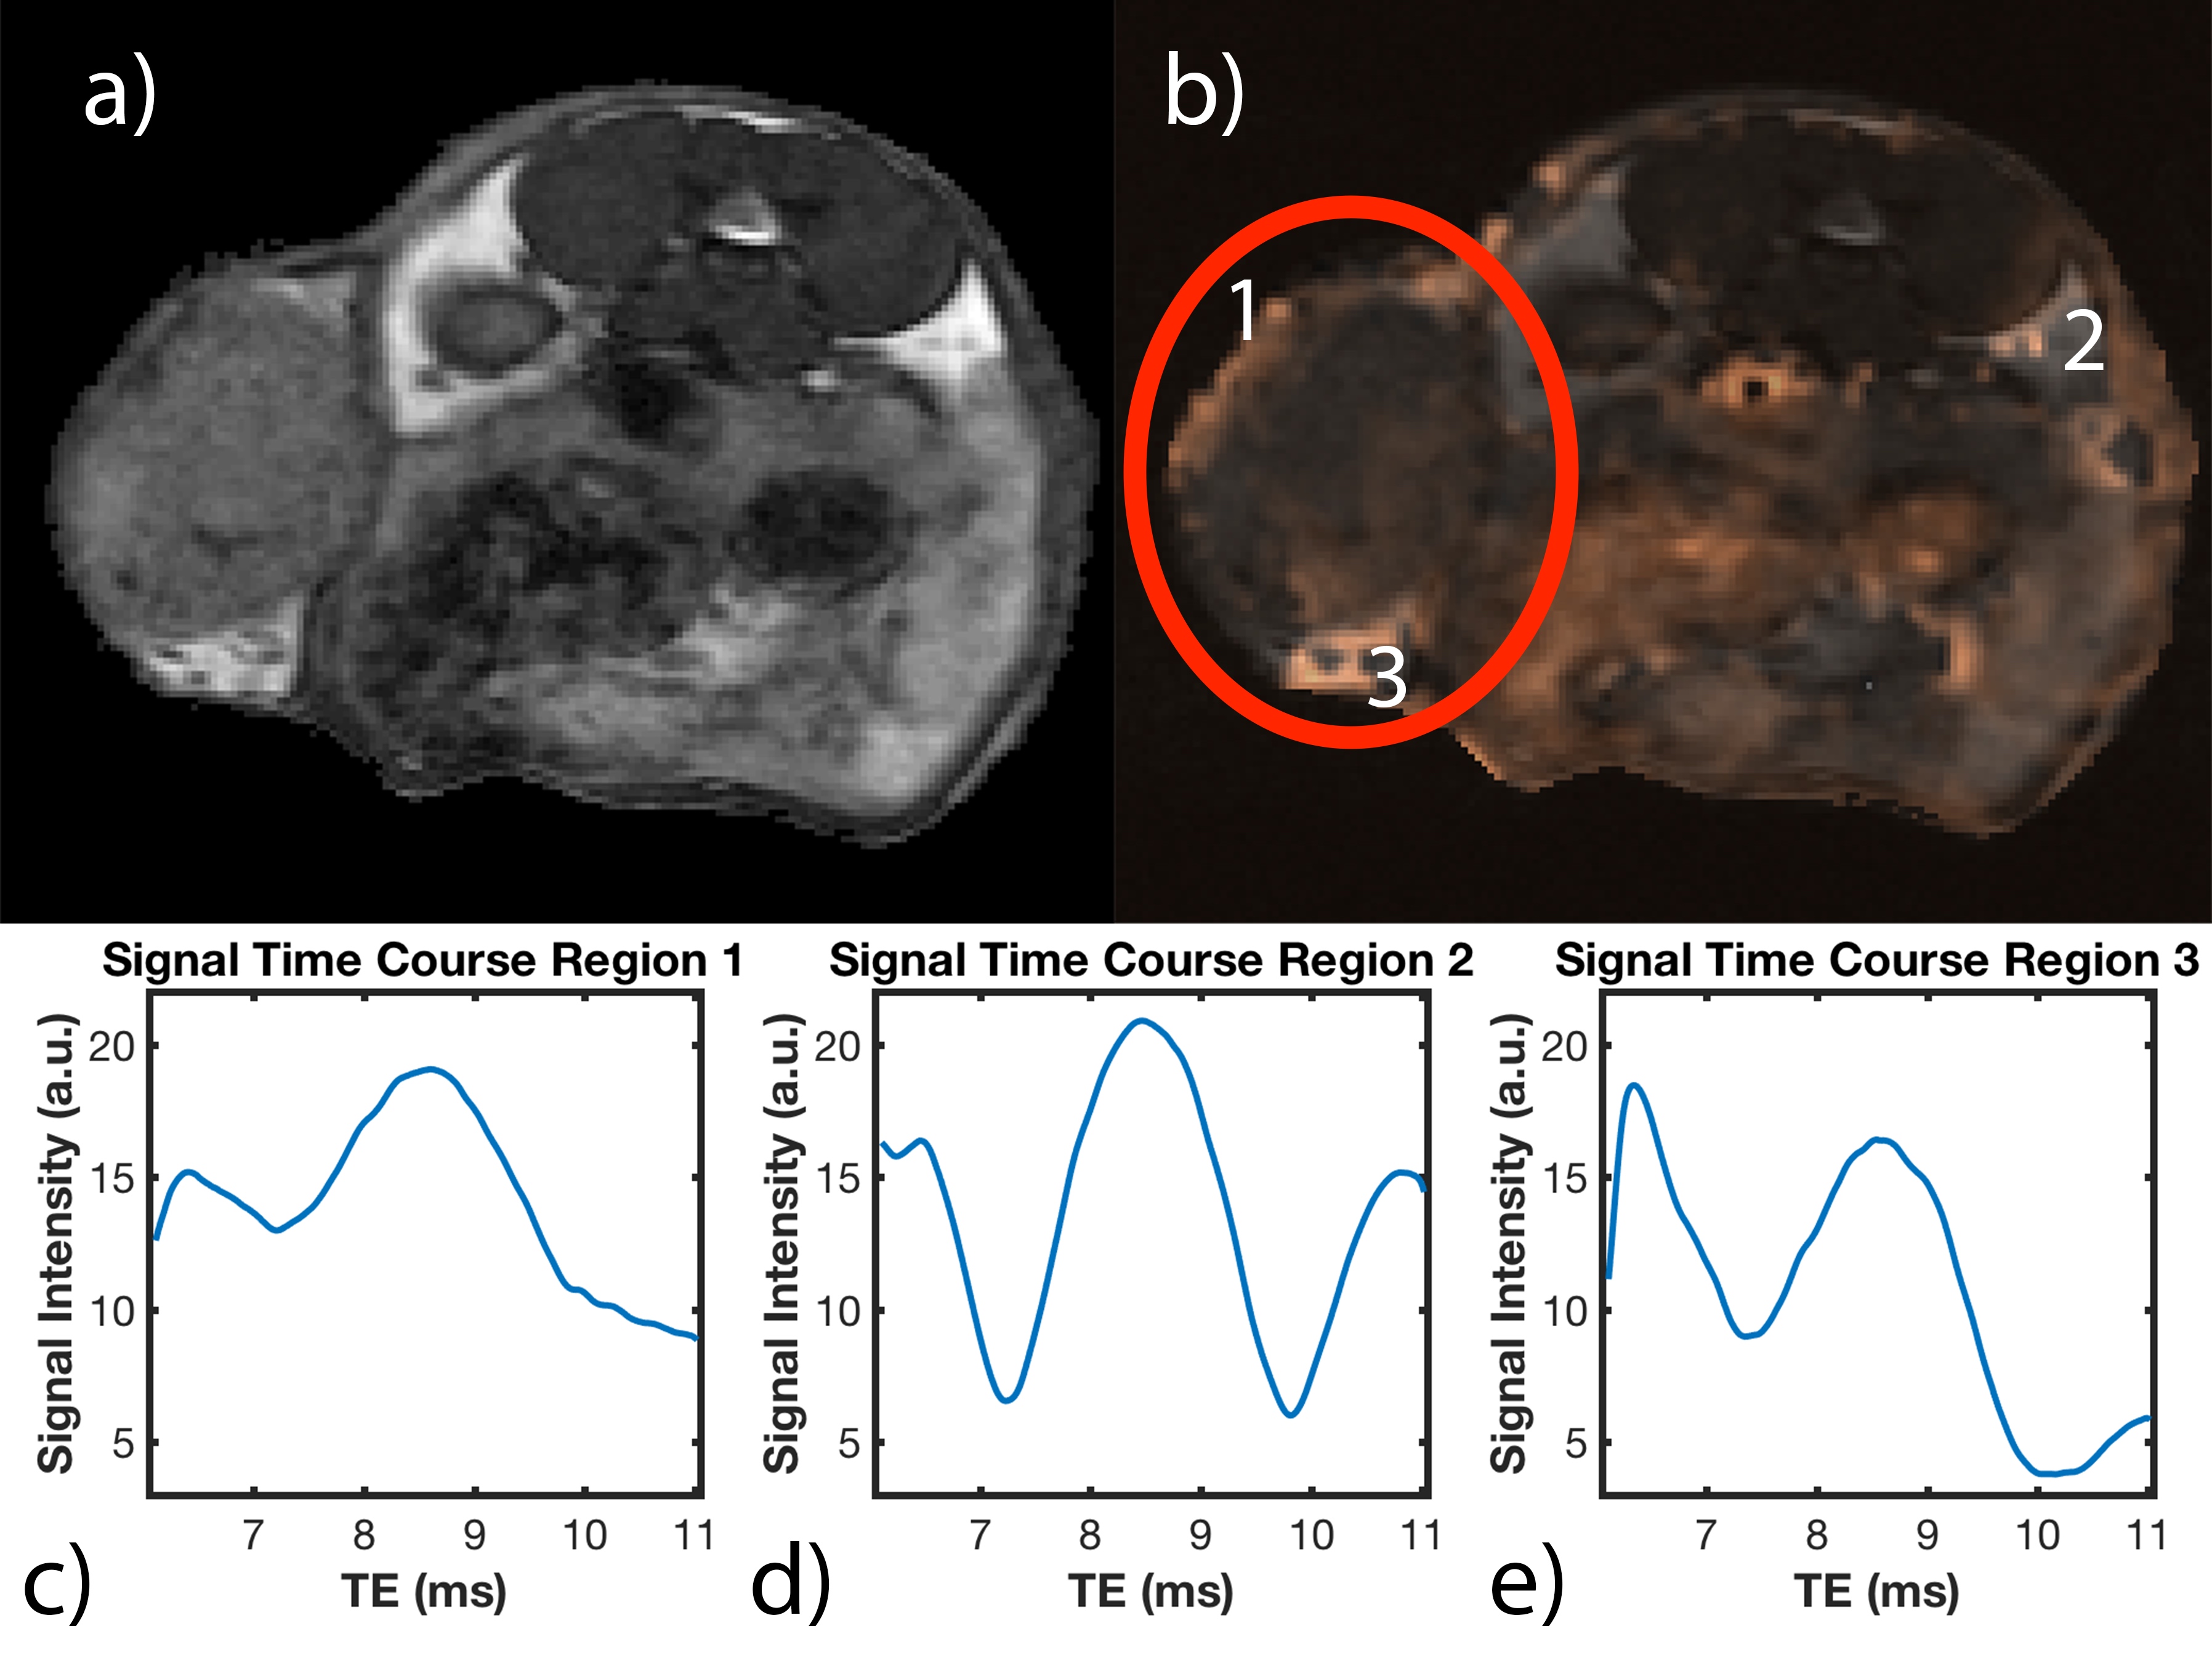
PET images show necrotic tumor cores with similar negative contrast on MRI as SPIO-labeled cells (Figure 3), confirming limitations of bSSFP for cell tracking. Figure 4 shows an axial bSSFP image with and without overlay of the aligned R2* map. Representative time courses of the MR signal in each of the indicated regions are shown in Figure 4c-e. Voxels in region 1 (tumor periphery) have time courses consistent with the presence of SPIO4, whereas voxels in region 2 (healthy adipose tissue) indicate the typical periodicity of fat (3.5ppm off-resonance, or 440Hz at 3T). Voxels in the fat pad anterior to the tumor (region 3) appear to have qualities of both SPIO and fat, indicating the likely presence of iron-labeled cells, potentially surrounding the inguinal lymph node.
The R2* map exhibits improved specificity within the tumor when compared to the bSSFP image, as seen in Figure 4a which has regions of negative contrast inconsistent with the R2* map. Interestingly, R2* maps indicate that CD8+ T cells are primarily recruited to the tumor periphery, with voxels containing approximately 2000 SPIO-labeled cells (Figure 4c). Labeled cells do not appear to penetrate to the interior of the tumor in great numbers, indicating a limitation in the immune response to the tumor, and potentially problematic for immunotherapies. We are currently analyzing quantitative data from TurboSPI to evaluate CD8+ T cell recruitment in response to several immunotherapies and determine the migration pattern in response to checkpoint inhibitors (anti-PD1) and peptide-based vaccines (DepoVax6).
Conclusion
TurboSPI R2* mapping and signal analysis offers a more specific and quantitative approach than bSSFP. However, bSSFP provides higher quality anatomical images with finer resolution. We propose that these sequences are most powerful when used together to study cellular recruitment in pre-clinical models. These tools will allow us to evaluate the potential migration/recruitment of several immune cell populations in response to emerging cancer immunotherapies, resulting in important insights into in vivo mechanisms of action.Acknowledgements
IWK Student Scholarship (ZOBM), NSHRF Establishment Grant (KDB), IWK Category B grant (KDB), NSERC Discovery Grant (KDB), ACOA AIF (salary support KDB), BHCRI Cancer Research Training Program (MLT), Vaccines provided by Immunovaccine Inc.References
1. Dodd SJ, Williams M, Suhan JP, Williams DS, Koretsky AP, Ho C. Detection of Single Mammalian Cells by High-Resolution Magnetic Resonance Imaging. Biophysical Journal. 1999;76(1):103-109
2. Foster-Gareau P, Heyn C, Alejski A, Rutt BK. Imaging single mammalian cells with a 1.5 T clinical MRI scanner. Magn Reson Med 2003;49(5):968-971
3. Brewer KD, Lake K, Pelot N, Stanford MM, DeBay DR, Penwell A, Weir GM, Karkada M, Mansour M, Bowen CV. Clearance of depot vaccine SPIO-labeled antigen and substrate visualized using MRI. Vaccine 2014;32(51):6956-6962
4. Rioux JA, Brewer KD, Beyea SD, Bowen CV. Quantification of superparamagnetic iron oxide with large dynamic range using TurboSPI. J Magn Reson 2012;216:152-160
5. Rioux JA, Beyea SD, Bowen CV. 3D single point imaging with compressed sensing provides high temporal resolution R2* mapping for in vivo preclinical application. Magn Reson Mater Phy 2016; doi:10.1007/s10334-016-0583-y.
6. Karkada M, Weir GM, Quinton T, Sammatur L, MacDonald LD, Grant A, Liwski R, Juskevicius R, Sinnathamby G, Philip R, Mansour M. A Novel Breast/Ovarian Cancer Peptide Vaccine Platform That Promotes Specific Type-1 but not Treg/Tr1-type Responses. Journal of Immunotherapy 2010;33(3):250-261
Figures