3067
[18F]-DCFPyL standard uptake values correlate with apparent diffusion coefficient and choline measurements on a 3T PET-MRI in prostate cancer1Lawson Health Research Institute, London, ON, Canada, 2Siemens Healthcare Limited, Oakville, ON, Canada, 3Medical Biophysics, Western University, London, ON, Canada, 4Medical Imaging, Western University, London, ON, Canada, 5Oncology, Western University, London, ON, Canada, 6Surgery, Western University, London, ON, Canada, 7Robarts Research Institute, London, Canada, 8London Regional Cancer Program, London, ON, Canada
Synopsis
PET data with the [18F]-DCFPyL PSMA-targeted probe to examine prostate cancer in patients scheduled for radical prostatectomy was acquired concurrently with diffusion weighted imaging and chemical shift imaging using a 3T PET-MRI. Standard uptake values (SUV) were compared to apparent diffusion coefficients (ADC) and choline plus creatine over citrate ratios (CC/C). Positive correlations existed between the SUV and CC/C in voxels with low ADC. Negative correlations existed between the ADC and SUV in voxels with high CC/C, and negative correlations also existed between the ADC and CC/C in voxels with high SUV.
Introduction
Globally, men have benefited from advanced medical imaging techniques to detect and monitor prostate cancer. Specifically, MRI allows for non-invasive imaging of prostate cancer, while positron emission tomography (PET) can image radiotracers that target metabolic changes and, more recently, prostate-specific membrane antigen (PSMA) to detect cancer that often cannot be observed using standard MRI. These two modalities can now be utilized concurrently with the advent of hybrid PET-MRI scanners, allowing for accurate image registration between PET and MRI acquisitions. Using MRI, diffusion weighted imaging has been used to monitor the diffusivity via the apparent diffusion coefficient (ADC). The ADC is reduced in prostate cancer due to increased cell density causing restricted diffusion compared to the surrounding tissue and has been shown to be a potential marker predicting tumor aggressiveness1. Chemical shift imaging (CSI) has also been proposed to examine increased choline uptake and lower citrate in tumor cells2. PSMA is a transmembrane protein often overexpressed in prostate cancer cells. Using PET, probes that target PSMA have been shown to have high sensitivity and specificity towards prostate cancer detection3. [18F]-DCFPyL is a particularly promising PSMA-targeted PET probe that has been recently developed4,5. These techniques provide complimentary information that could be useful in monitoring treatment and disease progression. It is expected that PET and CSI measurements will positively correlate with each other in the prostate, while both will negatively correlate to ADC values.Methods
Five patients with histopathologically confirmed prostate cancer who were scheduled for radical prostatectomy provided informed written consent to participate in this study. These subjects were first scanned on PET-CT before voluntarily being scanned on the PET-MRI. All subjects received an injected dose of 327 +/- 15 MBq of [18F]-DCFPyL 109 +/- 6 minutes prior to the PET-MRI scan. All scans were performed on a Siemens 3T Biograph mMR (Siemens, Erlangen, Germany) located at the Lawson Health Research Institute in London, Ontario, Canada. PET scans were 15 minutes in duration acquired in list-mode, and attenuation correction was performed using a 2-point Dixon technique. A 2D axial diffusion-weighted EPI scan (3 directions; b=0, 100, 800; TR=5200 ms; TE=93 ms; 2.2x1.8x3.6 mm3; 140 mm FOV; 8 averages) measured ADC, and a 3D PRESS CSI sequence (TR=750 ms; TE=145 ms; 7x7x7 mm3; 200 mm FOV; 6 averages) measured ratios of choline plus creatine over citrate (CC/C). An endorectal coil filled with saline was employed to provide superior SNR for CSI spectra while minimizing PET attenuation. An additional T2-weighted image (TE=113 ms; TR=3630 ms; 180 mm FOV; 23 slices; 0.9x0.6x2.2 mm3; flip angle=150°; 4 averages) was acquired for manual segmentation of the prostate from the surrounding tissue. All images were registered and resampled to the CSI volumes using 3D slicer (https://www.slicer.org). Correlations between measurements were calculated using MATLAB R2015B (The Mathworks Inc., Natick, MA, USA).Results
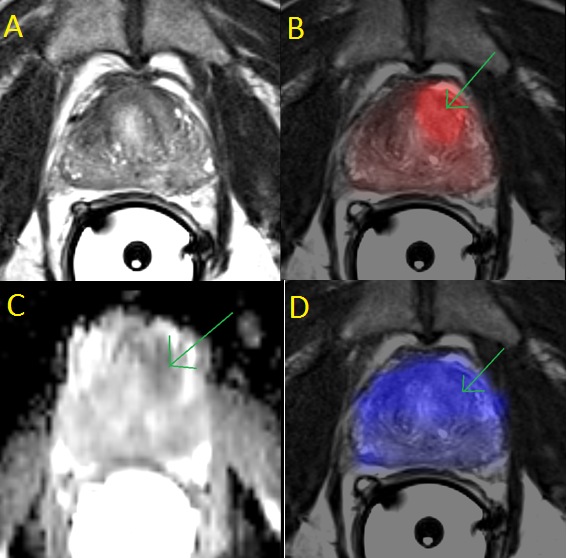
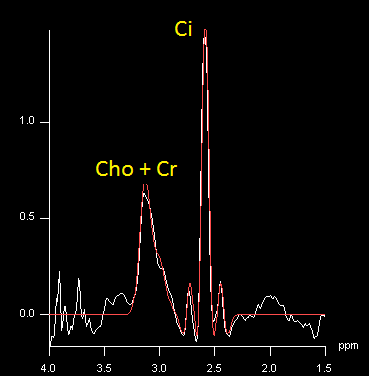
High quality PET standard uptake value (SUV), ADC, and CC/C maps were acquired (Fig. 1). The endorectal coil provided sufficient SNR to calculate the CC/C ratios from the CSI spectra (Fig. 2). The correlations between measurements were generally weak when all voxels were included in the analysis. ADC values negatively correlated with CC/C ratios (r=-0.19) and PET SUV measurements (r=-0.17), and a very weak correlation existed between CC/C and PET SUV (r=0.09). However, when only voxels with high PET SUV values (SUV > 5) were thresholded, ADC and CC/C measurements were more negatively correlated (r=-0.53). Similarly, in voxels with low ADC values (ADC < 1.0x10⁻³ mm2/s), PET and CSI measurements were more positively correlated (r=0.54) and in voxels with high CC/C ratios (CC/C > 0.6), ADC and PET SUV measurements were negatively correlated (r=-0.39).Discussion
When all voxels in the prostate (healthy and cancerous) were included in the analysis, the correlations between measurements were weak. However, by thresholding only voxels with high PET SUV, high CC/C, and low ADC values, the correlations were stronger and were in the expected directions, likely indicating that these correlations are providing tumor specific relationships. Given this assumption, in these tumor environments, there appears to be increased cellular density, increased choline uptake (or citrate reduction), and specific uptake of the PSMA tracer. Future work will include more subjects and segmentation of the tumor to compare it to the surrounding healthy prostate.Conclusion
A PET-MRI was used to concurrently measure [18F]-DCFPyL PET SUV values, while measuring ADC values and CC/C ratios in a subset of patients with prostate cancer. These methods provide complementary information to each other, and future work is necessary to elucidate how they can together improve detection or treatment monitoring of prostate cancer.Acknowledgements
The authors would like to thank the Canadian Institute of Health Research, the Ontario Institute for Cancer Research, Movember, and MITACS for funding, and also Heather Biernaski for support on the PET-MRI.References
1. Wu X, et al. Correlation between apparent diffusion coefficient value on diffusion-weighted MR imaging and Gleason score in prostate cancer. Diagnostic and Interventional Imaging (2016), http://dx.doi.org/10.1016/j.diii.2016.08.009
2. Scheenen TWJ, et al., Three-dimensional Proton MR Spectroscopy of Human Prostate at 3 T without Endorectal Coil. Radiology (2007), 245(2), 507–516.
3. Maurer T, et al. Current use of PSMA–PET in prostate cancer management. Nature Reviews Urology (2016), 13(4), 226–235. http://doi.org/10.1038/nrurol.2016.26
4. Szabo Z, et al. Initial Evaluation of [18F]DCFPyL for Prostate-Specific Membrane Antigen (PSMA)-Targeted PET Imaging of Prostate Cancer. Molecular Imaging and Biology (2015), 17(4), 565–74. http://doi.org/10.1007/s11307-015-0850-8
5. Bauman G, et al. [18F]-DCFPyL Positron Emission Tomography/Magnetic Resonance Imaging for Localization of Dominant Intraprostatic Foci: First Experience. Eur Urol Focus (2016), http://dx.doi.org/10.1016/j.euf.2016.10.002
Figures