3061
Detection of sulfatase enzyme activity with a catalyCEST MRI contrast agent1Chemistry and Biochemistry, University of Arizona, Tucson, AZ, United States, 2Pharmaceutical Sciences, University of Arizona, Tucson, AZ, United States, 3Medical Imaging, University of Arizona, Tucson, AZ, United States
Synopsis
CatalyCEST MRI with a diamagnetic CEST agent, 4-acedamido-2-(sulfoxy)benzoic acid, can detect the activity of sulfatase. An enzyme-responsive CEST signal was compared to an unresponsive CEST signal to determine a reaction coordinate of contrast agent cleavage by sulfatase. This imaging method produced parametric maps of CEST signal amplitudes and the reaction coordinates. Three isoforms of the enzyme were tested in biochemical solutions. catalyCEST MRI with the agent detected sulfatase activity in the media from sulfatase-expressing HEK293 cells but not in the media of sulfatase-deficient BT529 cells.
Purpose
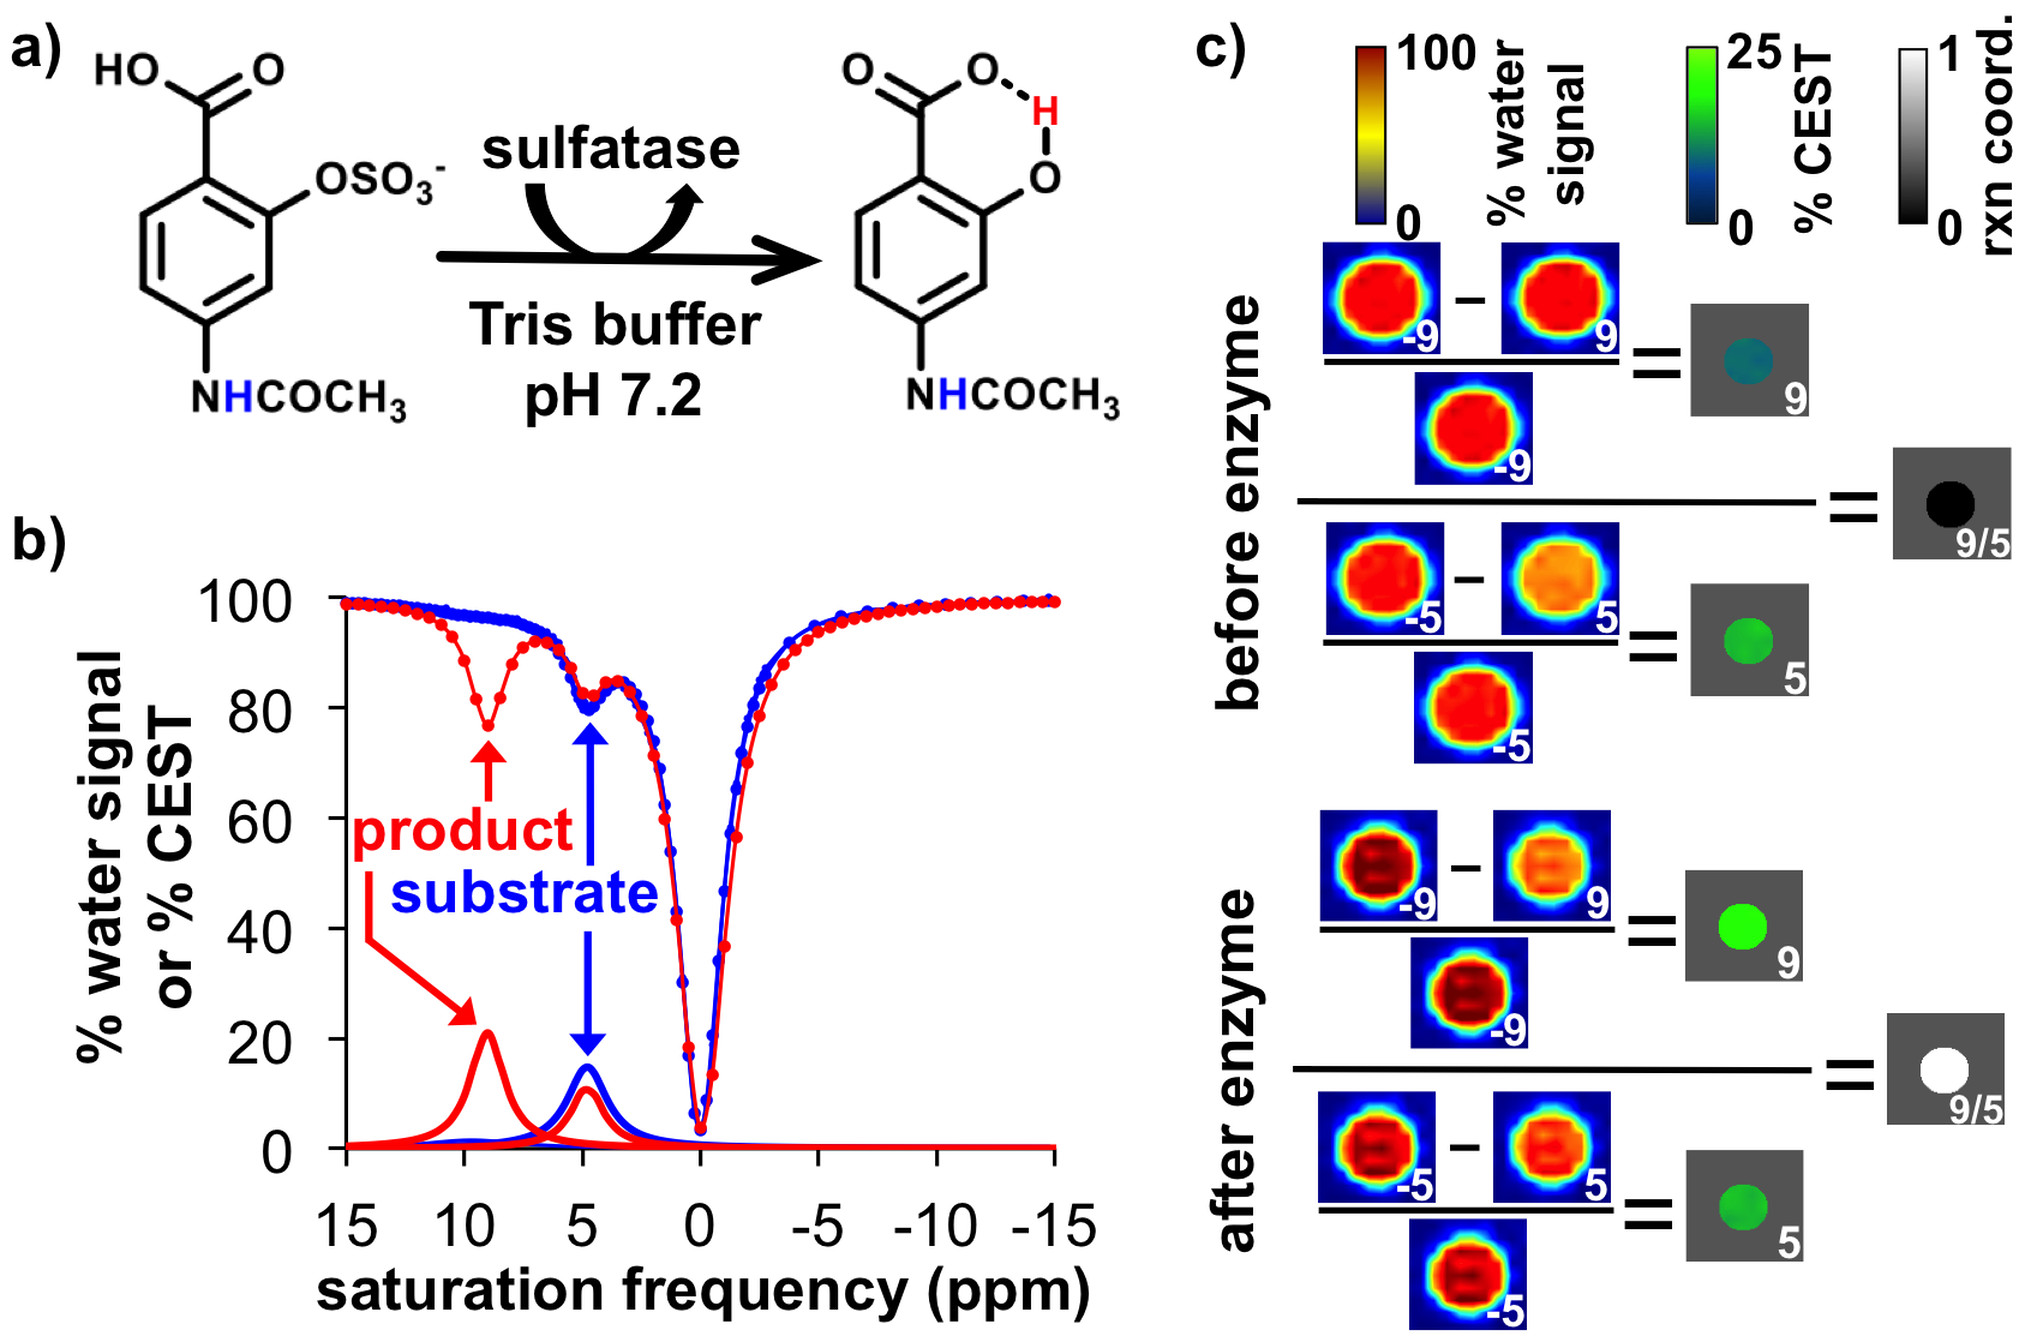
We sought to develop a diamagnetic CEST MRI contrast agent that can detect sulfatase enzyme activity. We hypothesized that derivatizing salicylic acid with a sulfate group would produce a CEST signal at ~9 ppm only after sulfatase cleaved the sulfate group from the agent.1 An acylamide group on the agent would produce a CEST signal at ~5 ppm that would be enzyme-unresponsive.2 A comparison of the two CEST signals could then be used to detect sulfatase activity in a concentration-independent manner.3Methods
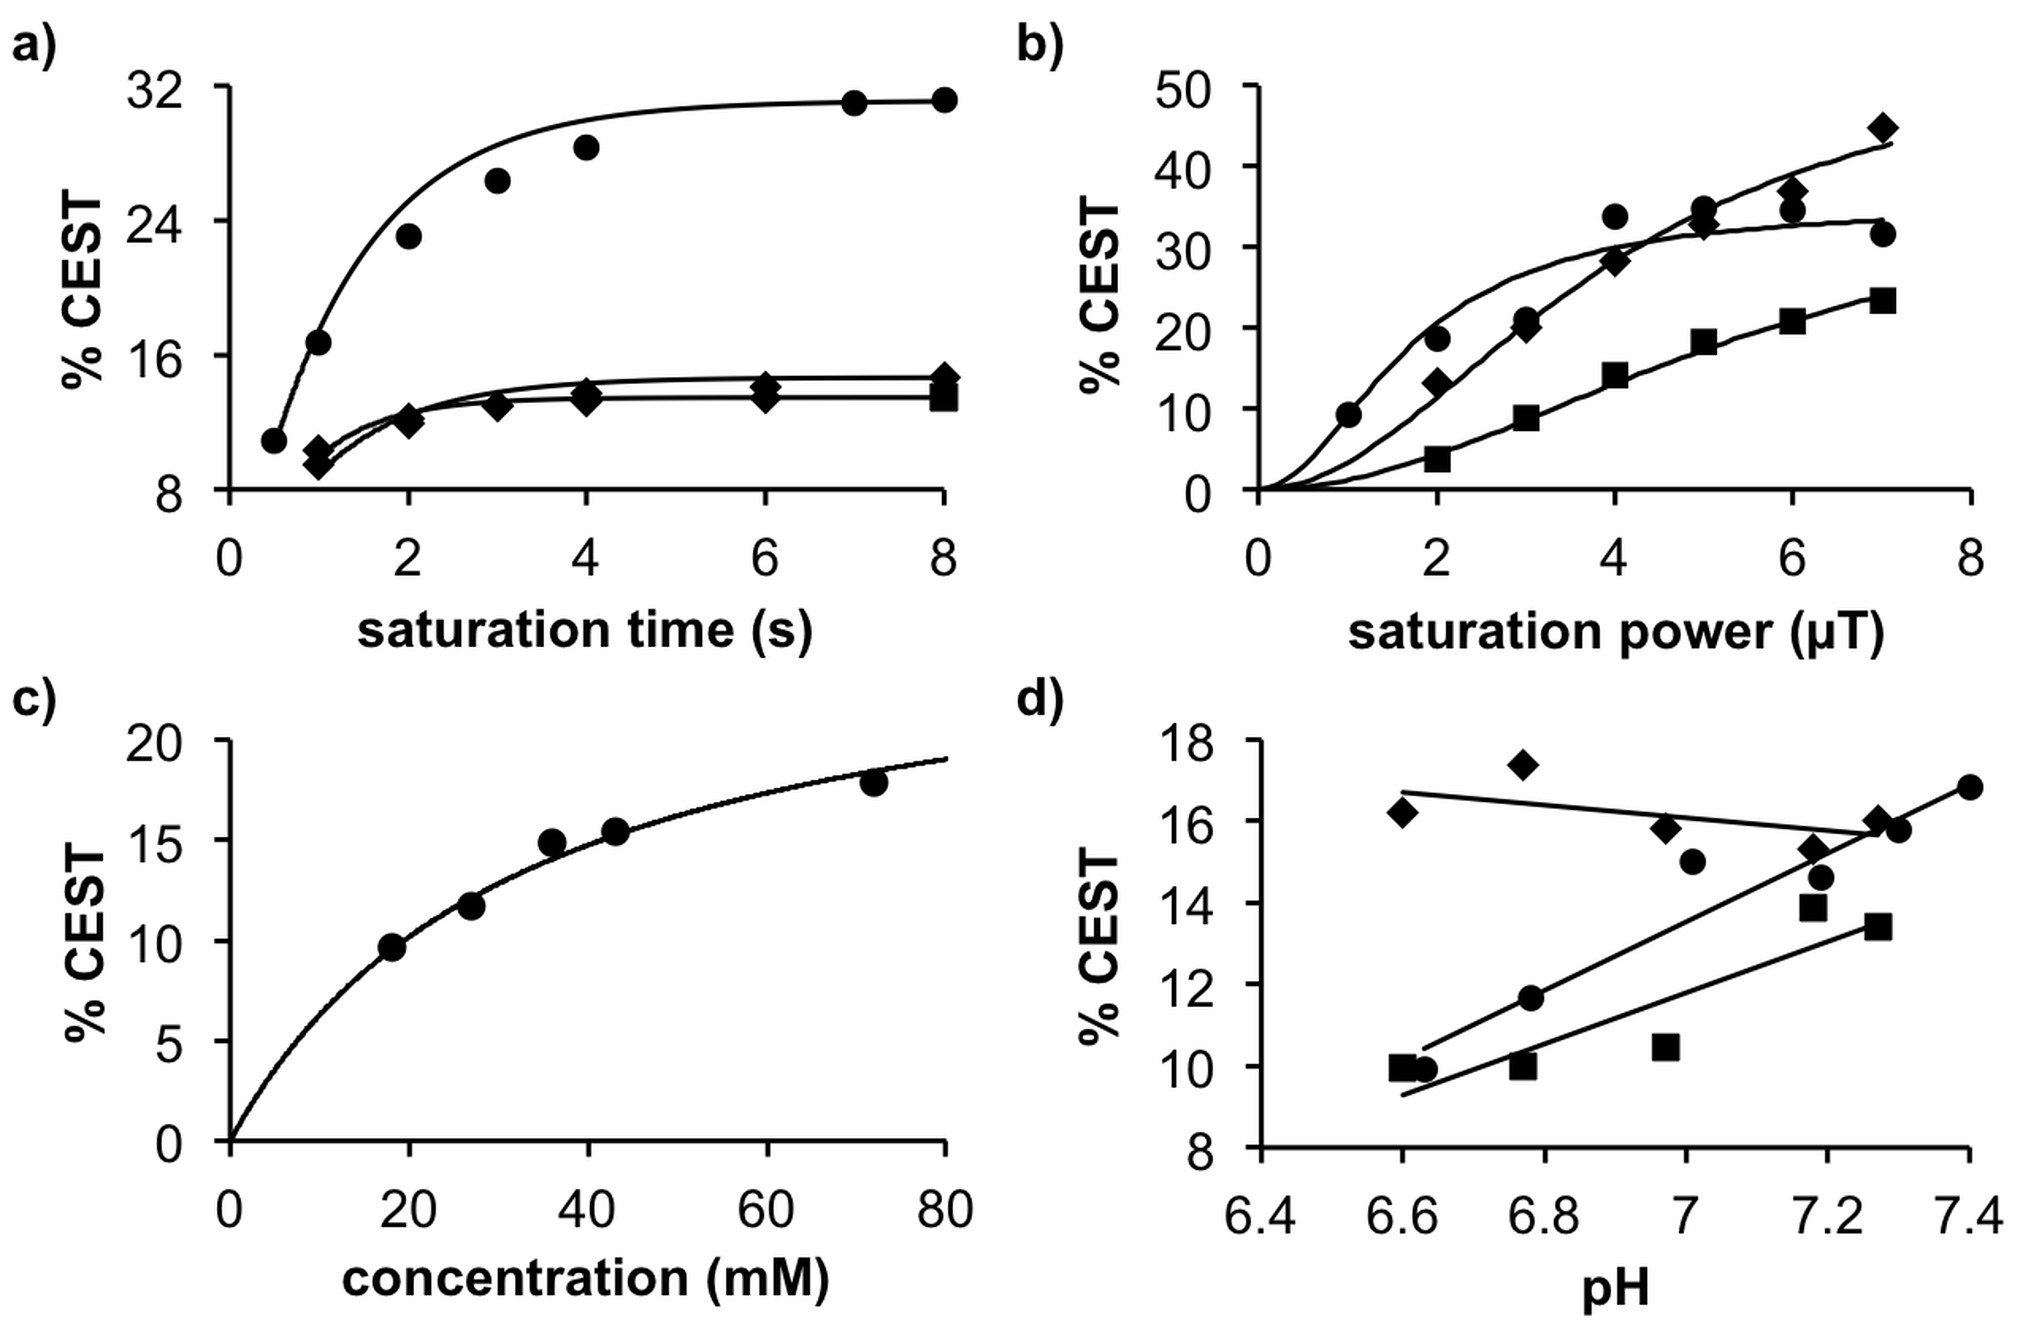
We synthesized 4-acedamido-2-(sulfoxy)benzoic acid in 71% yield. MRI studies were performed with a 72 mm transceiver coil in a 7T Biospec MRI scanner, at 37.0 °C. CEST spectra were obtained using a CEST-FISP MRI protocol with TR: 3.196 ms; TE: 1.598 ms; excitation flip angle: 30°; centric encoding during acquisition; matrix: 128 x 128; field of view: 8 x 8 cm; in-plane spatial resolution: 625 x 625 μm; slice thickness: 1 mm; number of slices: 1; number of averages: 1.4 We acquired a series of 85 images with selective saturation applied at 3 mT for 5 seconds at saturation frequencies in 0.25 ppm increments from 15 ppm to -3 ppm and 1 ppm increments from -4 ppm to -15 ppm, for a total scan time of 7:42 min. Each CEST spectrum from a region of interest in an image of a sample was analyzed by fitting the spectrum to a sum of three Lorentzian line shapes to account for two CEST signals and direct saturation of water.2 The center, width, and amplitude of each Lorentzian line was allowed to change to optimize the fit. The r1 relaxivities were determined using a spin echo MRI protocol with a 12.7 ms TE; 10 TR times between 18.339 and 10000 msec; 1 mm slice thickness; 782 x 782 mm in-plane resolution; 5 x 2.5 cm field of view; and 64 x 32 matrix. The same protocol was used to measure The r2 relaxivities were measured with a 15- 960 ms TE in increments of 15 ms; 40 sec TR time; 1.07 mm slice thickness; 400 x 400 mm in-plane resolution; 5.12 x 2.56 cm field of view; and 128 x 64 matrix size. To calculate the T1 and T2 relaxation times, the signal amplitudes were fitted with a monoexponential function with a constant to account for a possible DC offset using ParaVision® PV5.1 (Bruker Biospin, Inc., Billerica, MA).Results
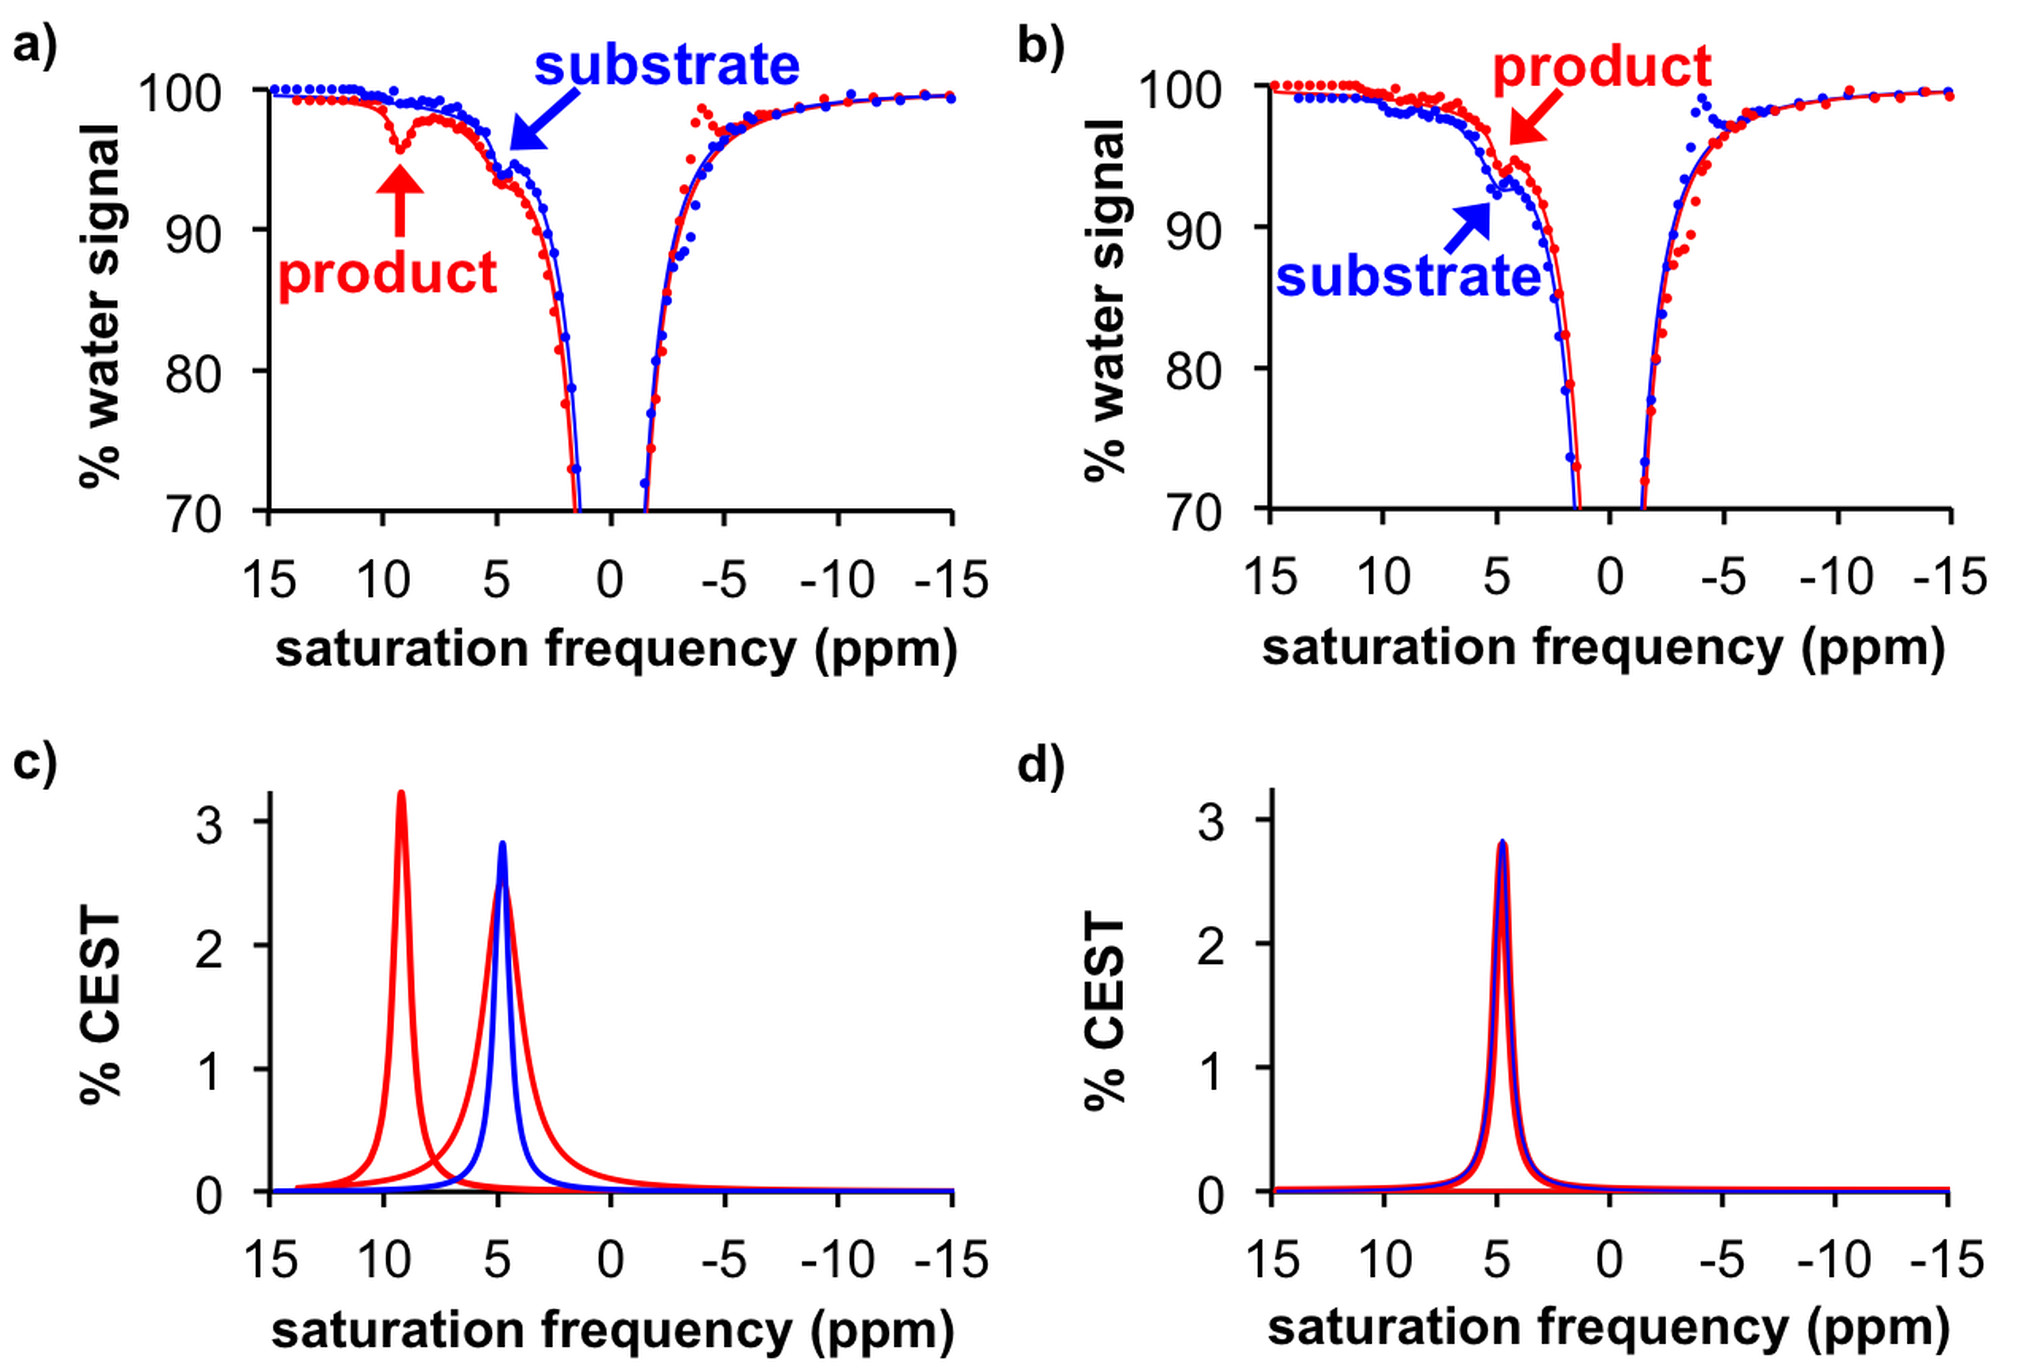
The CEST spectra of 45 mM of the agent at pH 7.2 before cleavage (substrate) and after cleavage (product) with 5 units of H.pomatia mollusk (the snail in escargot) showed the appearance of a CEST signal at 9.0 ppm after the enzyme was added to the substrate, while the CEST signal at 5.0 ppm was largely unchanged. Similar results were produced with sulfatase from abalone mollusk (a sea snail) and A. aerogenes (a bacterial coliform), showing that the agent can detect isoforms of sulftase. Spatial maps of % CEST signal were used to produce parametric maps of the reaction coordinate for the enzyme (Eq. [1]). The r2 relaxivities were negligible, and the r1 relaxivities were too low to be reliably measured, confirming that the substrate and product only act as a CEST agent. The CEST spectra and after incubation of the agent with HEK293 cell suspension showed the appearance of a CEST signal at 9.0 ppm,5 while the same CEST MRI study with BT549 cell suspension showed no appearance of a CEST signal at 9.0 ppm. In both studies, the CEST signal at 5.0 ppm was largely unresponsive to enzyme activity. Broader line widths of the direct saturation of water were attributed to the biological milieu of the cell suspension that typically shortens the T2 relaxation time of the sample. This result matched the high expression and secretion of sulfatase enzymes from HEK293 cells, and the absence of expression and secretion from BT549 cells.Discussion
These results confirm that sulfatase activity can be detected using catalyCEST MRI with a diamagnetic agent.7 The ratio of the two CEST signals could measure a reaction coordinate in biochemical solutions of various isoforms of sulfatase, and in the in vitro studies of cell lines that express and secrete high and low sulfatase enzymes.Acknowledgements
No acknowledgement found.References
1. Fernández-Cuervo G, et al., ChemBioChem 2016.
2. Hingorani D, et al., Contrast Media Molec Imaging 2016;11:130–138.
3. Sinharay S, et al., Magn Reson Med 2016, epub ahead of print. DOI: 10.1002/mrm.26278..
4. Shah T, et al., Magn Reson Med 2011;65:432–437.
5. Rush JS, et al., ChemBioChem 2010:11;2096- 2099.
6. C. Zhu C., et al., Oncol Rep 2016, 35, 1318-1328.
7. Sinharay S, et al., Chem Euro J 2016;22:6491-6495.
Figures