3054
Diamagnetic imaging agents with a modular chemical design for quantitative detection of β-galactosidase and β-glucuronidase activities with catalyCEST MRI1Pharmaceutical Sciences, University of Arizona, Tucson, AZ, United States, 2Chemistry and Biochemistry, University of Arizona, Tucson, AZ, United States, 3Pharmacy, University of Arizona, Tucson, AZ, United States, 4Biomedical Engineering, University of Arizona, Tucson, AZ, United States
Synopsis
We have designed and synthesized new MRI agents that quantitatively detect β-galactosidase and β-glucuronidase activities by measuring changes in chemical exchange saturation transfer (CEST). Based on a modular approach, we incorporated the enzymes’ respective substrates to a salicylate moiety with a spontaneously disassembling, chromogenic spacer via a carbamate linkage. This design furnished highly selective diamagnetic CEST agents that detected and quantified enzyme activities of glycoside hydrolase enzymes. Michaelis-Menten enzyme kinetics studies were performed by monitoring catalyCEST MRI signals, which were validated with UV-vis assays.
Purpose
An imaging protocol, termed catalyCEST MRI, can detect enzyme activity in vitro1-7 and in vivo.8,9 Unfortunately, many enzymes may be inactive or have sluggish activity when catalyzing the cleavage to a substrate that is directly linked to an imaging agent. Therefore, we sought to expand this platform technology by incorporating a spacer between the diamagnetic CEST agent and glycoside moiety via a carbamate linkage. To test this approach, we developed diamagnetic CEST agents that can detect β-galactosidase (β-gal) and β-glucuronidase (β-gus) glycoside hydrolase enzymes.Methods
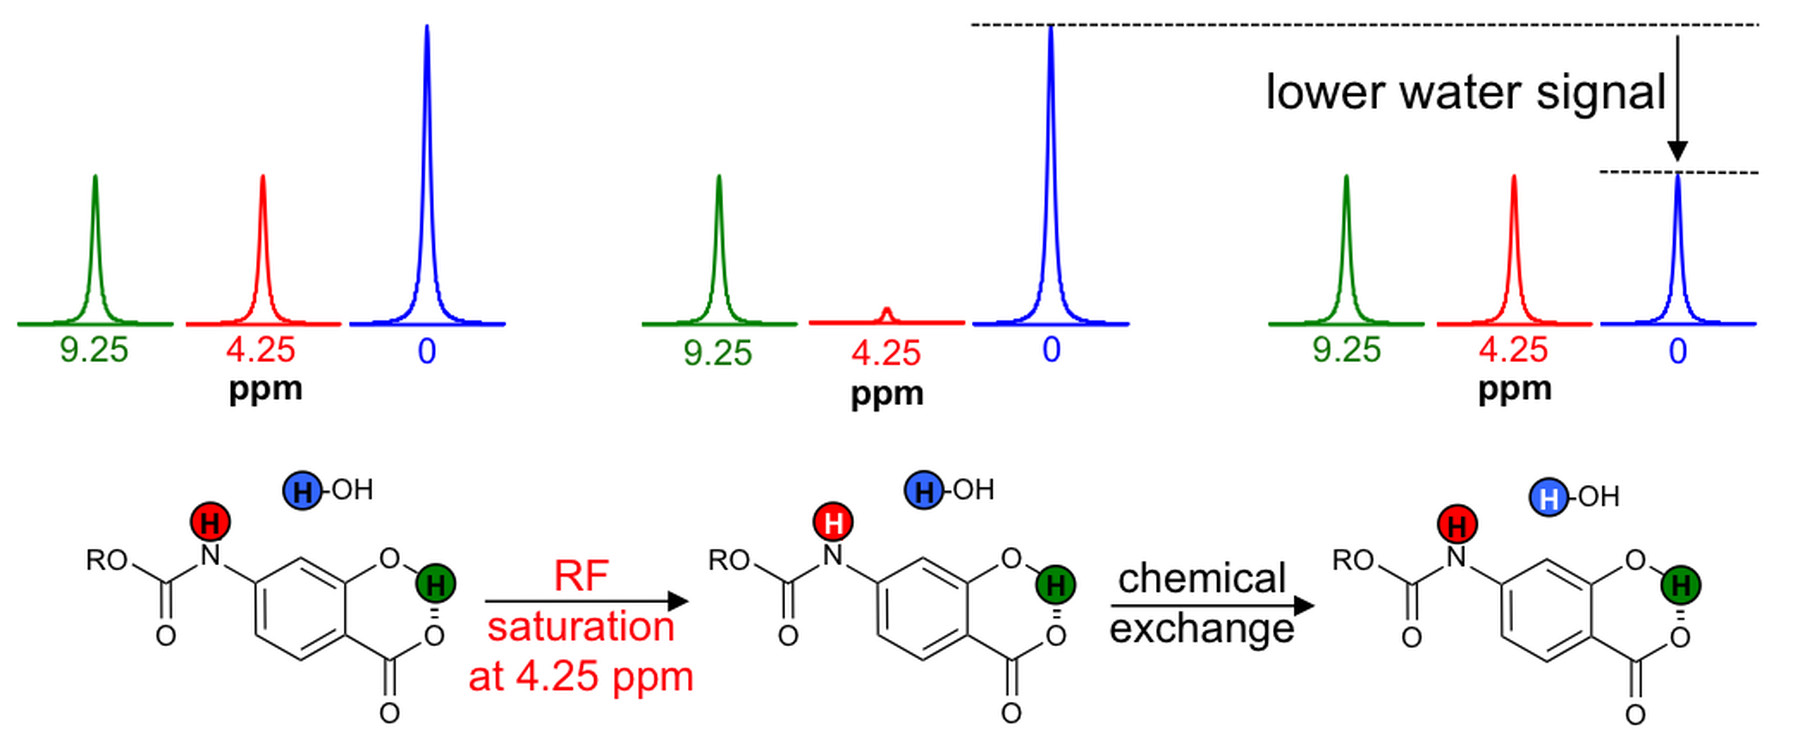
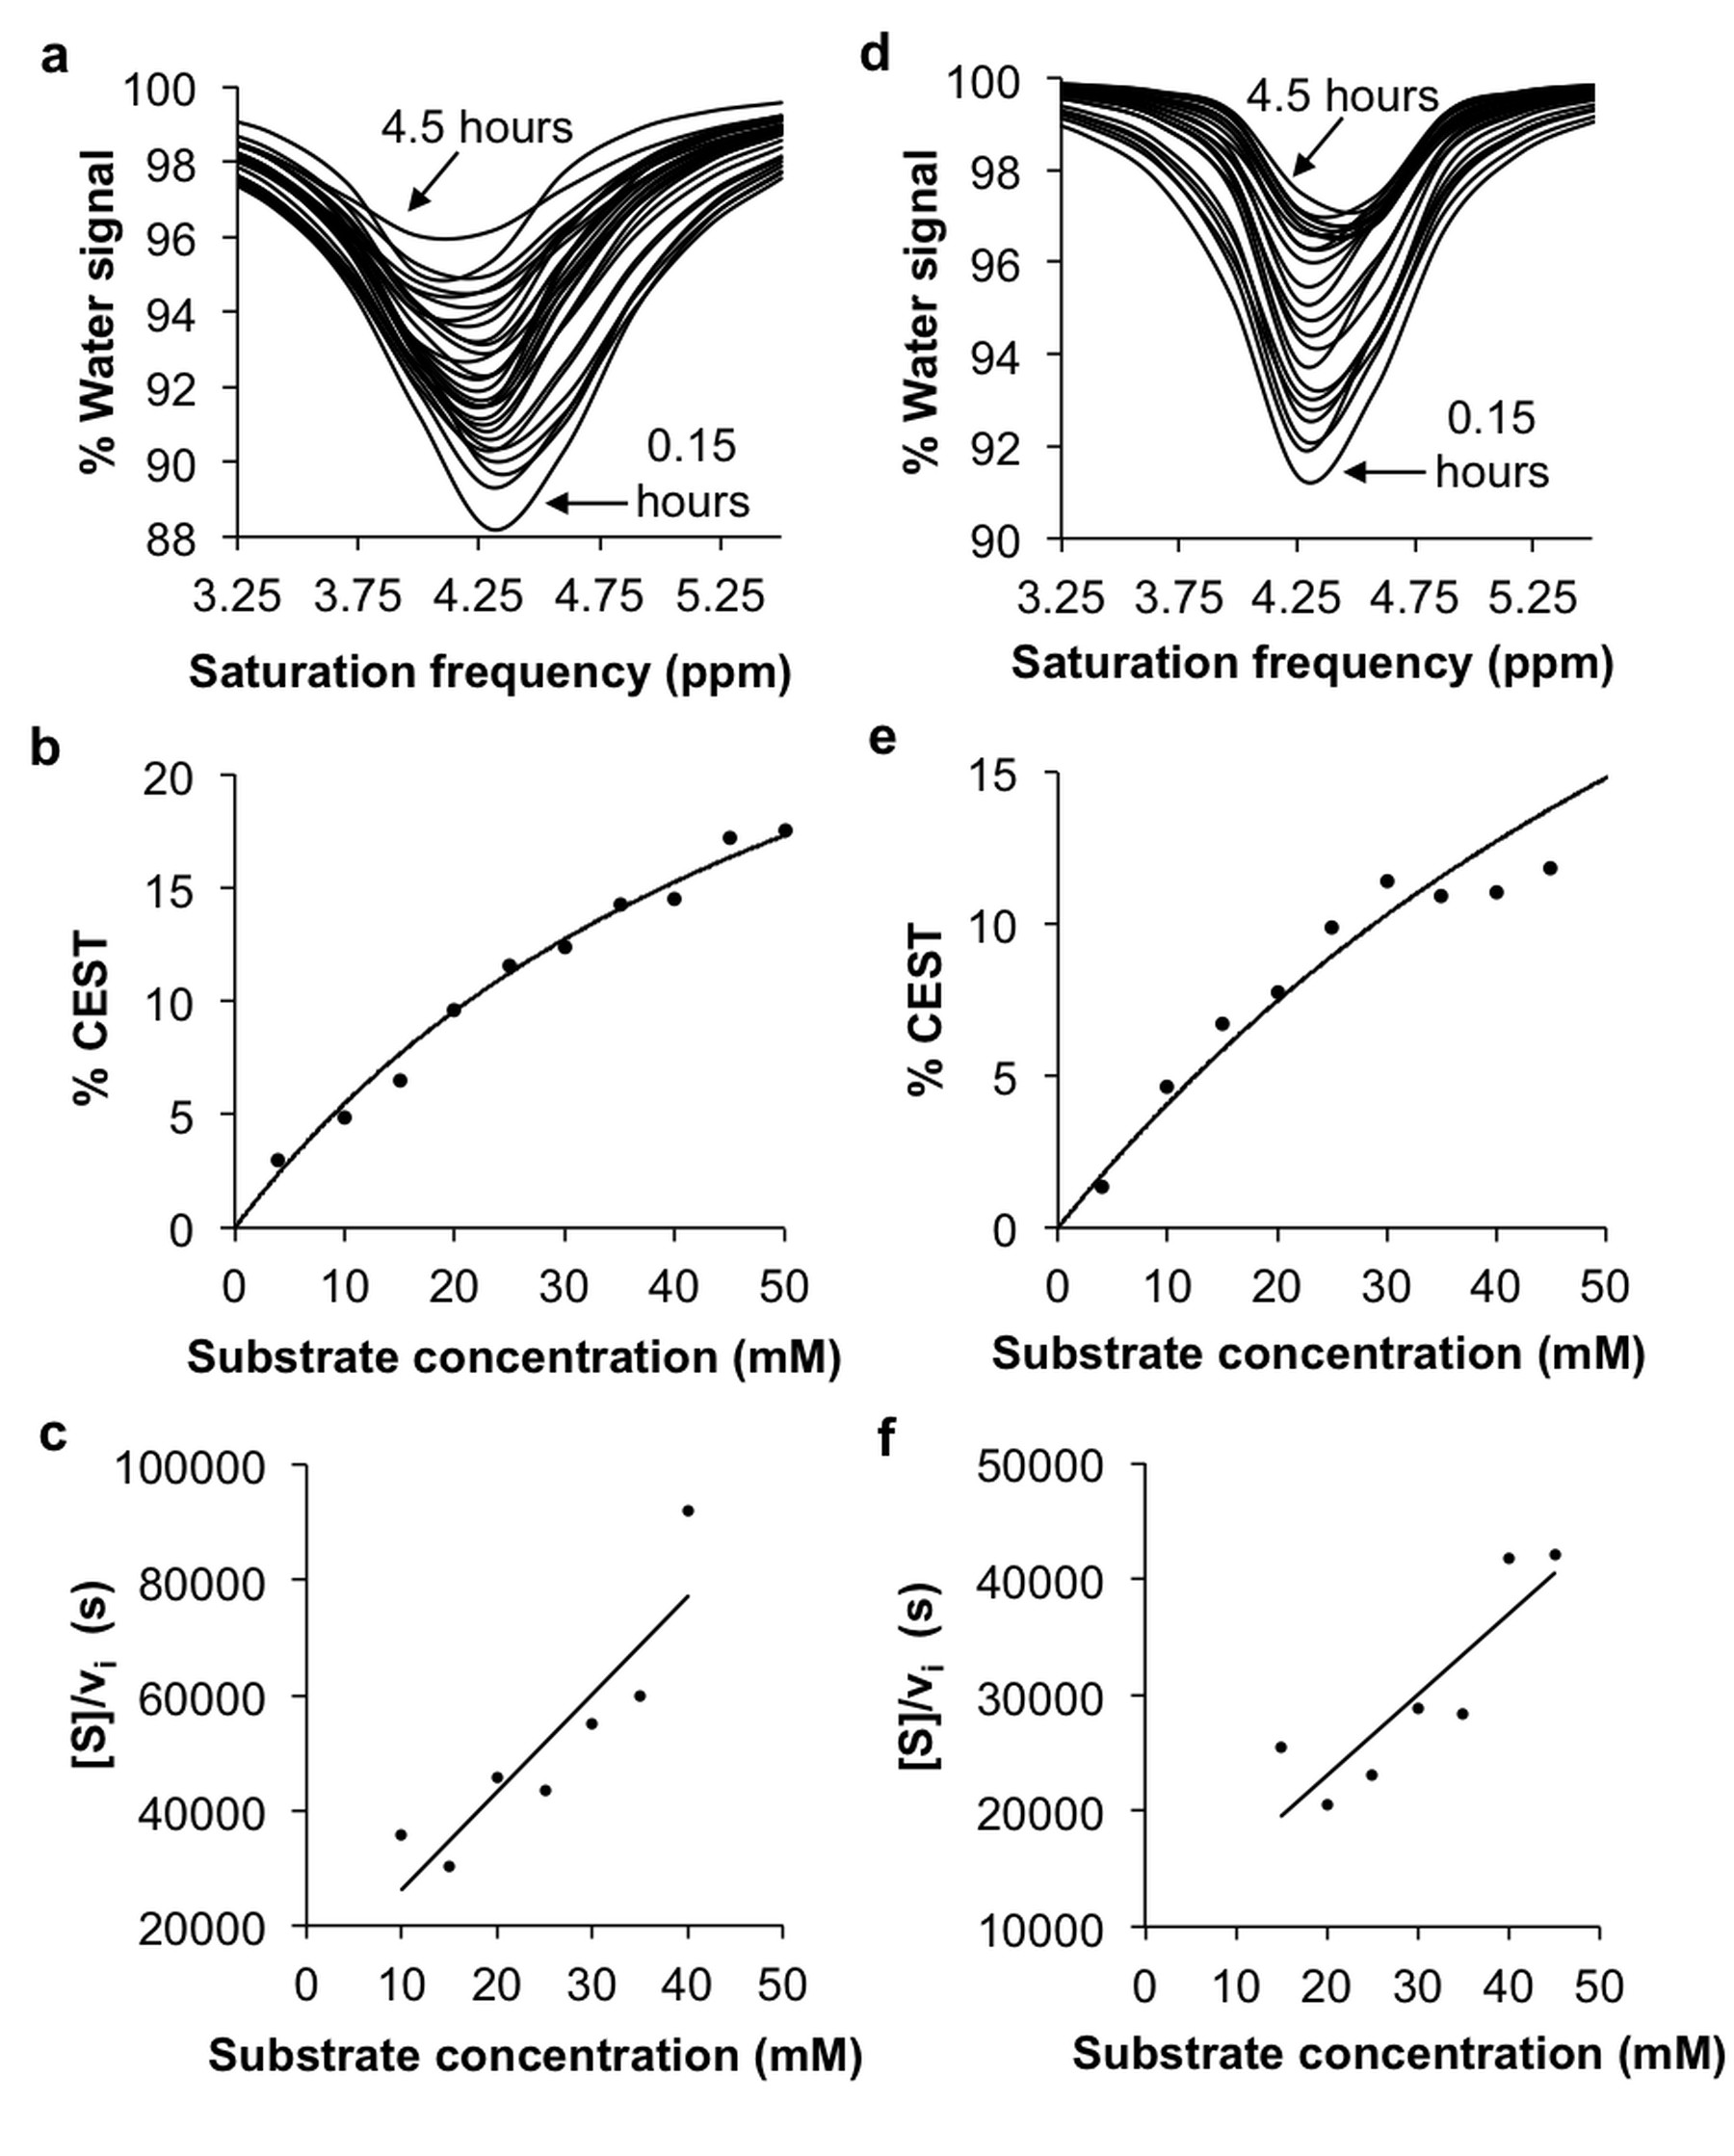
The CEST agents were synthesized, purified and characterized using standard methods. β-gal and β-gus from E. coli were added to substrate concentrations between 0.05 – 50 mM at 37.0±0.2oC. CEST MRI studies were performed with a 7T Bruker Biospec MRI scanner with a 72 mm quadrature transceiver coil. A CEST-FISP acquisition protocol was used to acquire a series of 107 images after selective saturation was applied using a continuous wave pulse at 3 µT power for 4 s with frequencies ranging from 15 to -15 ppm.5 FISP acquisition parameters included TR: 3.196 ms; TE: 1.598 ms; excitation flip angle: 30°; centric encoding; number of averages: 1; matrix: 128x128; field of view: 6.4x6.4 cm; in-plane spatial resolution: 500x500 mm; slice thickness: 1 mm. The temporal resolution of acquiring one image with one selective saturation frequency was 5.441 s. The total time to acquire 107 images for a full CEST spectrum was 9:42 min. For Michaelis-Menten kinetics studies, 75 image sets to generate a 62-point CEST spectrum were collected after selective saturation was applied using a continuous wave pulse at 3 µT power for 4 s with frequencies ranging from 15 to -15 ppm. The same FISP parameters were used. The total acquisition time was 4.5 hours. CEST spectra were analyzed by fitting three Lorentzian line shapes to account for the direct saturation of water and the CEST signals at 4.25 ppm and 9.25 ppm.5 The Lorentzian line shape fitting automatically referenced the bulk water chemical shift at 0 ppm, negating the effect of B0 inhomogeneities in the CEST MR images.
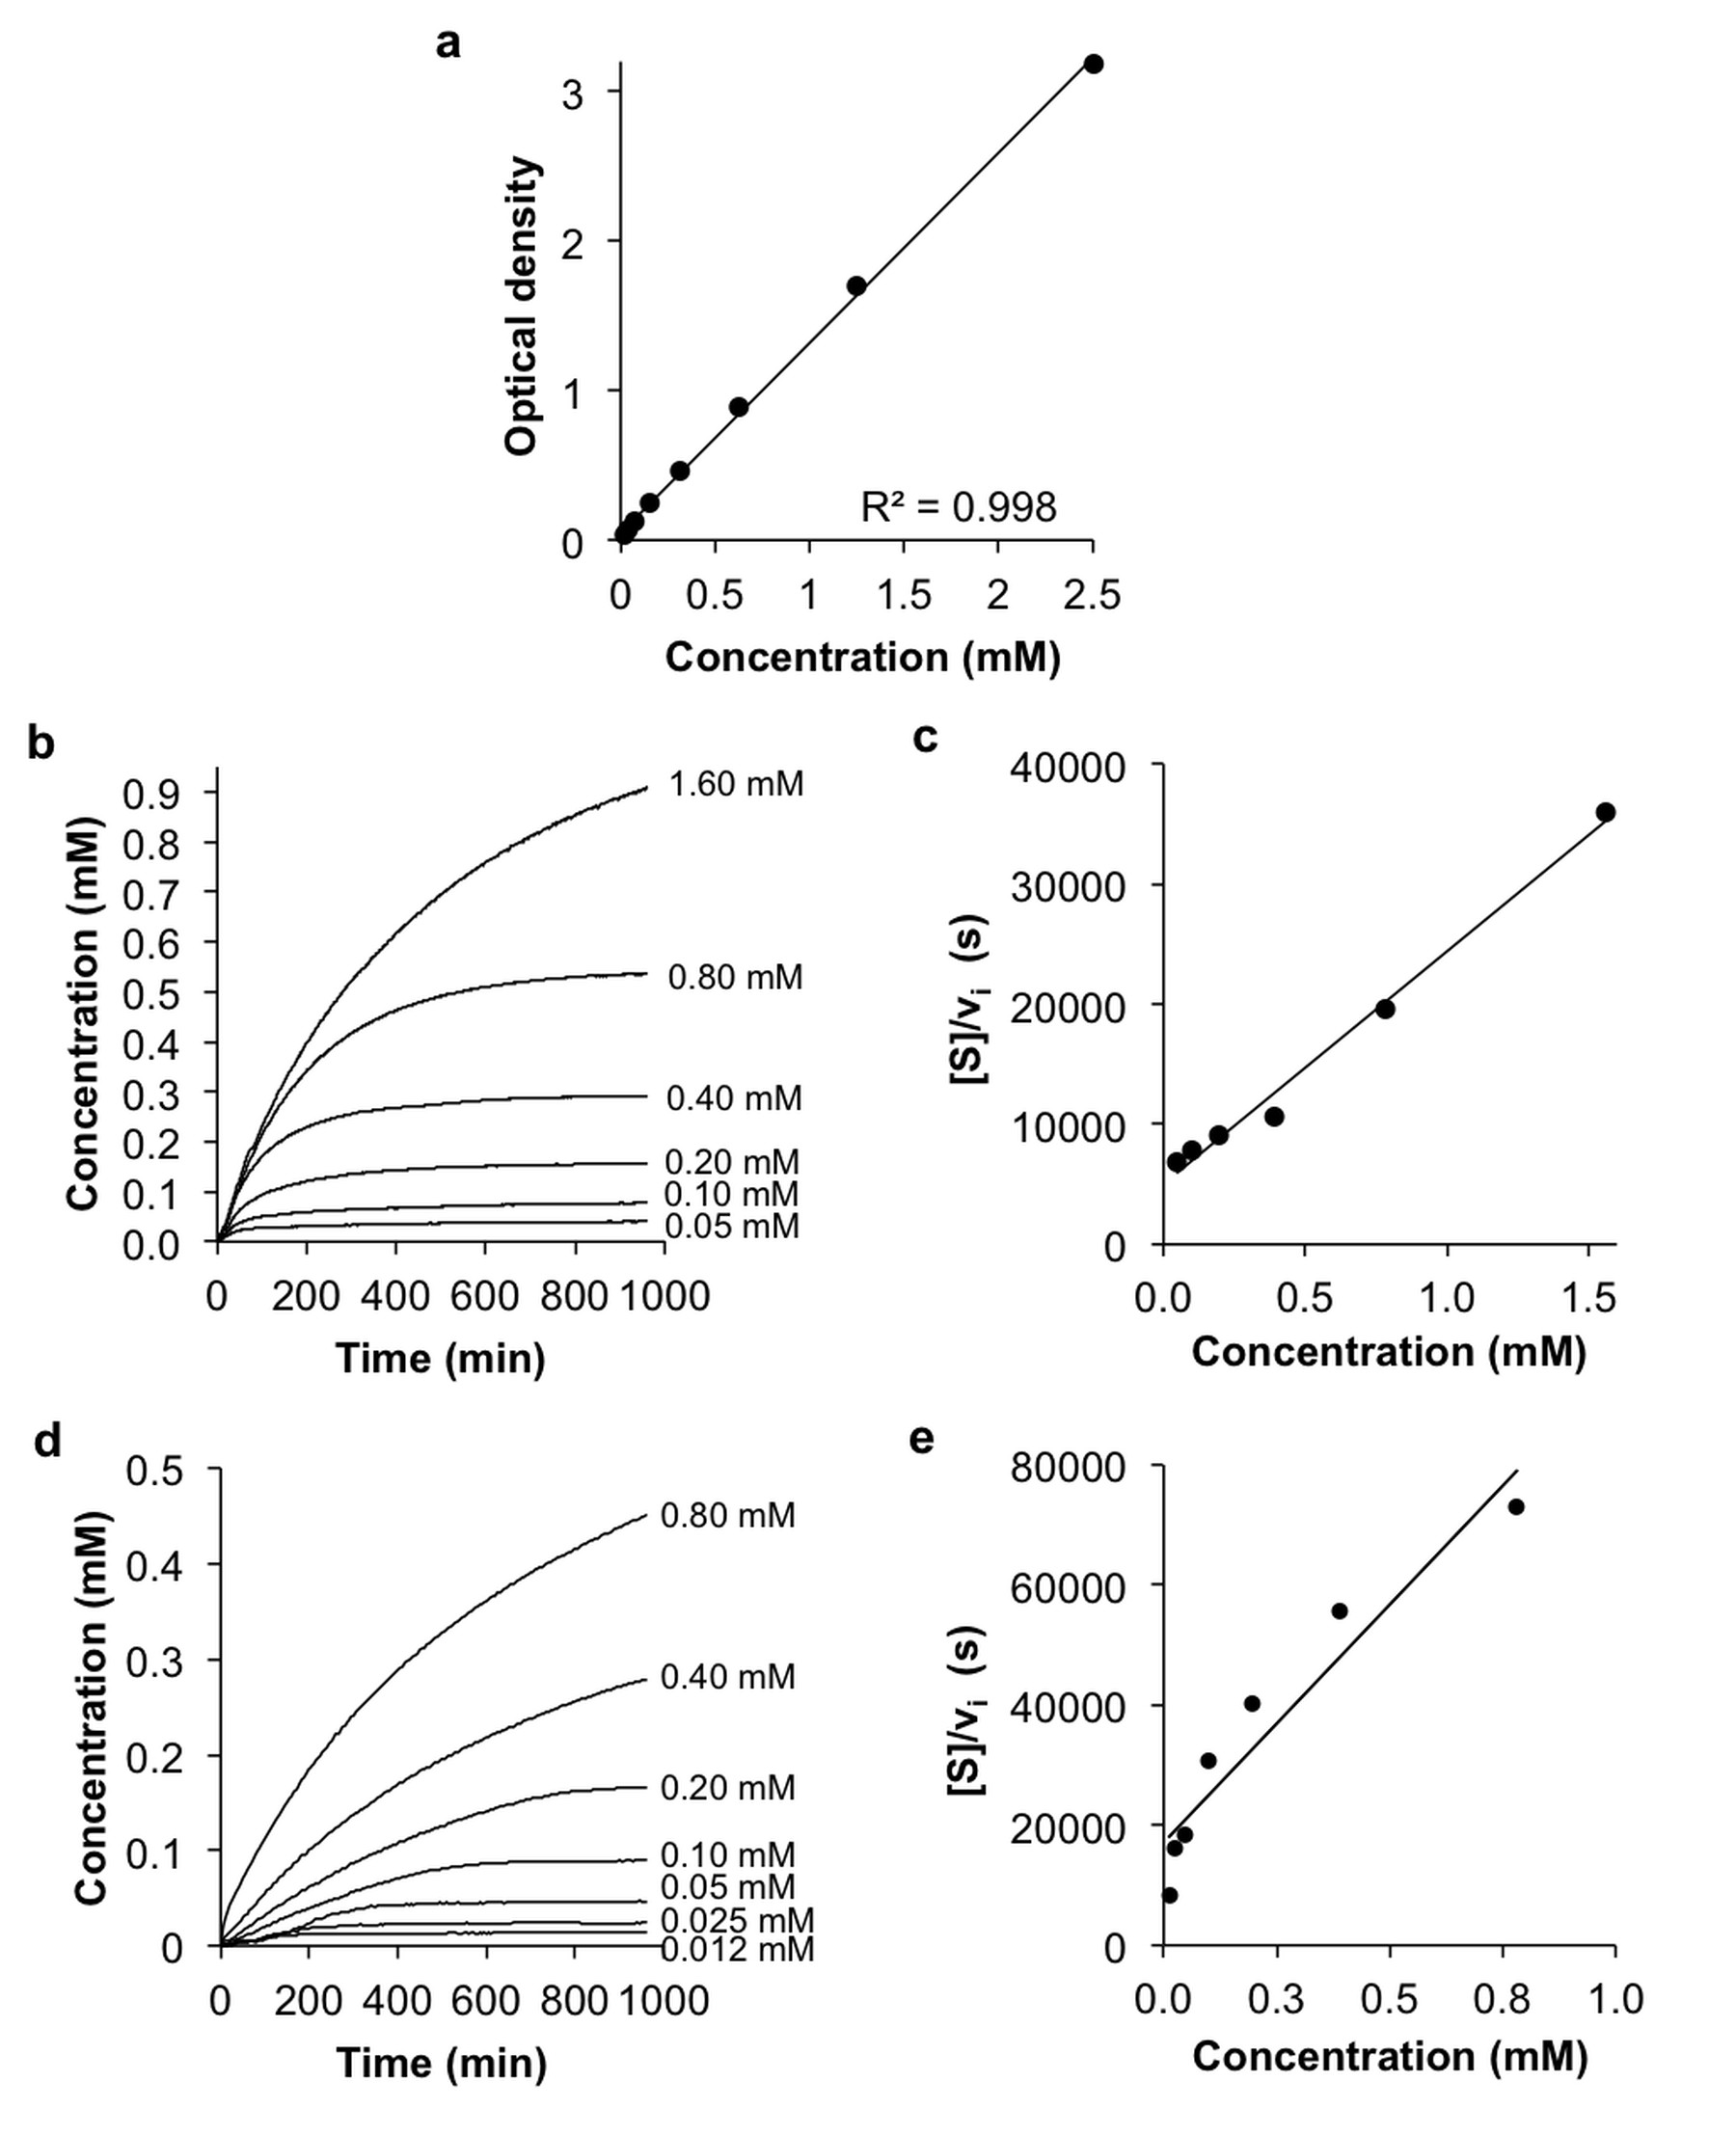
To perform UV-vis enzymatic microplate assays, serial dilutions of appropriate substrate were incubated with 0.125 U of β-gal or 250 U of β-gus enzyme at 37.0 °C for 16 hours. Formation of product was detected by optical absorbance at 425 nm every 2 minutes.
Results
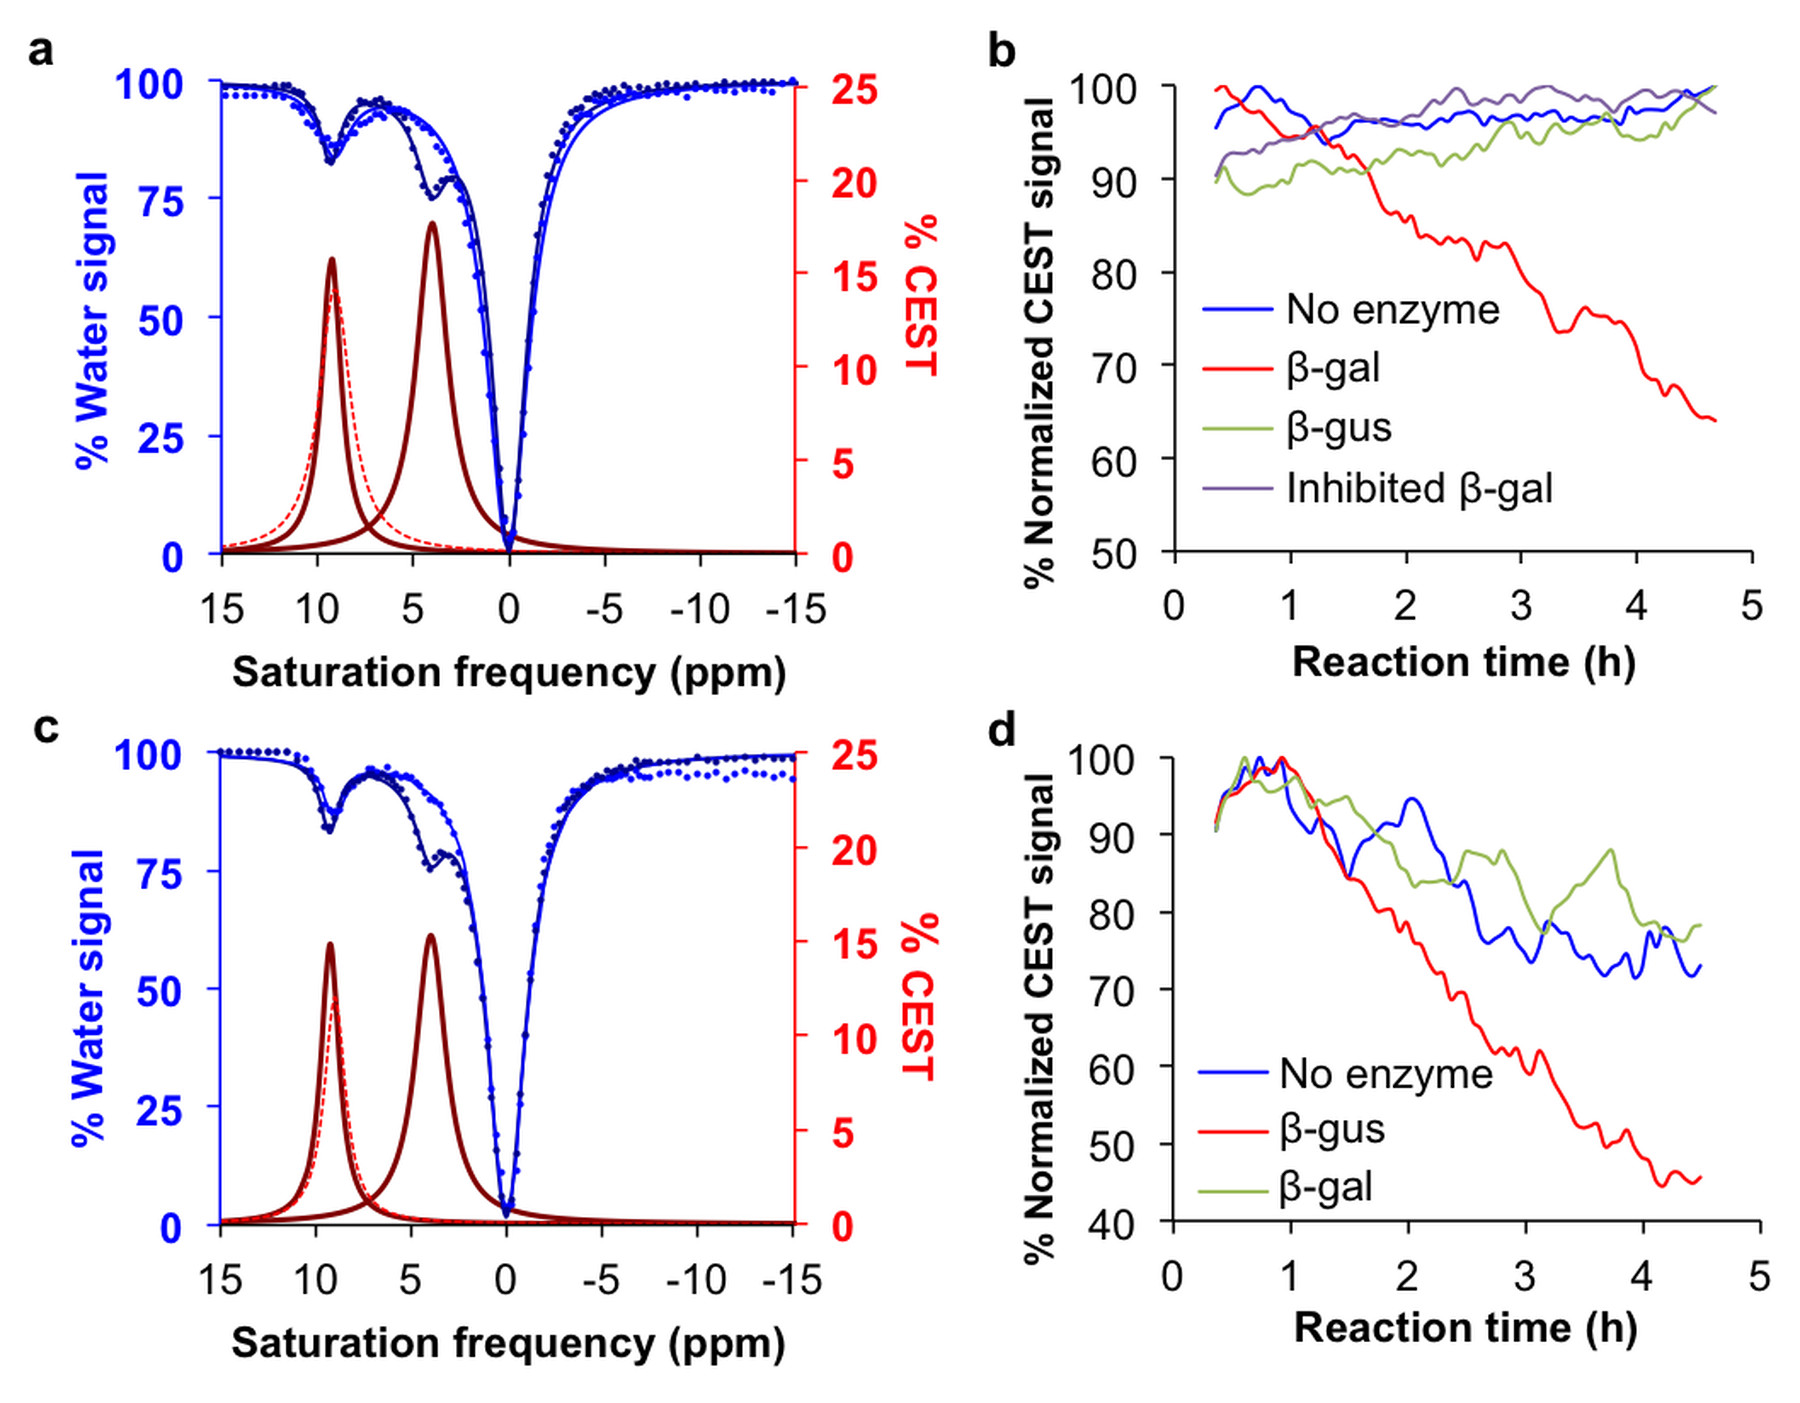
The agents were synthesized with a 5-25% overall yield. Before enzyme hydrolysis, we observed two CEST signals from each agent at 9.25 ppm and 4.25 ppm. In the presence of enzyme, the signal at 9.25 ppm did not change while the signal at 4.25 ppm disappeared, corresponding to the conversion of the agent into 4-amino salicylic acid. The ratio of the CEST peaks effectively detected enzyme activity in a concentration–independent manner. Temporal studies showed that the CEST signal at 4.25 decreased in the presence of the corresponding enzyme for each agent, but remained consistently high in the presence of inhibited enzyme, no enzyme or the presence of the other enzyme for each agent. The temporal disappearance of the CEST signal at 4.25 ppm showed good fitting by the Hanes-Woolf plot (R2 = 0.80 for β-gal and 0.76 for β-gus) demonstrating that the CEST agent followed Michaelis-Menten enzyme kinetics theory. These plots were used to determine the catalytic efficiency and other kinetics parameters for each enzyme. β-gal and β-gus had similar KM constants for the respective contrast agent, demonstrating similar binding affinities for their ligands. β-gal has a faster kcat value than β-gus, indicating faster glycosidic cleavage of the β-gal-detecting agent. We repeated Michaelis-Menten kinetics studies of the agents by monitoring the optical absorption of the spontaneously disassembling spacer. For agents responsive to β-gal, the KM, kcat and catalytic efficiency constants were comparable within an order of magnitude between the analyses performed with catalyCEST MRI and UV-vis studies. For agents responsive to β-gus, the KM and kcat values differed by about two orders of magnitude between each analysis method. This difference was attributed to the minor systematic error caused by the competitive inhibition of β-gus by free glucuronic acid.Discussion
We have shown that diamagnetic CEST agents can detect and quantify the enzyme activities of glycoside hydrolase enzymes. Incorporating the spontaneously disassembling spacer provided a tri-modular design for detecting enzyme catalysis.Acknowledgements
No acknowledgement found.References
1. Yoo B, et al. J Am Chem Soc 2006;128:14032-14033.
2. Yoo B, et al. Contrast Media Mol Imaging 2007;2:189-198.
3. Li Y, et al. Contrast Media Mol Imaging 2011:6;219-228.
4. Yoo B, et al. Tetrahedron Lett 2009:50;4459-4462.
5. Hingorani DV, et al. J Am Chem Soc 2013;135:6396-6398.
6. Hingorani DV, et al. Contrast Media Mol Imaging 2016;11:130-138.
7. Fernández-Cuervo G, et al. Chembiochem 2016;17:383-387.
8. Yoo B, et al. Magn Reson Med 2014:71;1221-1230.
9. Sinharay S, et al. Magn Reson Med 2016, DOI:10.1002/mrm.26278
Figures