3052
Mn2+ uptake mechanisms in organotypic rat hippocampal slice cultures1National Institute of Neurological Disorders and Stroke, National Institutes of Health, Bethesda, MD, United States
Synopsis
MEMRI can be used for different applications such as tracing neuronal connections or functional imaging. However, Mn2+ uptake and transport mechanisms are still unclear. These mechanisms were studied in an organotypic hippocampal slice culture. After adding Mn to the medium, MRI contrast changes were affected by Ca channel manipulation and other metals that use divalent metal transporters. Mn cellular uptake was also affected by both, the presence of glutamate receptor antagonist and a neuronal activity inhibitor. Our results establish hippocampal slice as a system to study the cellular mechanisms related to MEMRI.
PURPOSE
Manganese (Mn2+) Enhanced Magnetic Resonance Imaging (MEMRI) can be used for different applications such as tracing neuronal connections or functional imaging1-3. There are known to be multiple pathways of Mn2+ cell entry, however, mechanisms of Mn2+ cell accumulation and Mn2+ transport are still unclear. Therefore, the aim of this study is to better understand these mechanisms by the use of MEMRI in an organotypic hippocampal slice culture (OHSC). Mn2+ cell uptake under different conditions was studied. They were: (1) in competition with Ca2+ and in presence of Ca channel antagonist (verapamil); (2) in competition with other metals that use divalent metal transporters (DMT1 family) such as Fe and Zn; (3) in presence of AMPA, NMDA and GABA receptor antagonists (NBQX, MK-801 and bicuculline respectively) and (4) in presence of TTX, a Na channel blocker.
METHODS
Animals: Postnatal day six Sprague Dawley rats were used for this study. Slice preparation and culture: Hippocampi were dissected and coronal sections (300 μm) were sliced in an artificial CSF (aCSF) at 4ºC 4. Slices were cultured at the interface medium/air on a membrane insert (incubation at 37 ºC, 5% CO2) for 7 or 8 days (D7, D8). Mn and drug incubation: On D7 or D8, MnCl2 was added at different concentration to the culture medium and at different times before MRI (Fig.1). Zn, Fe, Zn/Fe 1mM, Ca 3mM-6mM, MK-801 and/or NBQX (1 μM), bicuculline (20 μM) or TTX (1 μM) were added to the medium culture at the same time as Mn (2h before MRI). Verapamil 40 μM was added 2h before Mn (4h before MRI). MEMRI: 2h after Mn addition to the medium culture (with or without metal or drug), the membrane insert was cut around the slice, rinse, placed in a perfusion chamber and fixed with a plastic anchor. Slices were continuously perfused with aCSF at room temperature. T1 weighted images (FLASH, TR=25ms, TE=4.65 ms, voxel size: 50 μm3) were acquired on an 11.7T MRI system (Bruker) using a surface/volume cross coil configuration. Data analysis: ROIs were manually drawn around the slice and signal was normalized to the background noise. The signal to noise ratio (SNR) was computed for each ROI and subtracted from the SNR of control slices (without MRI; ΔSNR).
RESULTS
Figure 1 shows MRI images from slices incubated with 10, 25, 50, 100 and 150 μM of MnCl2 after 1, 2, 4 and 24h incubation time. Most of the drugs necessitate 2h of incubation, we choose to work with the 2h incubation at a high (150 μM) and low (25 μM) [MnCl2]. Manipulation of metal transporters and Ca2+ channels affect Mn2+ cell uptake (Fig.2/3). A higher impact on OHSC incubated with the high [MnCl2] was observed in presence of Ca2+ 6mM and verapamil (61% and 54%, respectively compared to 41% and 30% for the low [MnCl2]). Interestingly, antagonism of glutamate receptors induced a decrease of Mn2+ cell uptake only at the low [MnCl2]. GABA antagonist did not change Mn2+ cell accumulation (Fig.4). TTX induced a decrease of Mn cell uptake at a low [MnCl2] (-36%) and unexpectedly an increase at a high [MnCl2] (+52%; Fig.5).
DISCUSSION
At low concentration, Ca2+ channel blockers decreased ~30% of the Mn2+ uptake. Both TTX and verapamil decreased Mn2+ uptake consistently with the model that Mn2+ can enter cells in an activity dependent manner via Ca2+ channels5,6. Metal transporters at the low [MnCl2] explained ~70% of the uptake after 2 hours of MnCl2 incubation7-8. Specific manipulation of neurotransmitter receptors had a smaller effect than blocking Ca2+ channels or any activity in the following order: MK-801 (NMDA9) > NBQX (AMPA) > bicuculline (GABA). It is well known that hippocampal slices of young animals have a large amount of spontaneous activity10, thus, no increase of Mn2+ uptake in presence of GABA antagonist was observed.
At high concentration, similar effect of Ca2+ channels, neurotransmitter receptors and metal transporters were observed. TTX was the exception with an abnormal increase of Mn2+ uptake. The major cell types of OHSC are neurons and astrocytes and it is known that TTX does not alter the number of active astrocytes11. Thus, the increase of Mn cell uptake could correspond to astrocytic uptake. Future study will aim to understand cell specific effects on Mn uptake. In conclusion, MRI of hippocampal slice culture is an excellent way to study the cellular mechanisms related to MEMRI.
Acknowledgements
This study was supported by the Intramural Research Program of the National Institute of Neurologic Disorders and Stroke (NINDS), National Institutes of Health.References
1Lin and Korestky, 1997, MRM, 38:378-388; 2Aoki et al., 2004, Neuroimage, 22:1046-1059; 3Daoust et al., 2014, Neuroimage, 96:133-42; 4Fuller and Dailey, 2007, CSH protocol; 5Narita et al., 1990, Brain Res., 5;510(2):289-95.; 6Wang et al., 2015, PLoS One, 10(5):1-16; 7He et al., 2006, Mol Pharmacol, 70(1):171-80; 8Aschner et al., 2007, Toxicol Appl Pharmacol, 1;221(2):131-47; 9Itoh et al., 2008, Neuropharmacology, 154(2):732-740; 10Mohajerani et al., Eur J Neurosci, 22(1):107-18; 11Aguado et al., 2002, J of Neuroscience, 22(21):9430-44.
Figures
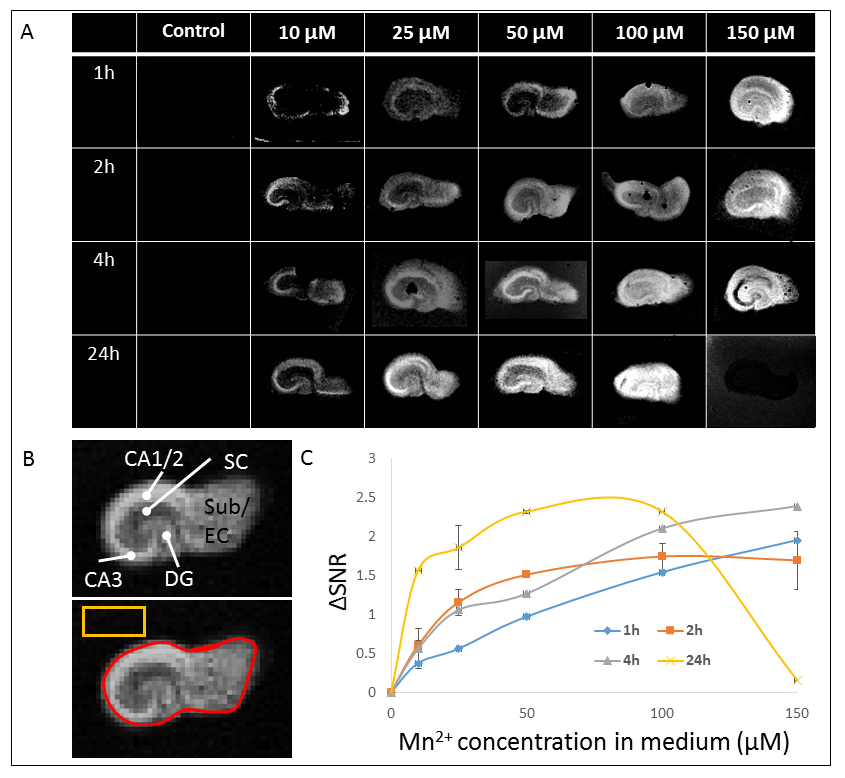
Figure 1: OHCS MRI after Mn incubation.
A- T1-w images of OHSC after Mn incubation at different concentration [0-150 µM] and times (1, 2, 4 and 24h) before MRI.
B- ROIs of OHSC. Red line is the slice contour and the yellow box is the background ROI.
C- ΔSNR as function of Mn concentration in medium and time of Mn incubation.
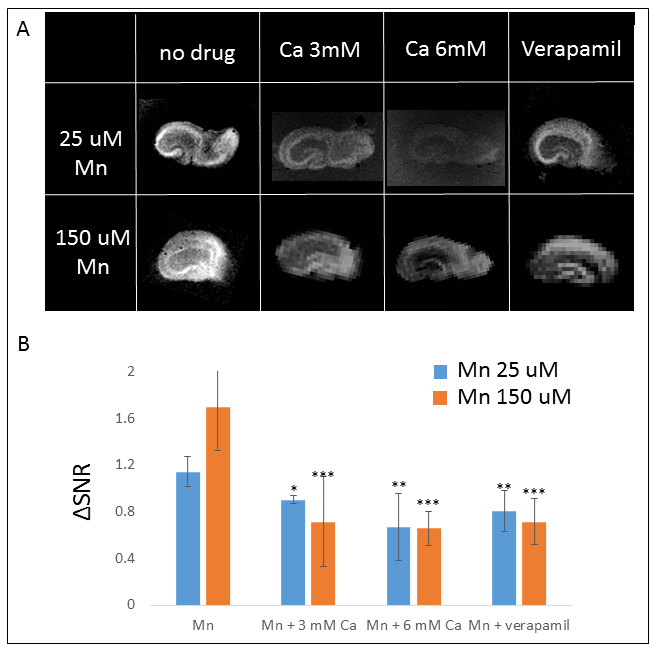
Figure 2: Difference of Mn cell uptake in presence of Ca and Ca antagonist
A. T1-w images of OHSC after Mn incubation with or without an excess of Ca or verapamil.
B. Δ SNR of the OHSC.
n=6 slices; mean±SD; *p<0.05, **p<0.01, ***p<0.005.
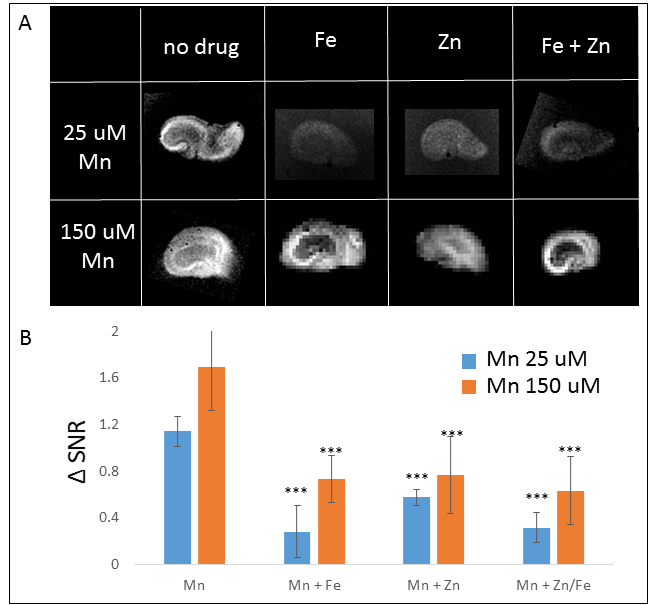
Figure 3: Difference of Mn cell uptake in presence of Fe and Zn.
A. T1-w images of OHSC after Mn incubation with or without an excess of Fe or Zn or Fe/Zn.
B. Δ SNR of the OHSC.
n=6 slices; mean±SD; *p<0.05, **p<0.01, ***p<0.005.
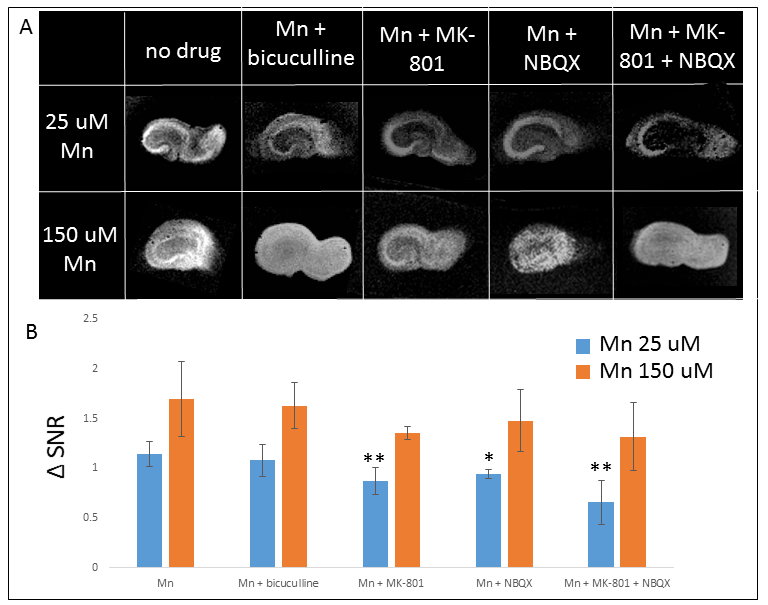
Figure 4: Difference of Mn cell uptake in presence of glutamate and GABA receptors antagonist.
A. T1-w images of OHSC after Mn incubation with or without bicuculine, MK-801 and/or NBQX.
B. Δ SNR of the OHSC.
n=6 slices; mean±SD; *p<0.05, **p<0.01, ***p<0.005.
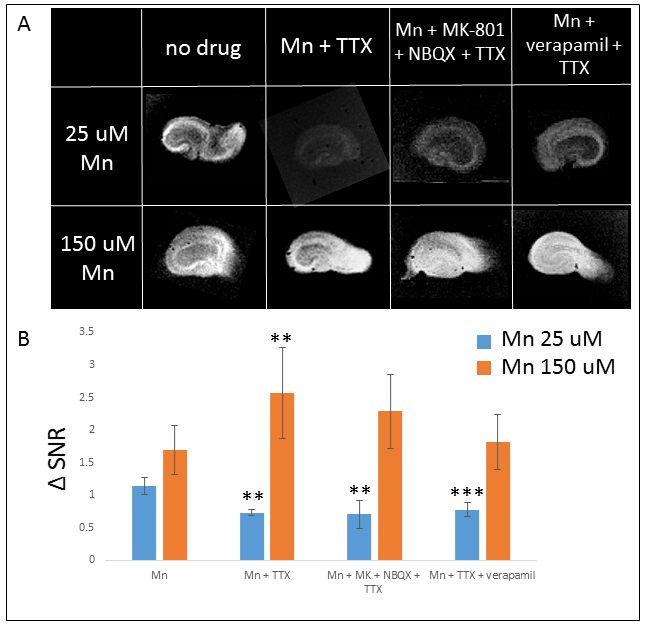
Figure 5: Difference of Mn cell uptake in presence of a neuronal activity blocker.
A. T1-w images of OHSC after Mn incubation with or without TTX, TTX/MK-801/NBQX and TTX/verapamil.
B. Δ SNR of the OHSC.
n=6 slices; mean±SD; *p<0.05, **p<0.01, ***p<0.005.