3048
High Resolution MEMRI Reveals the Purkinje Cell Layer as the Source of Contrast in the Mouse Cerebellum1Kimmel Center for Biology and Medicine at the Skirball Institute of Biomolecular Medicine, New York University School of Medicine, New York, NY, United States, 2Biomedical Imaging Graduate Program and Department of Radiology, New York University School of Medicine, New York, NY, United States, 3Mouse Imaging Centre, The Hospital for Sick Children, Toronto, ON, Canada
Synopsis
Imaging the developing mouse brain with conventional MRI is challenging. Manganese-enhanced MRI (MEMRI) has the potential to provide a noninvasive, in vivo approach for analyzing mutant phenotypes in the early postnatal mouse cerebellum. We present preliminary data generated using a CryoProbe (Bruker) suggesting that the primary source of Mn contrast in the mouse cerebellum is the Purkinje cell layer.
Motivation
Imaging the developing mouse brain with conventional MRI is challenging. The cytoarchitecture, and therefore the overall structure, of the brain changes rapidly. Therefore, it is difficult to optimize/implement protocols as dynamic as normal development – especially in the cerebellum. Manganese-enhanced MRI (MEMRI) has the potential to provide a noninvasive, in vivo approach for analyzing mutant phenotypes in the early postnatal mouse cerebellum. The high contrast-to-noise ratio (CNR) afforded by apparent specific uptake of Mn has been exploited by many groups1–7; however the cells responsible for Mn uptake have still not been identified conclusively. We present preliminary data generated using a 4-element CryoProbe (Bruker) suggesting that the primary source of Mn contrast in the mouse cerebellum is the Purkinje cell layer (PCL) – a thin layer of Purkinje neurons and Bergmann glia.Methods
5-week old wild type C57BL/6 mice were injected with MnCl2 (50-60 mg/kg) intraperitoneally 24 hours before imaging. Mice were anesthetized with Isofluorane and maintained at physiological temperatures throughout the protocol. Imaging sessions were conducted using a 7-Tesla small-animal MRI (BioSpec, Bruker), scan protocol as follows: 1 min low resolution localizer; 10 minute 150µm isotropic resolution 3D T1-weighted, self-gated FLASH (Matrix = 133 X 133 X 80, TR = 50ms, TE = 6.65ms, NA = 1, FA = 20°); 15 minute 100µm isotropic resolution 3D T1-weighted, self-gated FLASH (Matrix = 256 X 256 X 100, TR = 31.62ms, TE = 12.8ms, NA = 1, FA = 20°); 20 minute 60µm in-plane 2D T1-weighted, self-gated FLASH (Matrix = 256 X 128, Slice Thickness = 500µm, TR = 40, TE = 6ms, NA = 120, FA = 42.5°); and 2hr 30µm in-plane 2D T1-weighted, self-gated FLASH (Matrix = 512 X 256, Slice Thickness = 500µm, TR = 40ms, TE = 6ms, NA = 120, FA = 42.5°, NR = 6). 2D, high-resolution images were reconstructed, registered, and averaged offline in ImageJ. Thick-slice sagittal images were acquired in a region of the vermis without appreciable changes in morphology.Results
3D MEMRI results acquired using a conventional Litzcage volume coil (Doty Scientific) required 2hr acquisition time to produce 100µm isotropic resolution images, whereas images acquired at the same resolution using the CryoProbe (Bruker) required only 15 minutes. In addition, significant CNR gains in the cerebellum were also afforded by the CryoProbe (Conventional CNR = 23, CyoProbe CNR = 36). However, the 4-channel surface coil architecture of the CryoProbe contributed some receive field inhomogeneity-borne artifacts in the posterior cerebellum as well as the forebrain with respect to the conventional volume coil (Fig 1).
High-resolution (30µm and 60µm in-plane) CryoProbe MEMRI results showed Mn uptake localized in a thin, uniform thickness band interior to the molecular layer and exterior to the normally hypointense white matter tracts (Fig 2). Partial-volume effects were apparent in the 60µm in-plane resolution image, and were mitigated in the higher resolution 30µm acquisition. Based on these features, and qualitative correlation to matched histology sections, there is a strong likelihood that the primary source of Mn contrast in the mouse cerebellum is the PCL.
Discussion and Future Directions
CryoProbe-MEMRI has the potential to finally identify the source of Mn contrast in the mouse cerebellum. Previous reports have suggested other potential sources for the contrast, however these findings may have been limited by partial volume effects or CNR limitations. Although these preliminary results strongly suggest the PCL is the source, more cell-specific histological and/or cytological analysis is necessary to attribute Mn uptake to either the Purkinje or Bergmann glial cells. This is particularly interesting considering the high granule cell Mn uptake in the hippocampus. We plan to repeat these imaging experiments in a larger number of animals, as well as corroborate our findings using FACS and immunohistology.Acknowledgements
No acknowledgement found.References
1. Koretsky, A. P. & Silva, A. C. Manganese-enhanced magnetic resonance imaging (MEMRI). NMR Biomed. 17, 527–531 (2004).
2. Lin, Y.-J. & Koretsky, A. P. Manganese ion enhances T1-weighted MRI during brain activation: An approach to direct imaging of brain function. Magn. Reson. Med. 38, 378–388 (1997).
3. Wadghiri, Y. Z. et al. Manganese-enhanced magnetic resonance imaging (MEMRI) of mouse brain development. NMR Biomed. 17, 613–9 (2004).
4. Yu, X., Wadghiri, Y. Z., Sanes, D. H. & Turnbull, D. H. In vivo auditory brain mapping in mice with Mn-enhanced MRI. Nat. Neurosci. 8, 961–968 (2005).
5. Deans, A. E., Wadghiri, Y. Z., Berrios-Otero, C. A. & Turnbull, D. H. Mn enhancement and respiratory gating for in utero MRI of the embryonic mouse central nervous system. Magn. Reson. Med. 59, 1320–1328 (2008).
6. Szulc, K. U. et al. 4D MEMRI atlas of neonatal FVB/N mouse brain development. Neuroimage 118, 49–62 (2015).
7. Suero-Abreu, G. A. et al. In vivo Mn-enhanced MRI for early tumor detection and growth rate analysis in a mouse medulloblastoma model. Neoplasia 16, 993–1006 (2014).
Figures
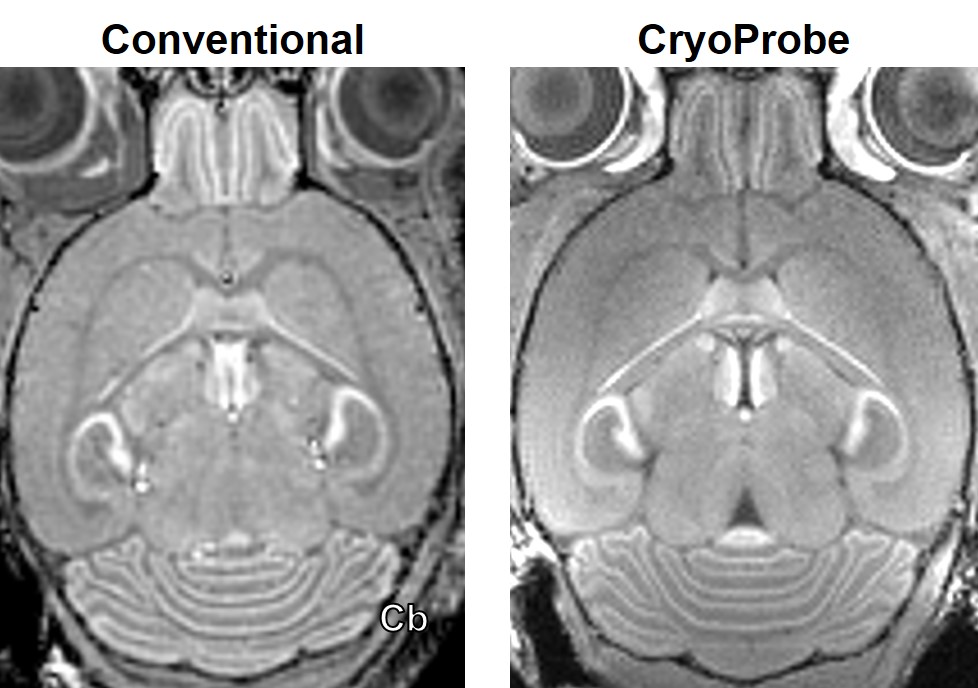
Figure 1. 3D, 100µm isotropic resolution MEMRI images acquired using either a conventional volume coil or a 4-channel Bruker CryoProbe. Images acquired using the CryoProbe provide increased CNR in the cerebellum (Cb) at the cost of minor SNR loss and increased field inhomogeneity artifacts.
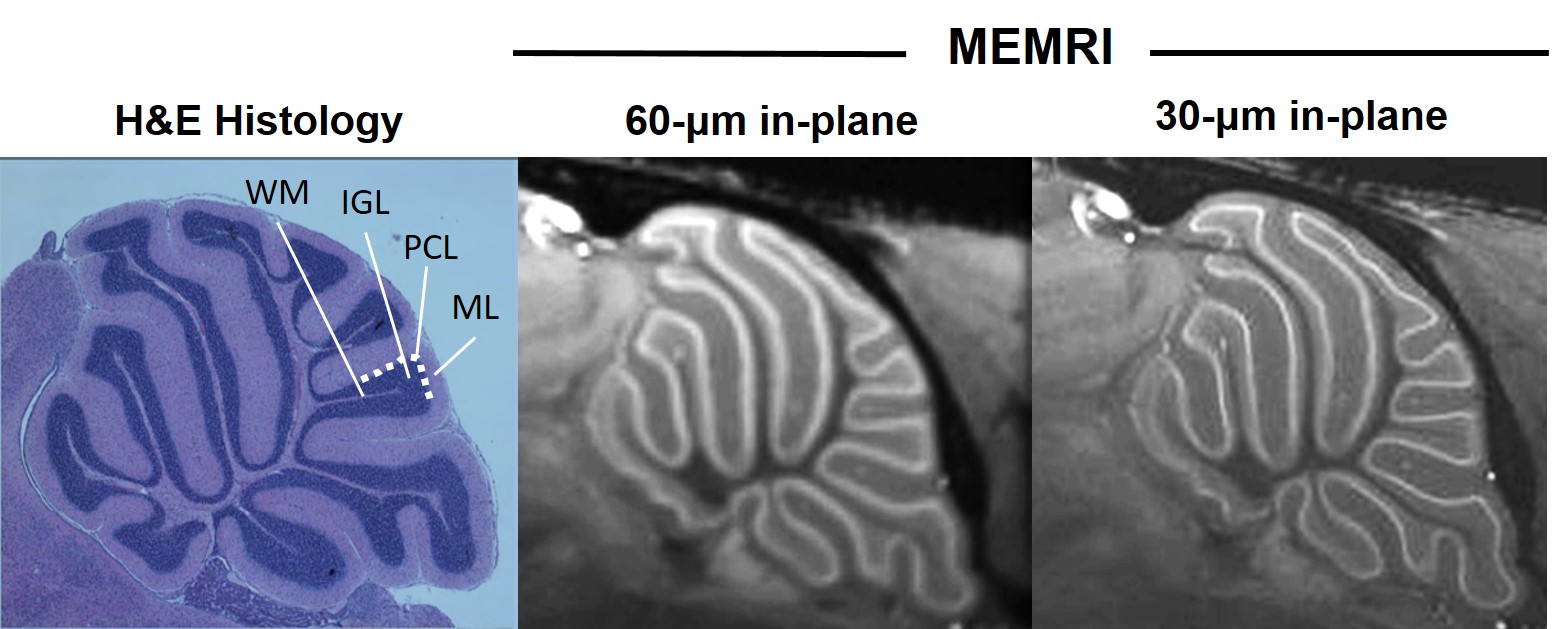
Figure 2. High-resolution 2D MEMRI images produced using CryoProbe show exquisite correlation to histopathology. A thin, uniform thickness band of hyperintensity in the MEMRI images suggests that the source of Mn contrast in the mouse cerebellum is the Purkinje cell layer (PCL). Interior to this layer is the inner granule layer (IGL), and hypointense white matter tracts (WM). Exterior to this layer is the molecular layer (ML).