3047
Whole-Brain Visualization of Manganese Deposition in Welders1Purdue University, West lafayette, IN, United States, 2Indiana University School of Medicine, Indianapolis, IN, United States, 3Department of Psychiatry, Indiana University School of Medicine, Indianapolis, IN, United States, 4Department of Radiology and Imaging Sciences, Emory University, Atlanta, GA, United States
Synopsis
While the paramagnetic properties of Mangnaese (Mn) make it useful as a contrast agent for MRI, little is known about the spatial distribution of Mn deposition in the human brain due to occupational Mn exposure. Using a novel approach to analyze and visualize whole brain Mn deposition in welders, Mn was elevated in motor and cognitive associated networks, consistent with respective reports on impaired neuropsychological function. Our Mn maps even reveal the diffusion of Mn along white matter tracts for the first time in humans. These findings help explain how Mn exposure affects the function of particular brain networks.
Purpose
Manganese (Mn) can serve as a contrast agent for MRI1 due to its paramagnetic property resulting in hyperintensities in T1 weighted images2,3. Yet, Mn is known to be neurotoxic and chronic exposure to Mn, even in occupational settings such as welding, can lead to cognitive and motor deficits4,5. Several studies have shown that changes in T1 due to elevated Mn deposition in specific brain regions, mainly within the basal ganglia, may be correlated with cognitive deficits6–8. Recent research on Mn-exposed non-human primates manifested a more widespread accumulation of Mn in white matter and cortex9 while neurobehavioral exams also revealed cortical dysfunction, including impaired short-term memory, computational ability and visuospatial learning in non-human primates10,11 and Mn-exposed workers12,13. Yet, an in-vivo systematic and quantitative whole-brain analysis of Mn accumulation, including cortical brain areas, is still lacking to date. To further study the relationship between exposure, brain function and Mn accumulation, we developed a 3D whole-brain MRI approach to visualize Mn in welders.Methods
Thirty welders from a truck-trailer manufacturer (Mn in air: 0.18±0.16 mg/m3) and twenty non-exposed matched controls from the same factory received an MRI exam on a 3T GE Signa scanner with an 8-channel head coil. A high-resolution T1-weighted sequence (FSPGR, TR/TE: 6.26/2.67 ms, resolution: 0.9x0.9x1 mm3), a T1 map using two 3D spoiled gradient echo sequences (TR/TE: 6.36/1.76 ms, flip angles: 3°,17°, resolution: 1x1x2 mm3) and a B1 map, used to correct RF inhomogeneity14, were acquired. T1 maps were calculated in Matlab as described previously15. All images were first co-registered and normalized to the MNI-152 template. A“Mn map” was then created by computing significant differences (p<0.005) of Mn deposition between controls and welders by two sample t-tests in SPM12 on a voxel-by-voxel basis. Mn deposition correlating with neuropsychological test scores, including motor and cognitive assessments, were computed by multiple regression with p<0.005.Results
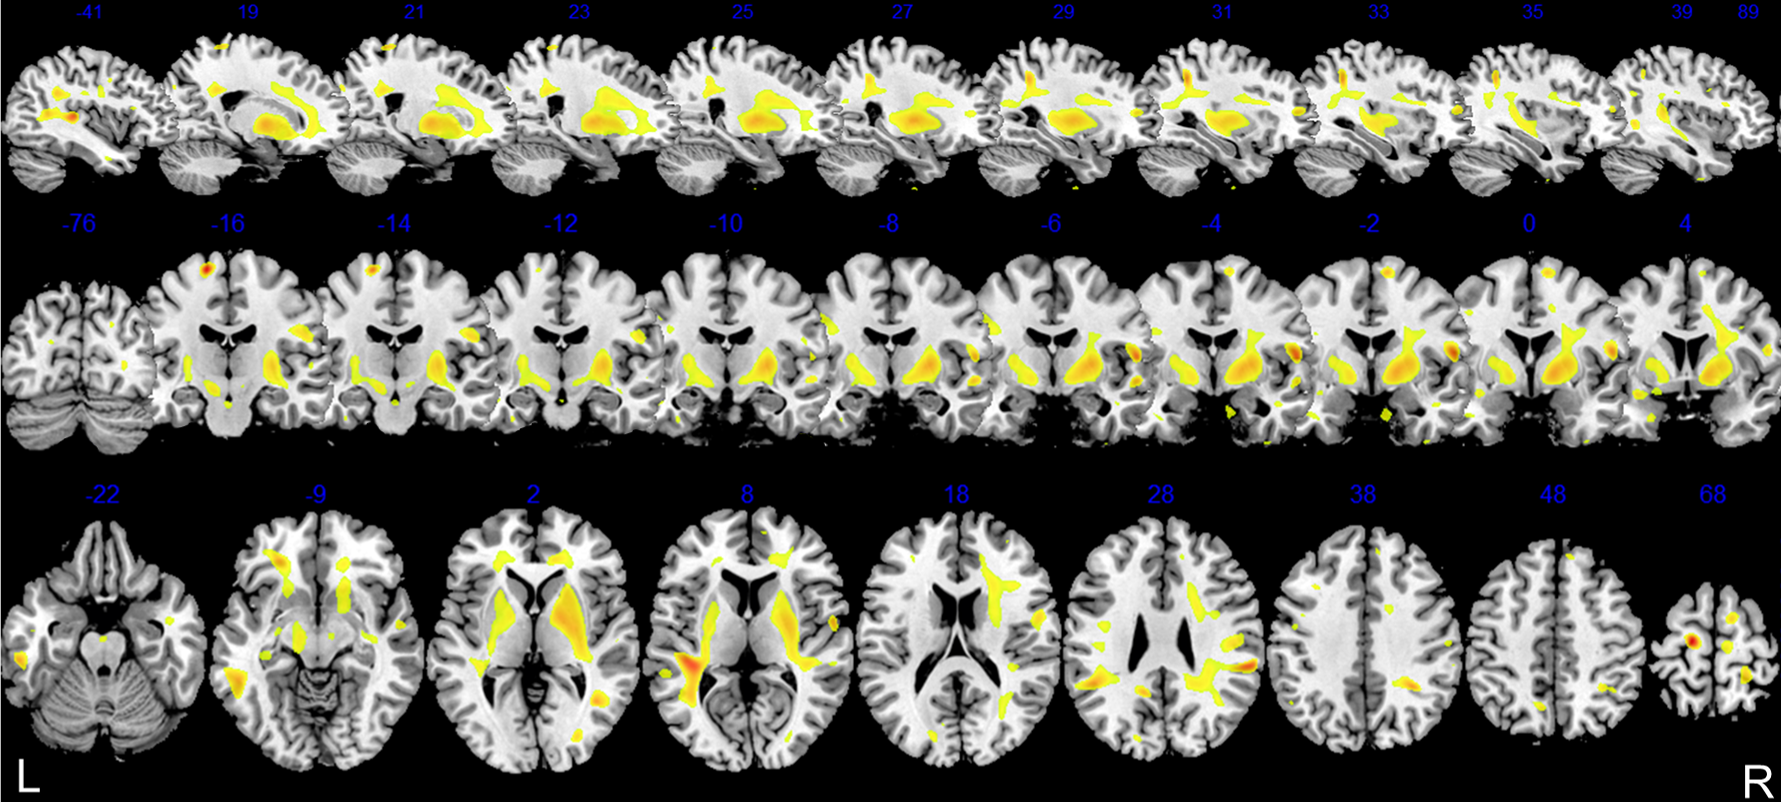
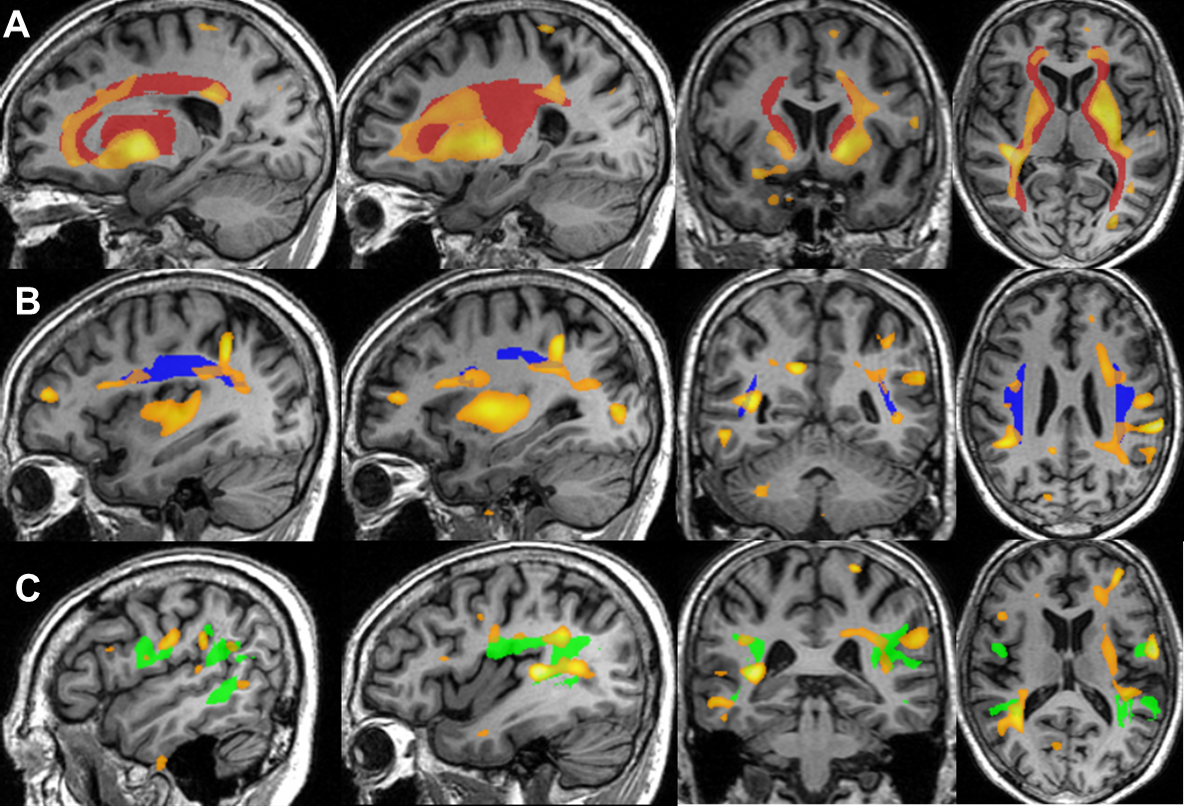
A wide-spread accumulation of Mn throughout the whole-brain was discerned by the Mn map (Figure 1). Higher R1 (=1/T1), representing higher Mn accumulation, was found in the basal ganglia, the primary brain target of Mn16. In cortical regions, significantly higher R1 values were found in the superior frontal gyrus (SFG) and inferior parietal lobule (IPL); supplementary motor area (SMA), primary motor cortex (M1) and somatosensory cortex (S1); primary visual cortex (V1), secondary visual cortex (V2), superior parietal gyrus (SPG) and inferior temporal gyrus (ITG). Our Mn map also allowed visualization of Mn deposition along the internal capsule and superior longitudinal fasciculus connecting basal nuclei to the frontal lobe and inferior parietal lobe to the premotor cortex, respectively (Figure 2). Whole-brain pixel-by-pixel correlation maps showed that R1 in SMA correlated with poorer grooved pegboard performance (fine motor skills). R1 in Wernicke’s area and the middle frontal lobe correlated with lower verbal learning scores. R1 in the prefrontal cortex was found to correlate with poorer performance on a verbal fluency task.Discussion
By assorting brain regions of higher R1 with functions, we found measurable Mn deposition covering motor network, working memory network, and visual associated networks in the typical occupational exposure setting. Together with the motor control center, the basal ganglia, primary and supplementary motor areas pointed toward an effect on the motor regulation network17, evidenced by the correlation on the fine motor dexterity task. Increased Mn in superior frontal gyrus and inferior parietal lobules, correlating with verbal learning and fluency tasks, consisted with fMRI results of altered working memory18. Elevated Mn in primary and secondary visual cortex, SPG and ITG, are visual association areas19. Importantly, we see a significant deposition of Mn in specific white matter tracts, which didn’t correlate with neuropsychological tests as expected, but connect the high Mn regions we found in gray matter. It is assumed this reflects the diffusion or transport of Mn throughout the brain1.Conclusion
Our whole-brain visualization of excessive brain Mn reveals significant Mn deposition in cerebral cortex and in white matter tracts of welders. Mn accumulation in motor and visuospatial pathways is consistent with neuropsychological impairments in non-human primates11 and welders20. The statistically higher Mn accumulation in white matter tracts, which displays the diffusion of Mn in the brain, is connecting different functional cortical regions with higher Mn deposition. These findings allow visualization of increased Mn accumulation in the motor regulation and cognitive networks, which are related to reported impaired neurobehavior as a result of Mn exposure.Acknowledgements
This study is supported by NIEHS R01 ES020529References
1. Massaad CA, Pautler RG. Manganese-enhanced magnetic resonance imaging (MEMRI). Methods Mol Biol. 2011;711:145-174. doi:10.1007/978-1-61737-992-5_7.
2. Bearer EL, Falzone TL, Zhang X, Biris O, Rasin A, Jacobs RE. Role of neuronal activity and kinesin on tract tracing by manganese-enhanced MRI (MEMRI). Neuroimage. 2007;37 Suppl 1:S37-46. doi:10.1016/j.neuroimage.2007.04.053.
3. Inoue T, Majid T, Pautler RG. Manganese enhanced MRI (MEMRI): Neurophysiological applications. Rev Neurosci. 2011;22(6):675-694. doi:10.1515/RNS.2011.048.
4. Bowler RM, Gocheva V, Harris M, et al. Prospective study on neurotoxic effects in manganese-exposed bridge construction welders. Neurotoxicology. 2011;32(5):596-605. doi:10.1016/j.neuro.2011.06.004.
5. Meyer-Baron M, Schäper M, Knapp G, et al. The neurobehavioral impact of manganese: Results and challenges obtained by a meta-analysis of individual participant data. Neurotoxicology. 2013;36:1-9. doi:10.1016/j.neuro.2013.02.003.
6. Yeh C-L, Zauber E, Snyder S, Long Z, Dydak U. Motor and Cognitive Processing Networks show increased Manganese Accumulation in Metal Workers. In: The 22th Annual Meeting of ISMRM, Milan, Italy. ; 2014:5363.
7. Middleton F a, Strick PL. Anatomical evidence for cerebellar and basal ganglia involvement in higher cognitive function. Science (80). 1994;266(5184):458-461. doi:10.1126/science.7939688.
8. Lee E-YY, Flynn MR, Du G, et al. T1 relaxation rate (R1) indicates nonlinear mn accumulation in brain tissue of welders with low-level exposure. Toxicol Sci. 2015;146(2):281-289. doi:10.1093/toxsci/kfv088.
9. Guilarte TR, McGlothan JL, Degaonkar M, et al. Evidence for cortical dysfunction and widespread manganese accumulation in the nonhuman primate brain following chronic manganese exposure: a 1H-MRS and MRI study. Toxicol Sci. 2006;94(2):351-358. doi:10.1093/toxsci/kfl106.
10. Schneider JS, Decamp E, Koser AJ, et al. Effects of chronic manganese exposure on cognitive and motor functioning in non-human primates. Brain Res. 2006;1118(1):222-231. doi:10.1016/j.brainres.2006.08.054.
11. Schneider JS, Williams C, Ault M, Guilarte TR. Chronic manganese exposure impairs visuospatial associative learning in non-human primates. Toxicol Lett. 2013;221(2):146-151. doi:10.1016/j.toxlet.2013.06.211.
12. Ellingsen DG, Konstantinov R, Bast-Pettersen R, et al. A neurobehavioral study of current and former welders exposed to manganese. Neurotoxicology. 2008;29(1):48-59. doi:10.1016/j.neuro.2007.08.014.
13. Cowan DM, Zheng W, Zou Y, et al. Manganese exposure among smelting workers: Relationship between blood manganese-iron ratio and early onset neurobehavioral alterations. Neurotoxicology. 2009;30(6):1214-1222. doi:10.1016/j.neuro.2009.02.005.
14. Deoni SCL, Rutt BK, Peters TM. Rapid combined T1 and T2 mapping using gradient recalled acquisition in the steady state. Magn Reson Med. 2003;49(3):515-526. doi:10.1002/mrm.10407.
15. Sabati M, Maudsley A a. Fast and high-resolution quantitative mapping of tissue water content with full brain coverage for clinically-driven studies. Magn Reson Imaging. 2013;31(10):1752-1759. doi:10.1016/j.mri.2013.08.001.
16. Lakhan S, Abboud H. Teaching NeuroImages: Manganese neurotoxicity of the basal ganglia and thalamus. Neurology. 2013;81(14):2013. doi:10.1212/WNL.0b013e3182a6cb86.
17. Picard N, Strick PL. Motor areas of the medial wall: a review of their location and functional activation. Cereb Cortex. 1996;6(3):342-353. doi:10.1093/CERCOR/6.3.342.
18. Chang Y, Lee J-JJ, Seo J-HH, et al. Altered working memory process in the manganese-exposed brain. Neuroimage. 2010;53(4):1279-1285. doi:10.1016/j.neuroimage.2010.07.001.
19. Orban G a, Van Essen D, Vanduffel W. Comparative mapping of higher visual areas in monkeys and humans. Trends Cogn Sci. 2004;8(7):315-324. doi:10.1016/j.tics.2004.05.009.
20. Huang C, Chu N, Lu C, Al E. Chronic manganese intoxication. Arch Neurol. 1989;46(10):1104-1106. http://dx.doi.org/10.1001/archneur.1989.00520460090018.
Figures