3040
Spatio-temporally constrained reconstruction for hyperpolarized carbon-13 MRI using kinetic models1Electrical Engineering & Computer Sciences, University of California, Berkeley, Berkeley, CA, United States, 2Radiology & Biomedical Imaging, UCSF, San Francisco, CA, United States, 3Medicine, UCSF, San Francisco, CA, United States, 4Clinical Pharmacy, UCSF, San Francisco, CA, United States
Synopsis
We present a method of generating metabolism maps from dynamic hyperpolarized carbon-13 MRI images. By incorporating prior information into our model-based reconstruction via spatial regularization of the parameter maps, we achieve two qualitative benefits: elimination of non-identifiability in unperfused background regions, and denoising. This method is illustrated on a simulated dataset and a clinical prostate cancer dataset.
Purpose
MRI using hyperpolarized carbon-13 is challenging due to the dynamic nature of the data collected, the low signal-to-noise ratio (SNR), and the difficulty of presenting large data sets consisting of dynamic spectroscopic images in an interpretable manner. Metabolism mapping by estimating parameters in a kinetic model from hyperpolarized MRI data has been shown to be useful for overcoming a number of these challenges.1 Constraining the time evolution of signal in a given voxel to follow a kinetic model has been shown to allow map reconstruction from noisy, undersampled dynamic images, and to reduce the number of signal-depleting excitations required to generate images. Parameter mapping also facilitates interpretation of dynamic image data by summarizing spatial, temporal and spectral (i.e. chemical shift spectrum) information in a single spatial map.Methods
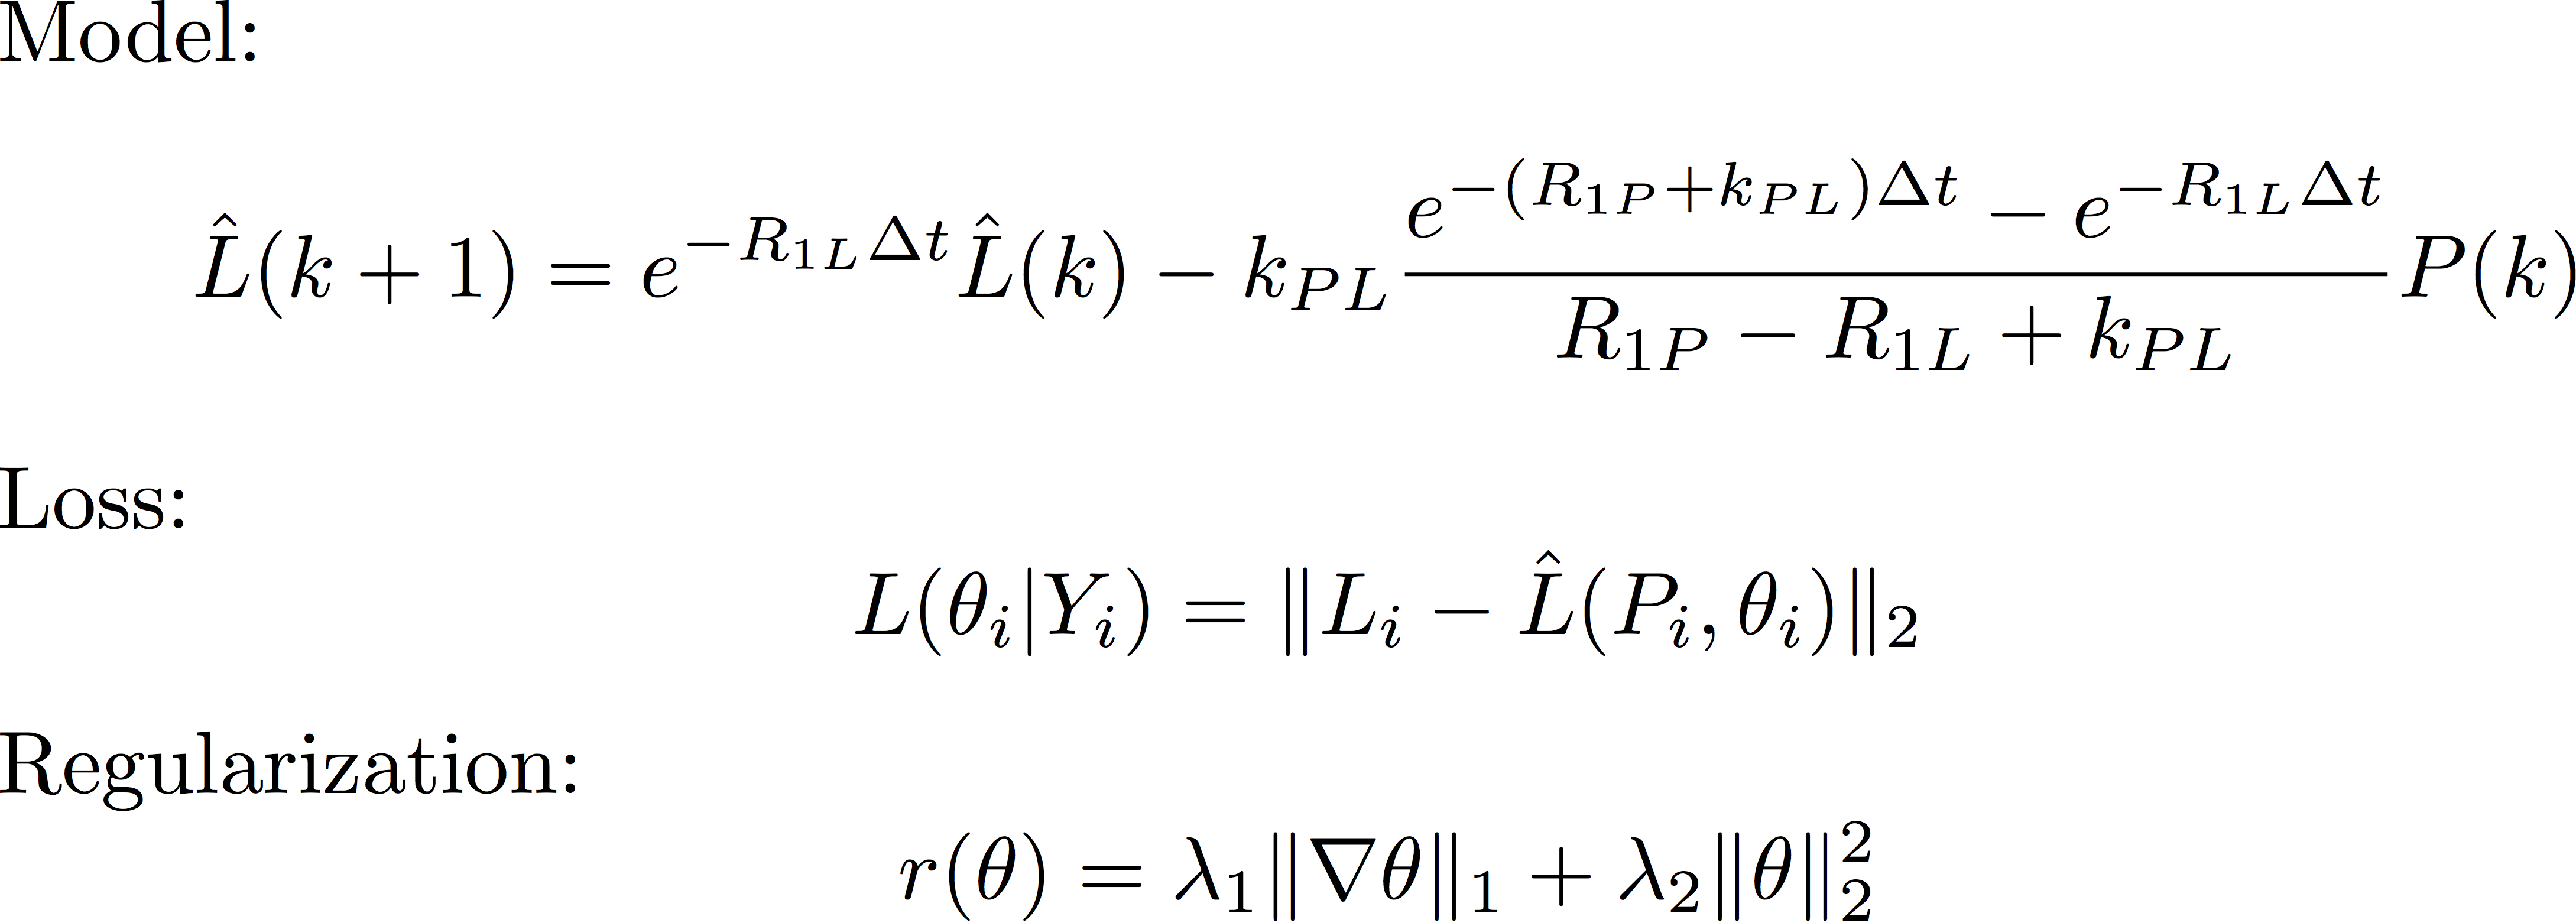
Parameter maps are naturally a form of constrained reconstruction, as they constrain the data to lie on a manifold of trajectories of the kinetic model parameterized by the model parameters. This constrained reconstruction reduces the sequence of dynamic images to a single map by exploiting temporal correlations within the dynamic imaging data. Here we demonstrate that we can exploit spatial correlations in addition to temporal correlations by integrating prior information about the parameter map through regularization. Similar approaches have recently appeared for pharmacokinetic parameter mapping in dynamic contrast enhanced MRI.2-4 Mathematically we formulate the constrained reconstruction as an optimization problem $$maximize\sum_{i\in S}L(\theta_i|Y_i)+r(\theta)$$ where the loss function L describes how well the model parameters θ_i fit the data Y_i collected from a single voxel i from the set S of all voxels, and r is a regularization term that enforces spatial structure assumed to be known a priori. The particular choices of loss function and regularization that we use in this work are given in Figure 1. We estimate parameter maps by minimizing the spatially regularized loss function using ADMM.5 This leads to an iterative reconstruction method that alternates between minimization of the individual loss functions for each voxel and a proximal mapping that depends on the spatial regularization. Using this method, the loss function minimizations become decoupled and can be performed in parallel, while the proximal mapping that couples the voxels can be computed quickly even for large matrix sizes6,7 making this reconstruction algorithm efficient in practice.
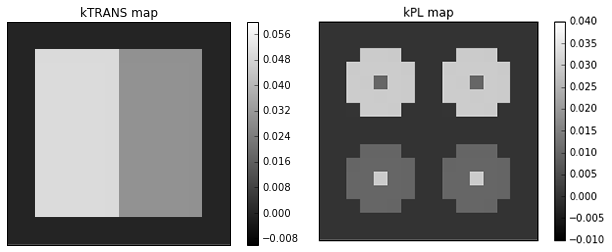
We validate our method using numerically simulated data and clinical data collected in prostate cancer studies. Simulated data are generated using the ground truth parameter maps shown in Figure 2, using the dynamical model described by Maidens et al..8 This process is repeated for different noise strengths, which correspond to signal-to-noise ratios of 8, 4, 2, and 1 in the voxel with the highest lactate signal. Clinical data were collected in an ongoing trial using a single shot EPI acquisition.9 [1-13C] pyruvate was polarized for 2 hours in a clinical polarized and the scan was started 5s after the end of injection. Pyruvate and lactate images were acquired in 16 8mm slices with a 8x8mm in-plane resolution (12.8x12.8cm FOV, 16x16 matrix size), at an effective 2s temporal resolution. Additional acquisition details are given in Gordon et al..10
Results & Discussion
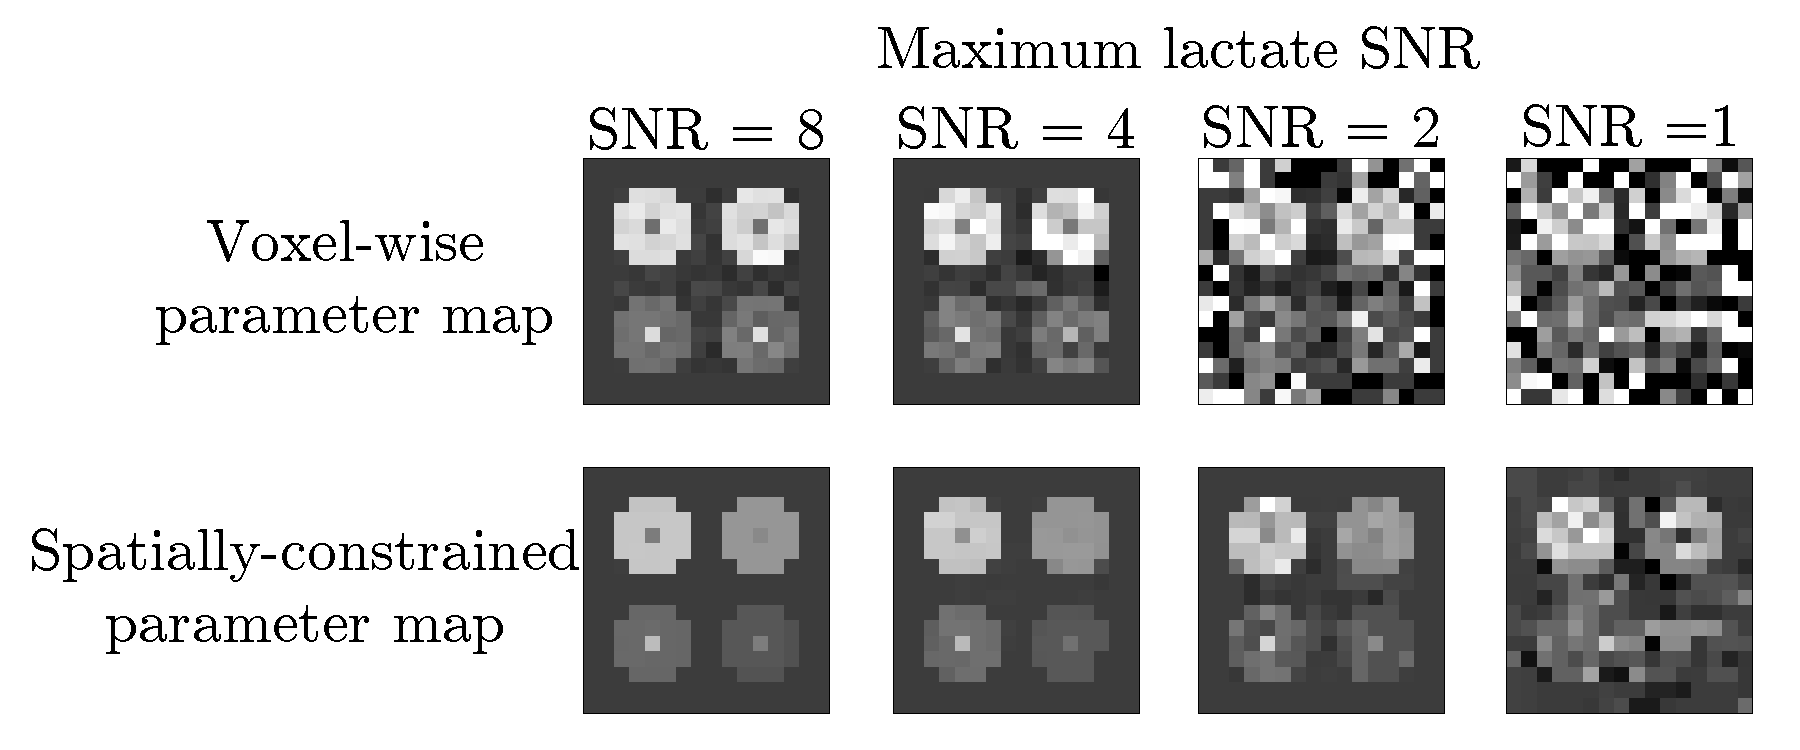
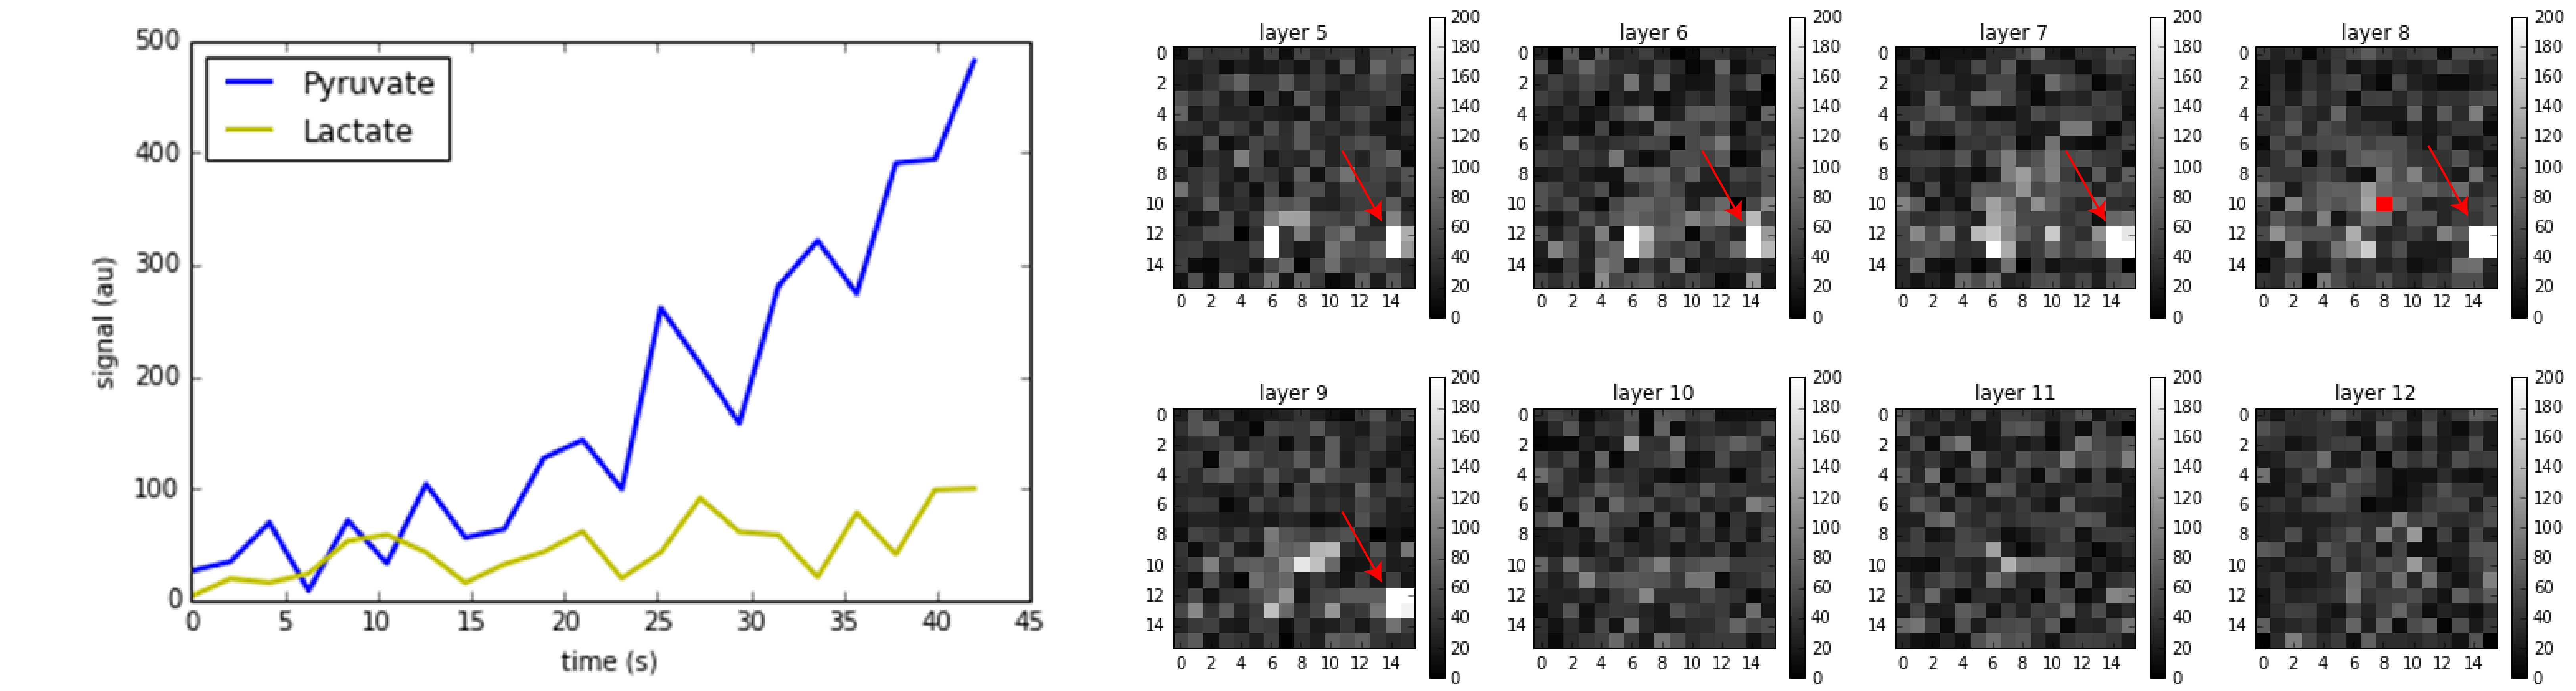
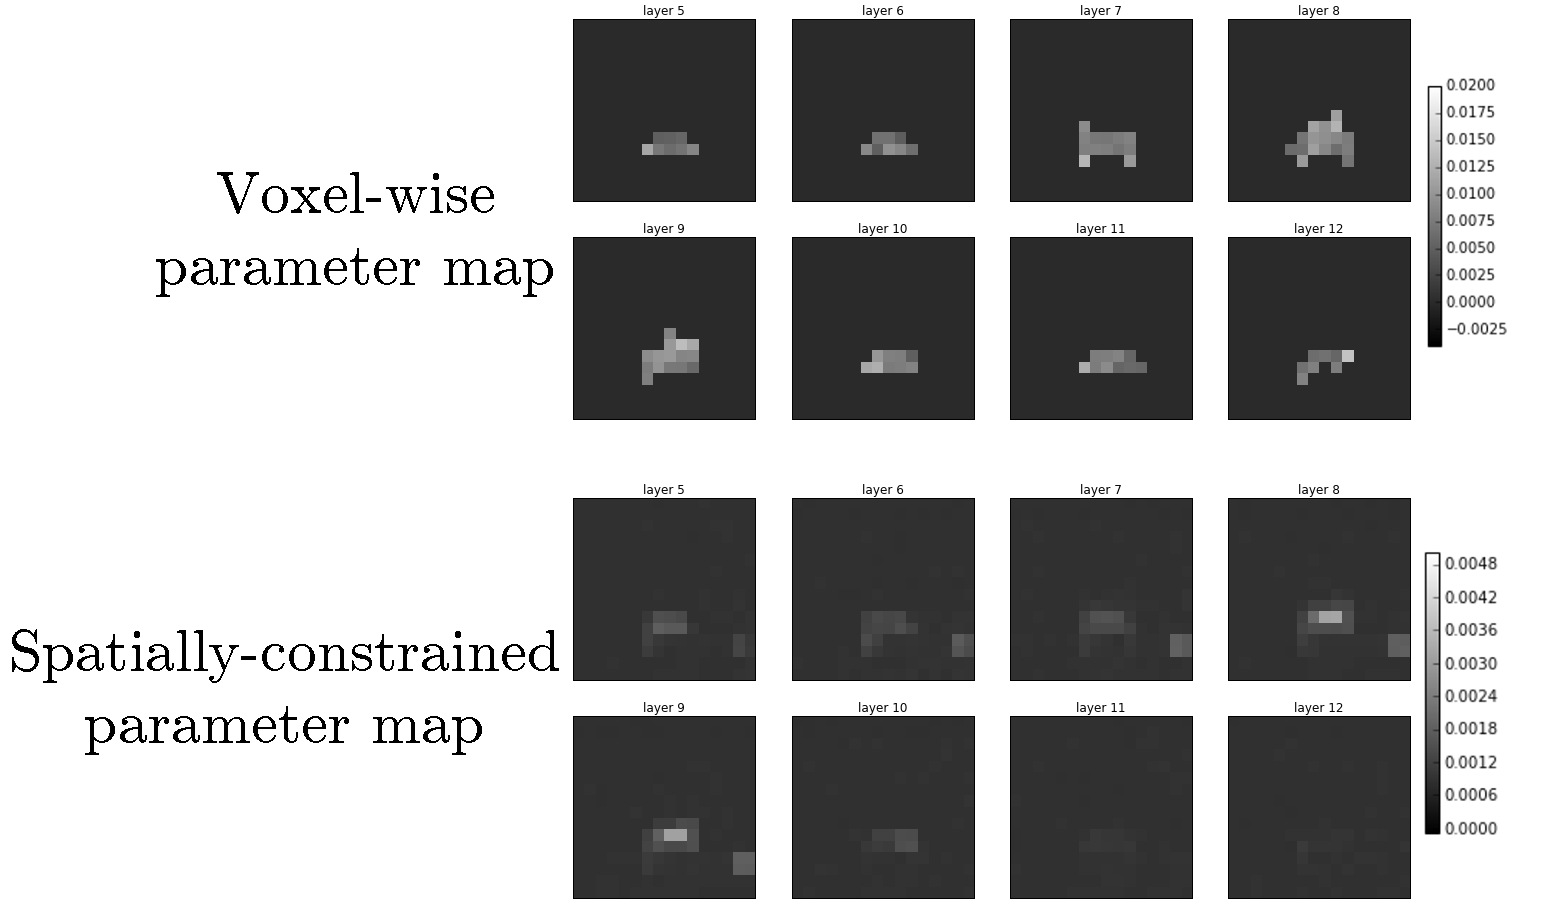
In Figure 3 we show the results of our proposed spatially-constrained parameter mapping method on simulated data. We compare our proposed method with an alternative method for parameter mapping: independent voxel-wise mapping (equivalent to our method with no regularization) with a mask based on a perfusion threshold similar to the analysis by Larson et al..11 We see that our method provides a substantial qualitative improvement in image quality across a range of noise levels. However it induces a slight quantitative bias (shrinkage) in model parameter estimates.In Figure 4 we illustrate the raw space/time/chemical data reconstructed from the EPI acquisition in a clinical prostate cancer study. In Figure 5 we show the result of our method. These results demonstrate that the addition of spatial regularization to model-based reconstruction provides two qualitative benefits: elimination of non-identifiability in unperfused background regions, and denoising. However, it does so at the expense of quantitative bias in the maps. Python code and data to reproduce these results are available at https://github.com/maidens/ISMRM-2017.Conclusion
We have shown that constrained reconstruction via spatial regularization improves the qualitative performance of model-based parameter mapping. Looking forward, the ability to exploit spatial and temporal correlations in the data for denoising could potentially help to overcome problems with low SNR in hyperpolarized MRI, enabling the reconstruction of higher resolution images.Acknowledgements
Research supported in part by NSERC postgraduate fellowship PGFD3-427610-2012 and NIH grants R01EB017449, R01CA183071 and P41EB013598.References
1. Bankson JA, Walker CM, Ramirez MS, Stefan W, Fuentes D, Merritt ME, et al., Kinetic Modeling and Constrained Reconstruction of Hyperpolarized [1-13C]-Pyruvate Offers Improved Metabolic Imaging of Tumors. Cancer research, 2015; 75(22): 4708-4717.
2. Lingala SG, Guo Y, Zhu Y, Barnes S, Lebel RM, and Nayak KS, Accelerated DCE MRI using constrained reconstruction based on pharmaco-kinetic model dictionaries. Proceedings of the 23rd Annual Meeting of ISMRM, Toronto, Ontario, Abstract 1539, 2015.
3. Guo Y, Zhu Y, Lingala SG, Lebel RM, and Nayak KS, Highly accelerated brain DCE MRI with direct estimation of pharmacokinetic parameter maps. Proceedings of the 23rd Annual Meeting of ISMRM, Toronto, Ontario, Abstract 1093, 2015.
4. Guo Y, Lebel RM, Zhu Y, Lingala SG, Shiroishi MS, Law M, et al., High-resolution whole-brain DCE-MRI using constrained reconstruction: Prospective clinical evaluation in brain tumor patients. Medical Physics, 2016; 43(5): 2013-2023.
5. Boyd S, Parikh N, Chu E, Peleato B, and Eckstein J, Distributed optimization and statistical learning via the alternating direction method of multipliers. Foundations and Trends in Machine Learning, 2011; 3(1), 1-122.
6. Barbero Á, and Sra S, Fast Newton-type methods for total variation regularization. Proceedings of the 28th International Conference on Machine Learning (ICML-11), 2011.
7. Barbero Á, and Sra S, Modular proximal optimization for multidimensional total-variation regularization. arXiv preprint arXiv:1411.0589, 2014.
8. Maidens J, Gordon JW, Arcak M, Larson PEZ, Optimizing flip angles for metabolic rate estimation in hyperpolarized carbon-13 MRI, IEEE Transactions on Medical Imaging, 2016; 35(11), 2403-2412.
9. Gordon JW, Vigneron DB, and Larson PEZ, Development of a Symmetric EPI Framework for Clinical Translation of Rapid Dynamic Hyperpolarized 13C Imaging. Magnetic Resonance in Medicine, 2016; DOI: 10.1002/MRM26123.
10. Gordon JW, Chen H-Y, Larson PEZ, Park I, Van Criekinge M, Milshteyn E, et al., Human Hyperpolarized C-13 MRI Using a Novel Echo-Planar Imaging (EPI) Approach, Proceedings of the 25th Annual Meeting of ISMRM, Honolulu, Hawaii, USA, Submission #5415.
11. Larson PEZ, Gordon JW, Maidens J, Arcak M, Chen H-Y, Reed G, et al., Robust Quantitative Methods Applied to Clinical Hyperpolarized C-13 MR of Prostate Cancer Patients, Proceedings of the 24th Annual Meeting of ISMRM, Abstract 2347, 2016.
Figures